-
-
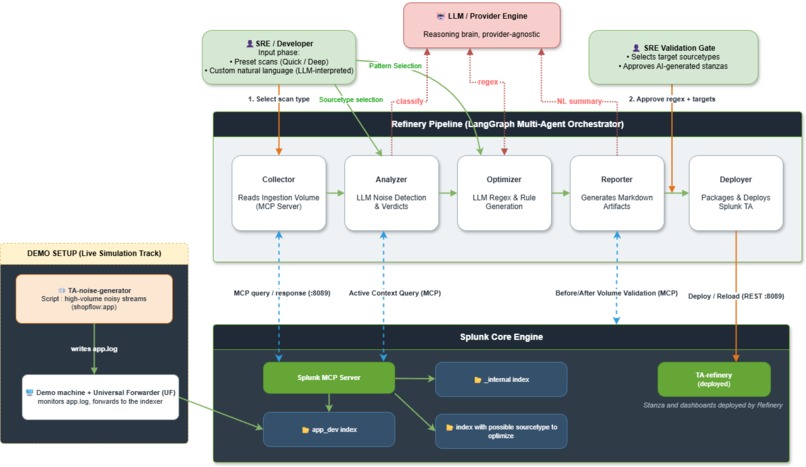
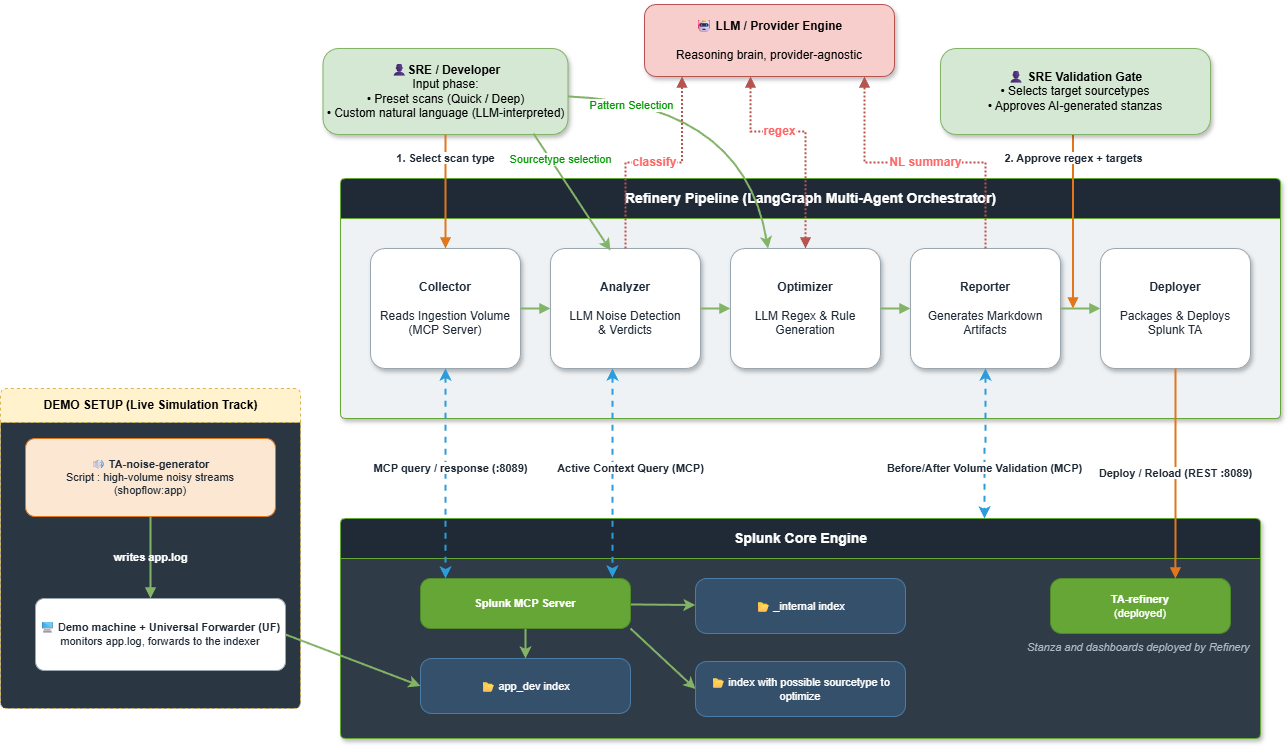
Splunk AI Refiner Architecture
-
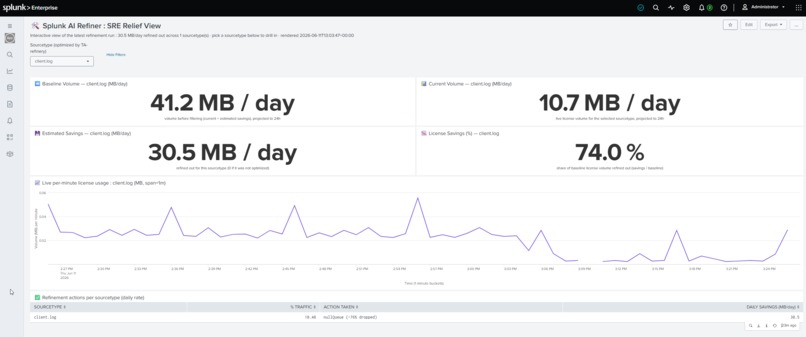
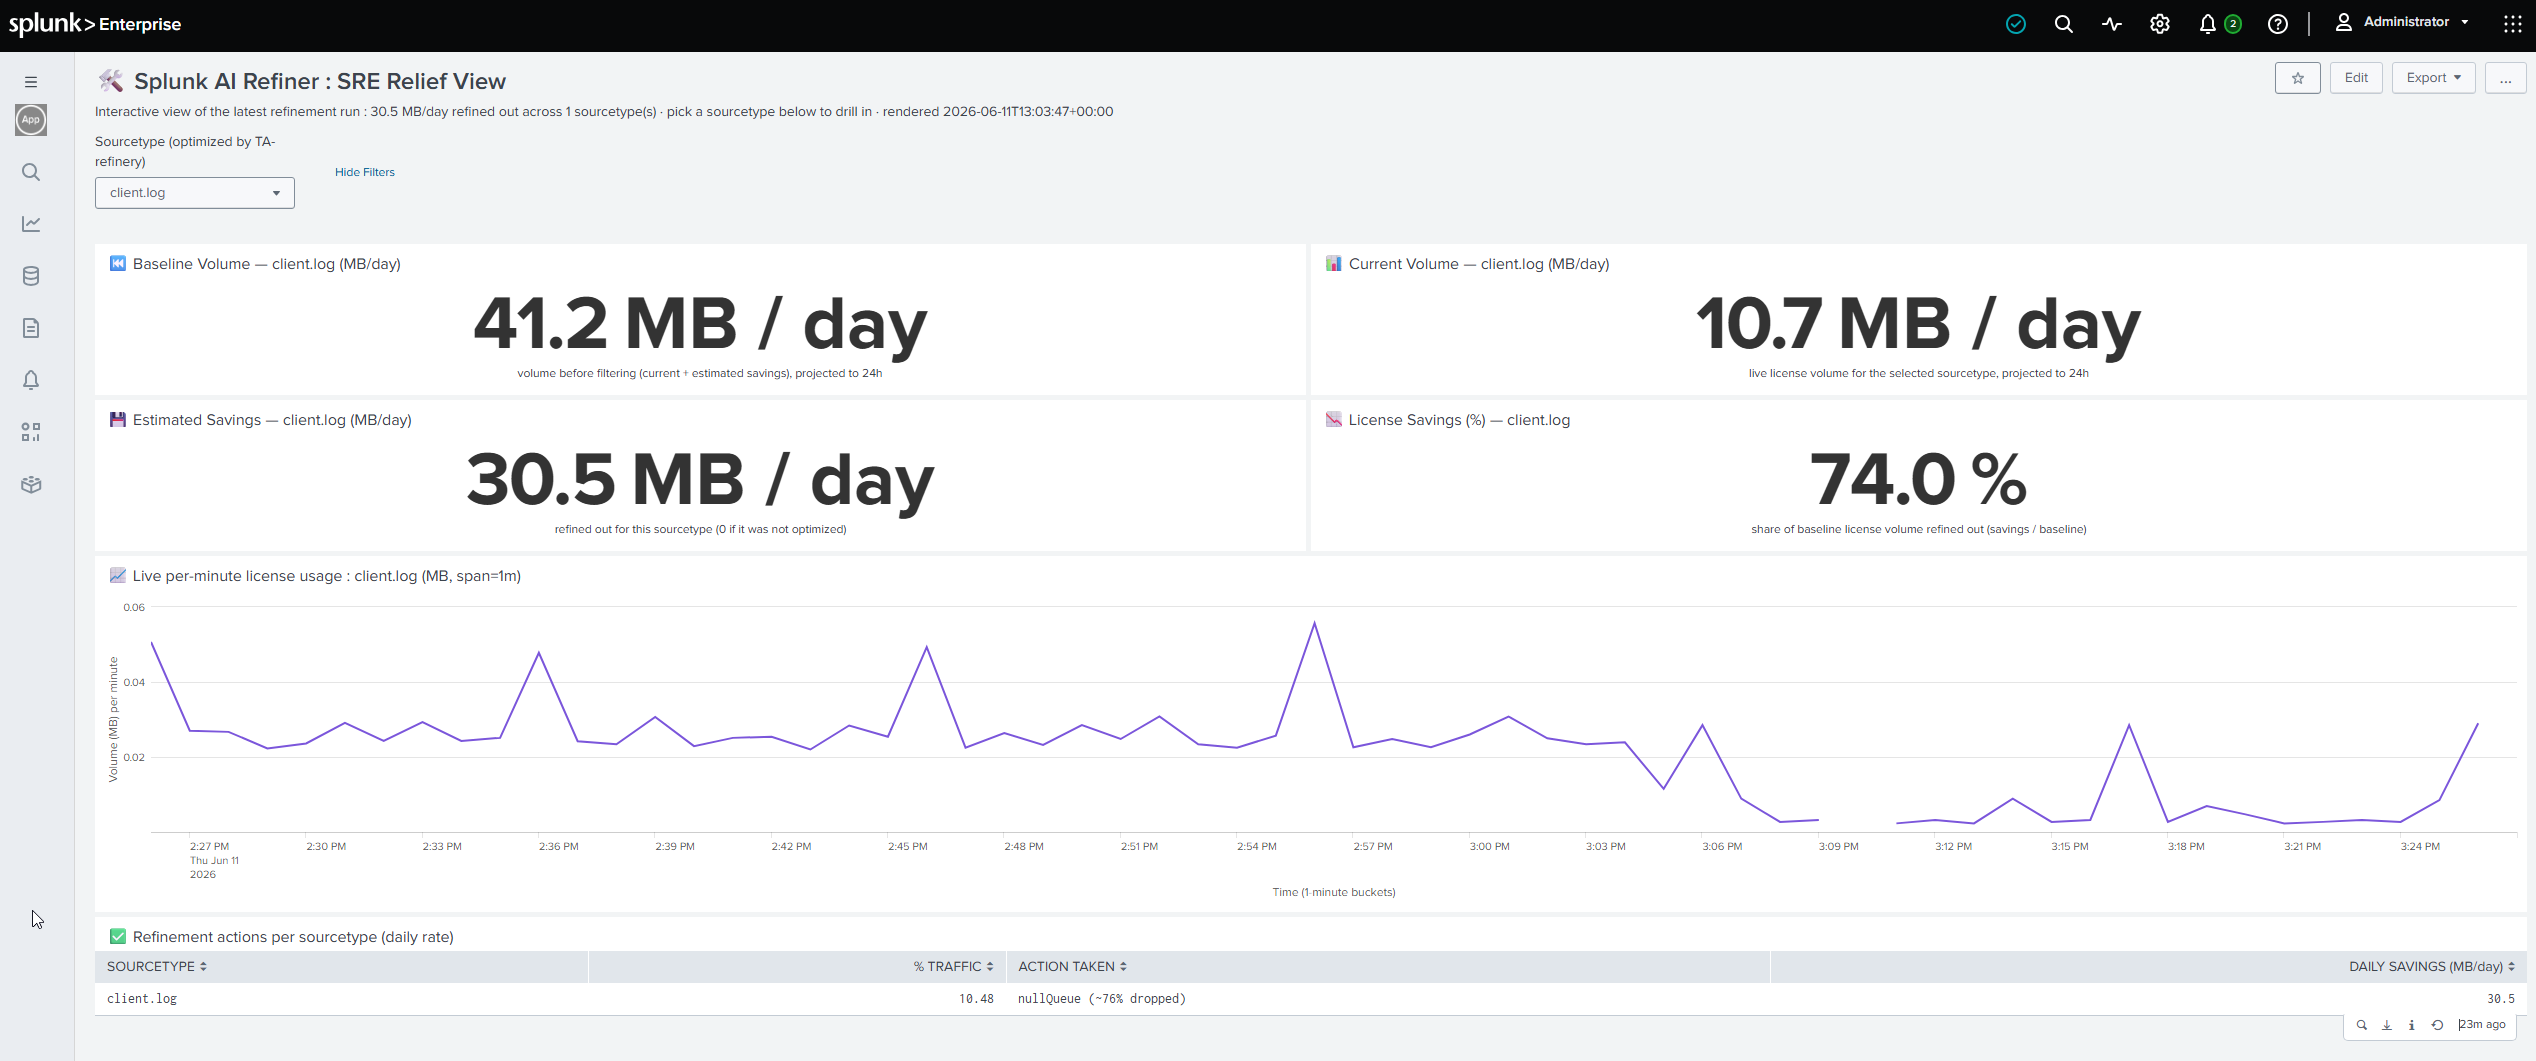
Splunk AI Refiner Dashboard
Inspiration
Every Splunk admin knows the pain: a sourcetype is flooding the indexer, and your license bill is climbing. One of the standard solutions is to tweak props.conf and transforms.conf to route that noise to the nullQueue, but doing this manually is incredibly tedious and time-consuming.
It gets worse in the real world:
- Third-party and vendor apps spray DEBUG and health-check noise, and you cannot ask them to rewrite their logging.
- Dev apps must stay in DEBUG for the developers, but logging frameworks give you no granularity to send only the useful lines to Splunk.
- During an incident, a log storm hits and you need to cut the noise now, not after a three-day change ticket.
- Orphaned systems and legacy code keep pumping out gigabytes of data, but the original developers left years ago and nobody knows who owns the system or how to safely change its logging configuration.
This led me to a single question: could I offload the tedious, error-prone regex creation to an LLM, while ensuring the human retains absolute authority over the final, auditable Splunk configurations?
What it does
Splunk AI Refiner is an end-to-end CLI co-pilot that takes you from "my ingestion is too expensive" to a live, deployed filter and an ROI dashboard without you writing a single line of regex.
- Scans ingestion (read-only). Measures real license volume by sourcetype, host, and index. In my demo, one sourcetype (shopflow:app) was 94.2% of all traffic.
- Classifies the noise with an LLM. LLM samples real events and labels each sourcetype as noise, mixed, or keep. For ambiguous "mixed" cases it goes back to Splunk to probe for error/exception markers, so it never throws away signal.
- Proposes interactive index-time filters. A conversational deep-dive walks you through each noise pattern, measures its real volume live, and asks you to confirm. You stay in the loop on every drop.
- Calculates honest ROI : bytes and lines. It reports both the Event Drop % (lines filtered) and the License Drop % (bytes saved), because Splunk meters bytes, not events. My DEBUG/TRACE filter was ~80% of lines but ~49% of bytes and the byte number is the one your bill cares about.
- Deploys automatically. It generates clean, standard props.conf / transforms.conf nullQueue stanzas into a dedicated Splunk app, applies them over REST, and reloads, no manual file editing.
- Closes the loop with a dashboard. A ROI dashboard shows Baseline vs Current volume, MB/day saved, a stable License-Savings %, and a live per-minute "cliff" graph as the filter takes effect.
How I built it
- Python single-process CLI, with a hybrid TUI (preset menus + interactive prompts) for a clean, scannable operator experience.
- Splunk MCP (Model Context Protocol) as the gateway for all read-only measurement and sampling queries.
- Splunk REST API for the write path: rendering a dedicated TA app and hot-reloading it without a restart.
- Claude Sonnet 4.6 (in this demo) as the reasoning engine: noise classification, conversational pattern proposals, regex generation, and natural-language rationale.
- Dynamic SPL and Simple XML to generate the dashboard at deploy time, with byte-weighted math throughout so every figure maps to real license relief.
Architecturally, the pipeline runs as a sequence of focused agents (collect, analyze, optimize, report, deploy) sharing one context.
Challenges I ran into
- Keeping the human strictly in the loop. LLMs are incredibly good at pattern recognition, but they lack business context. For instance, the AI might see a thousand identical ERROR logs, classify them as redundant noise, and propose dropping them. While technically correct, hiding those could blind the business to a critical outage. I had to design the UX to ensure the LLM acts purely as a co-pilot—providing strict interactive guardrails so no critical line is ever routed to the nullQueue without explicit human approval.
- Maximizing the Splunk MCP Server architecture. I didn't want a static, disconnected AI. Architecting the tool to fully leverage the Model Context Protocol (MCP) required precise engineering. I had to build a robust bridge so the LLM could dynamically execute live SPL queries, measure actual byte volumes, and validate context in real-time, all without overwhelming the indexers or the API.
- Bytes vs lines. Counting events overstates savings whenever noise lines are short and the kept events are heavy (think tiny DEBUG lines vs fat JSON). I re-based the entire measurement model on bytes (using raw payload lengths) to match how Splunk actually licenses, while still surfacing the line-drop % for context.
- Avoiding double-counting overlapping filters. When multiple patterns overlap (DEBUG already covers DEBUG-level health checks), naive math inflates the savings. I made measurement compounding and incremental so accepted patterns never double-count.
Accomplishments that I'm proud of
- A genuinely pleasant hybrid CLI UX. Quick-Scan presets for speed, an interactive deep-dive for control, live MCP-measured volumes at every step, full untruncated regex previews, and an explicit human approval gate before anything is written.
- Smart Skip deduplication. Once you accept a broad pattern, the co-pilot automatically detects and skips narrower patterns it already covers ("already covered, no double-count"), so you are never asked redundant questions and the ROI stays honest.
- No black box. Everything the LLM proposes is rendered as standard, readable Splunk config that the admin reviews and owns.
What I learned
- Mastering the Model Context Protocol (MCP): I learned how to transition from static LLM prompting to truly agentic workflows. By leveraging Splunk's MCP server, I empowered the LLM to autonomously reach back into the environment—executing live SPL queries, pulling surrounding log context, and validating its own hypotheses in real-time before making any filter recommendations.
- Advanced SPL metadata manipulation: byte-weighted volume math, license usage extrapolation to daily rates, and reconstructing baselines when the underlying data is intentionally gone.
- Bridging CLI workflows with LLM reasoning: keeping the model's judgment separate from the I/O layer, designing prompts that propose measurable actions, and always validating the model's claims against hard numbers from Splunk before acting.
What's next for Splunk AI Refiner
- Community Beta Testing & Contribution. I want to get this tool into the hands of real practitioners. My next immediate step is to find Splunk admins and SREs willing to battle-test the Refiner in their own sandbox environments and actively contribute to the project's open-source roadmap.
- Intelligent AI-Driven Sampling. Beyond strict "keep or drop" binary rules, I plan to implement dynamic sampling (e.g., indexing 1 out of every 100 identical repetitive errors). The LLM will evaluate pattern redundancy and recommend the optimal sampling ratio to maintain statistical visibility while slashing costs.
- One-click auto-rollback and safety nets. Versioned filter sets with a single command to revert, plus a "canary" mode that watches kept-event volume after deploy and auto-rolls-back if a critical signal disappears.
- Multi-cluster / fleet deployment. Push validated TAs across multiple indexers and search head clusters via the deployment server, with per-environment dry-runs and drift detection.

Log in or sign up for Devpost to join the conversation.