-
-
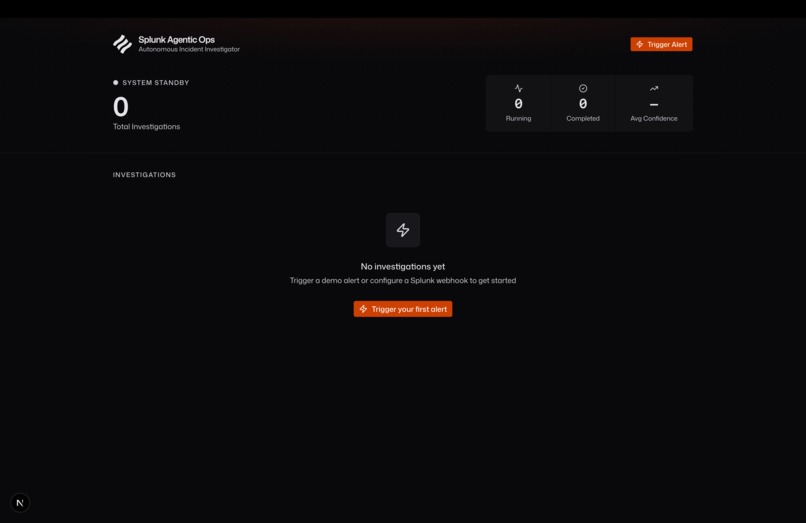
Empty Dashboard
-
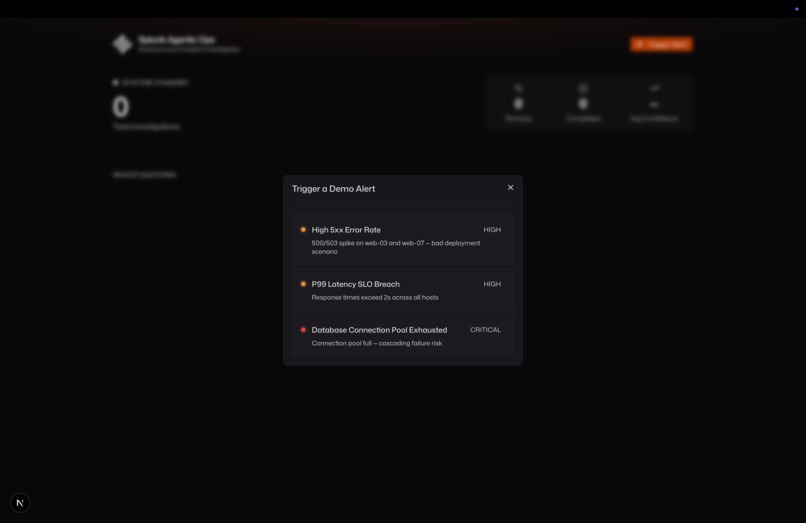
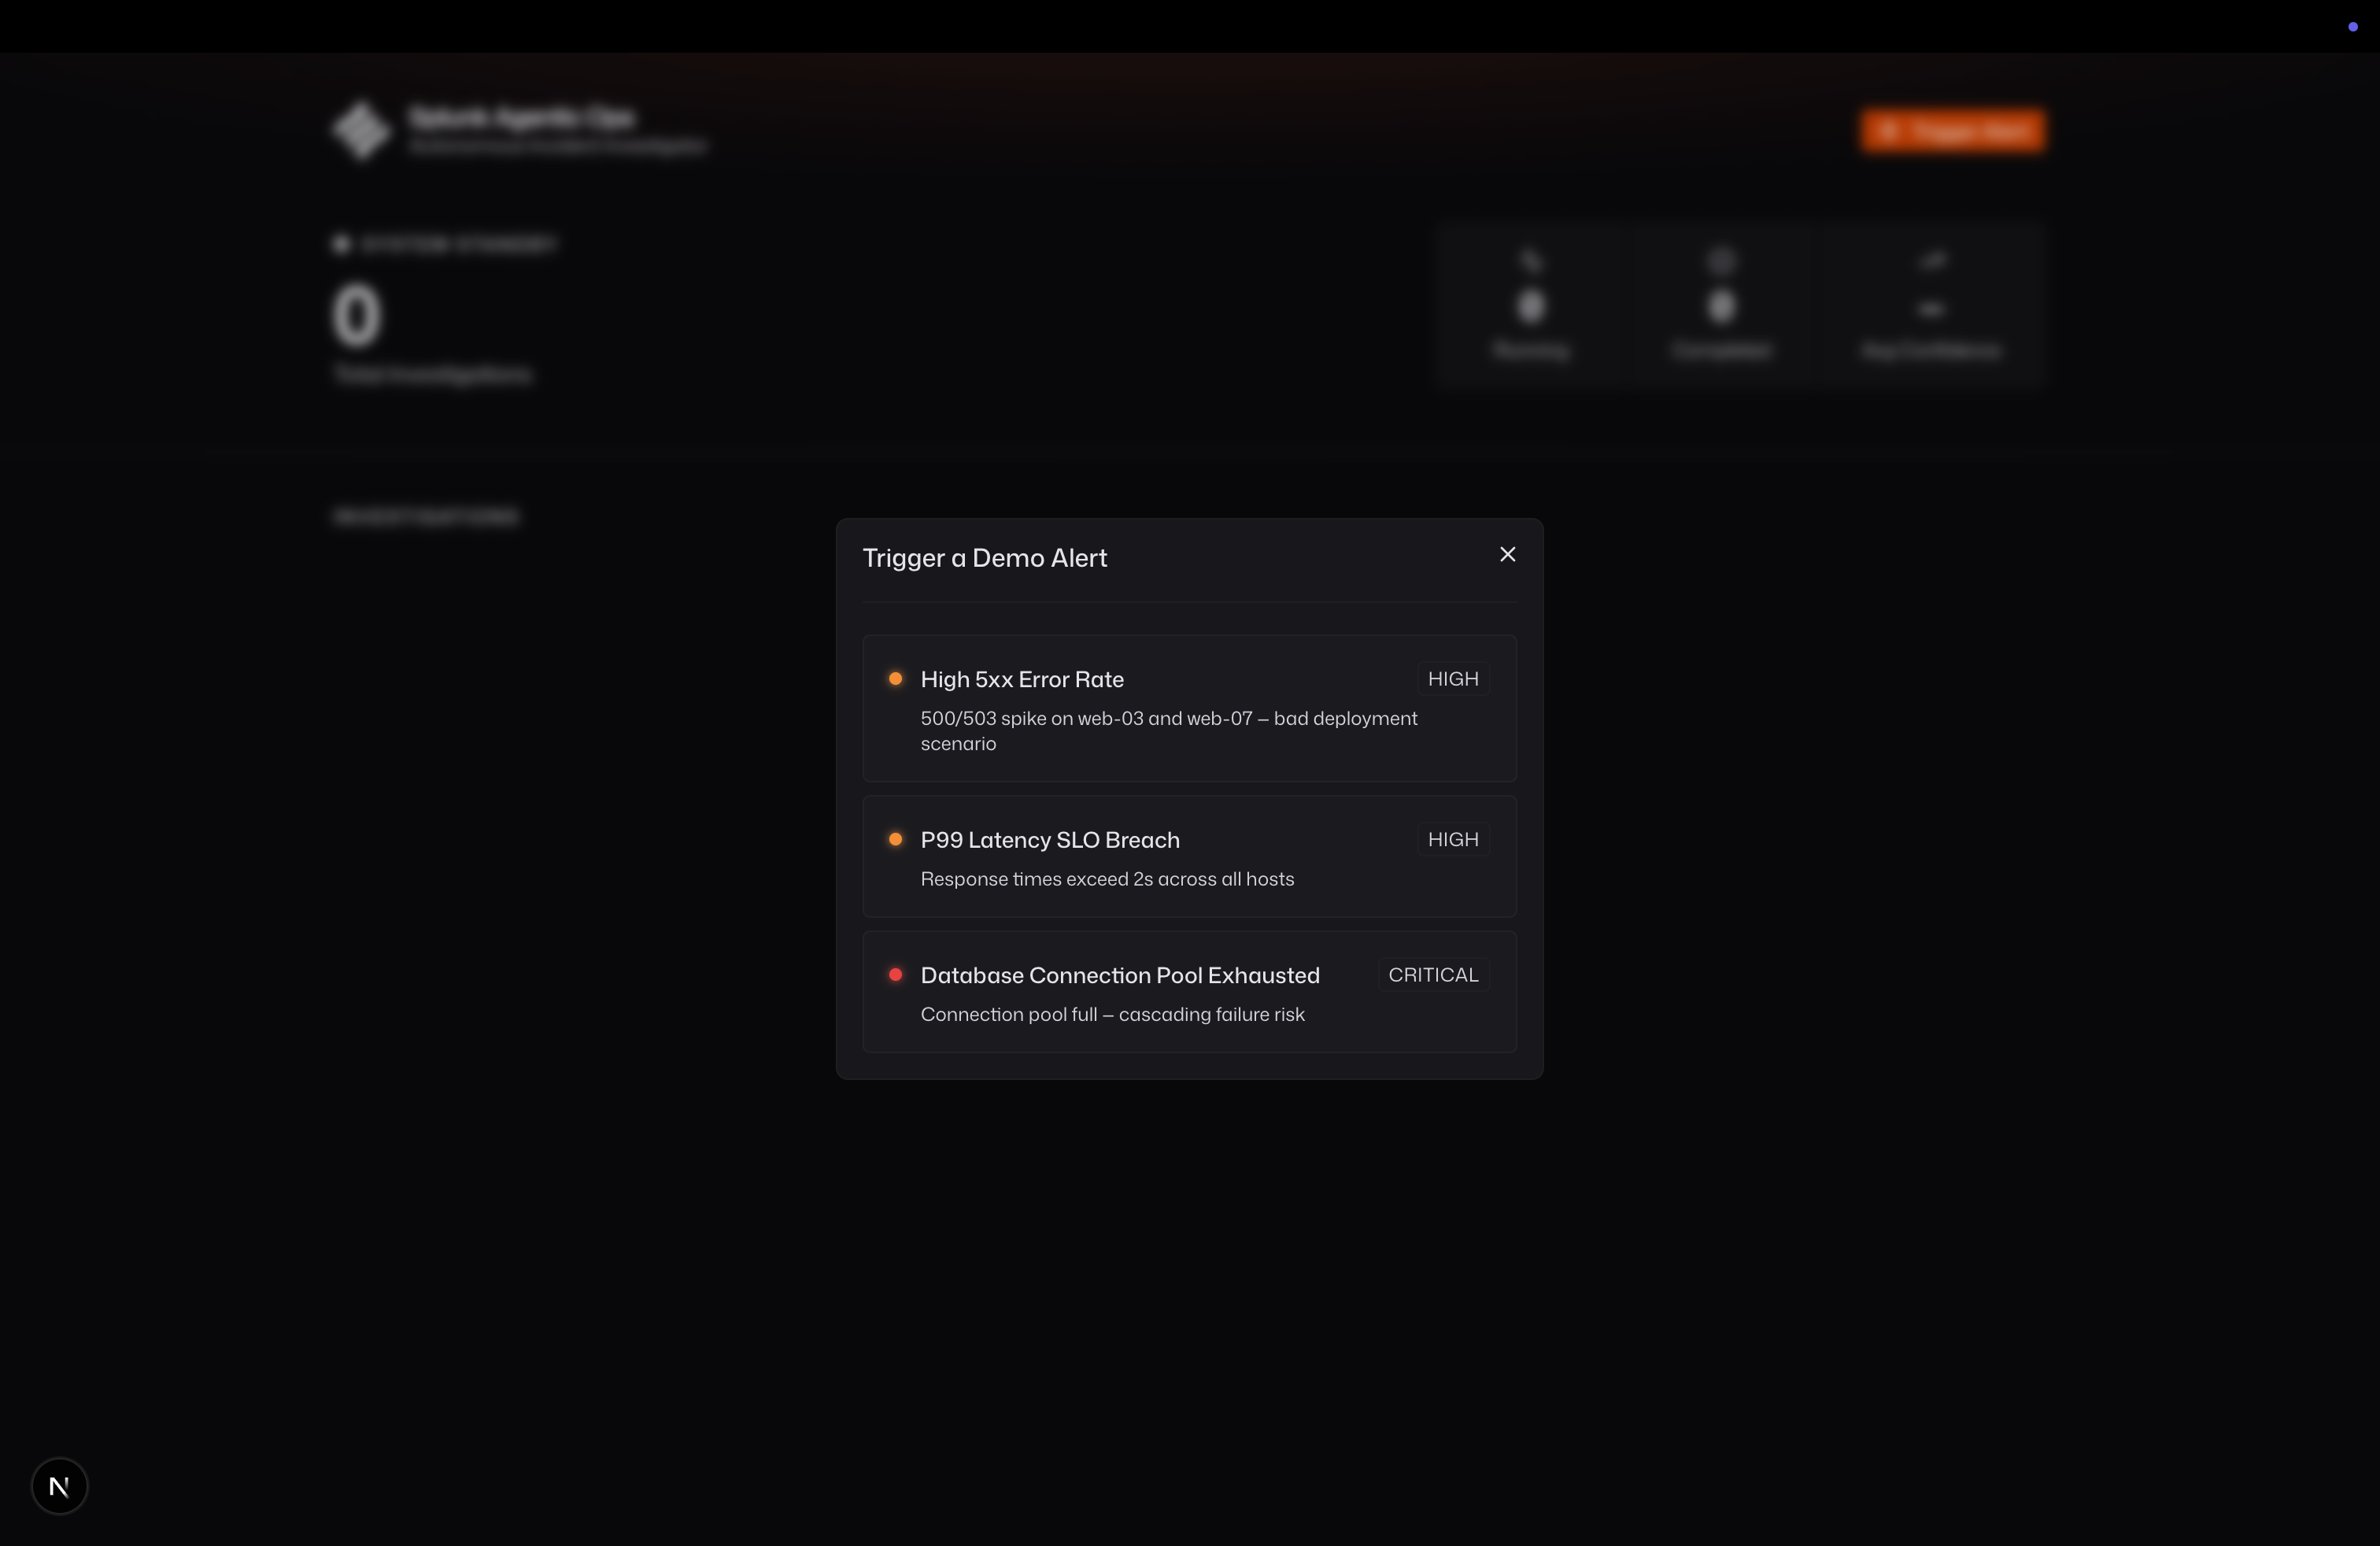
Simulate Incident Menu
-
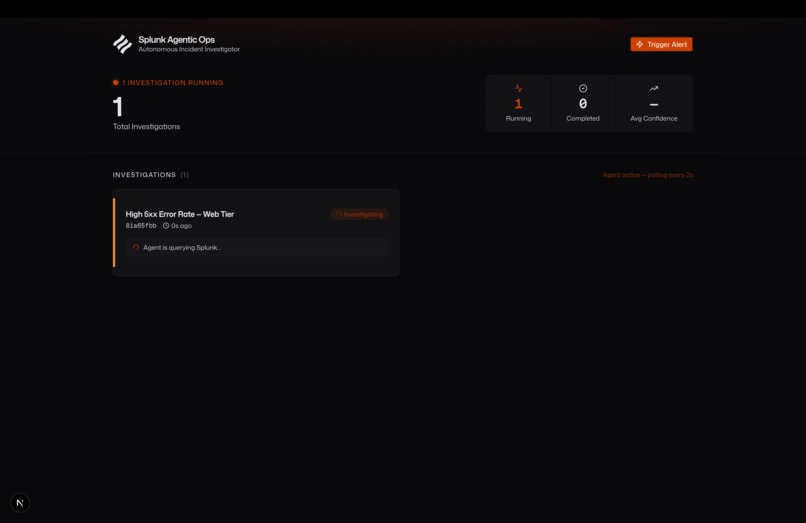
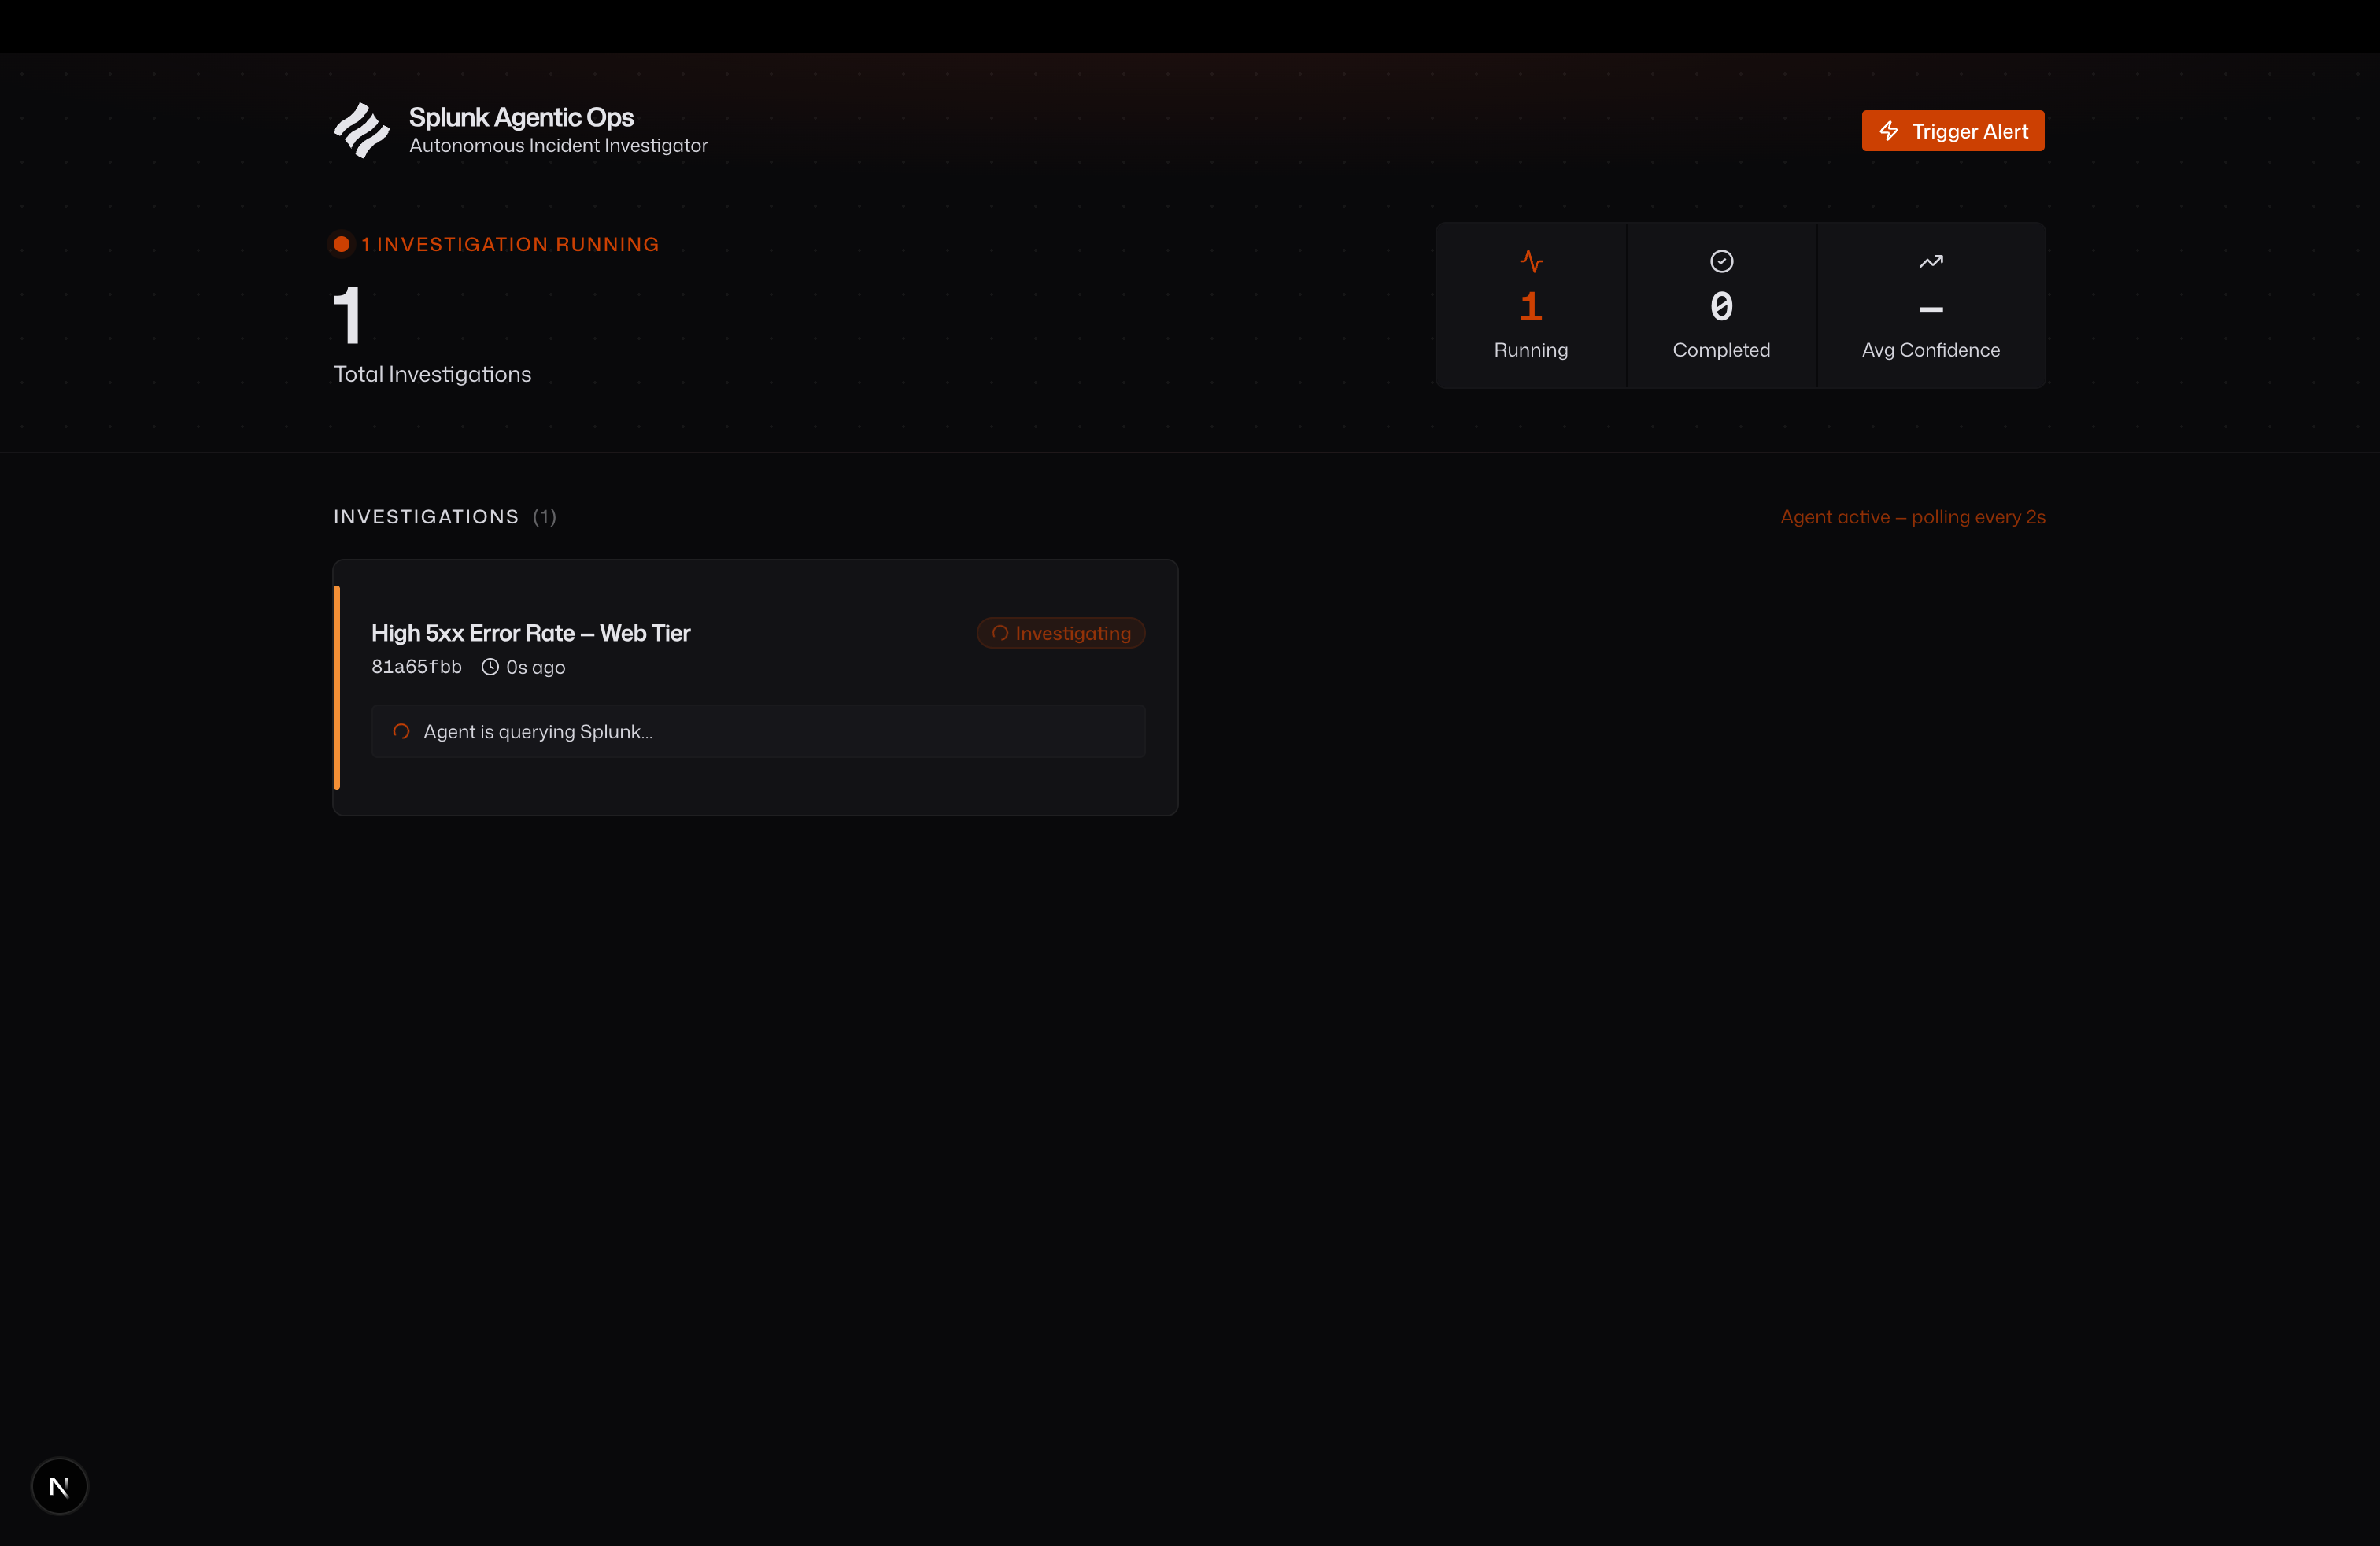
Incident Loading
-

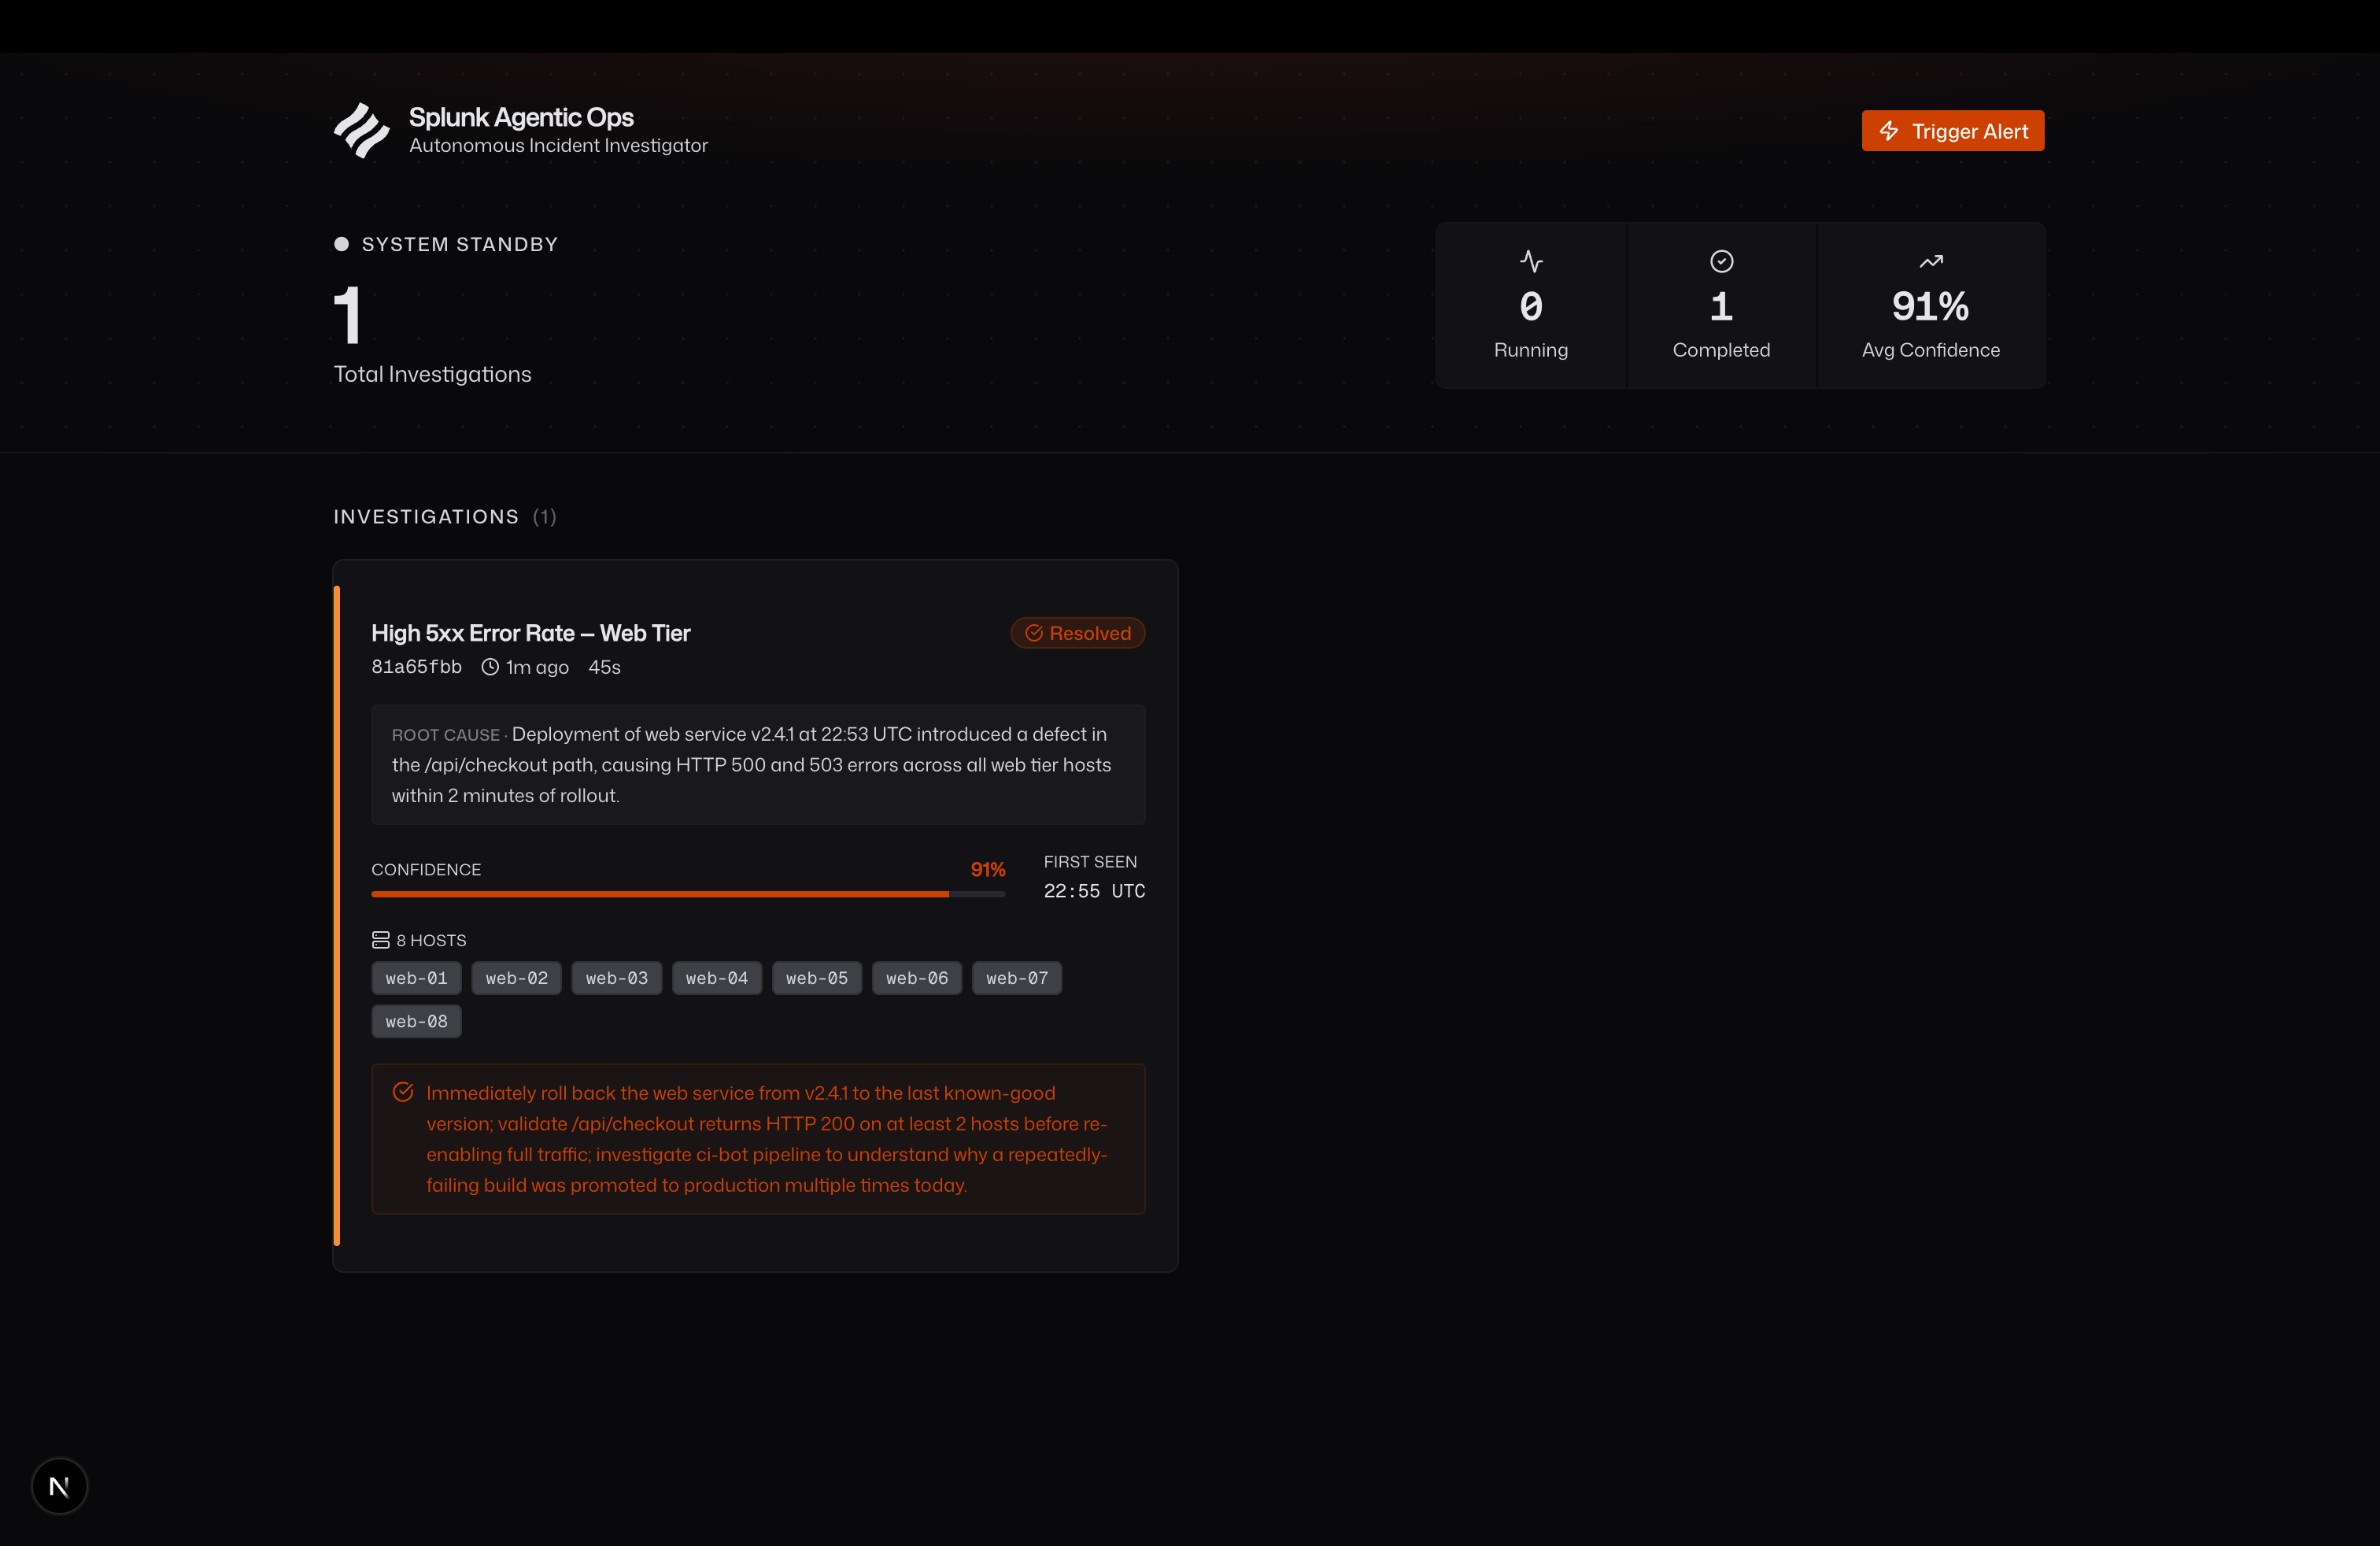
Incident Report
-
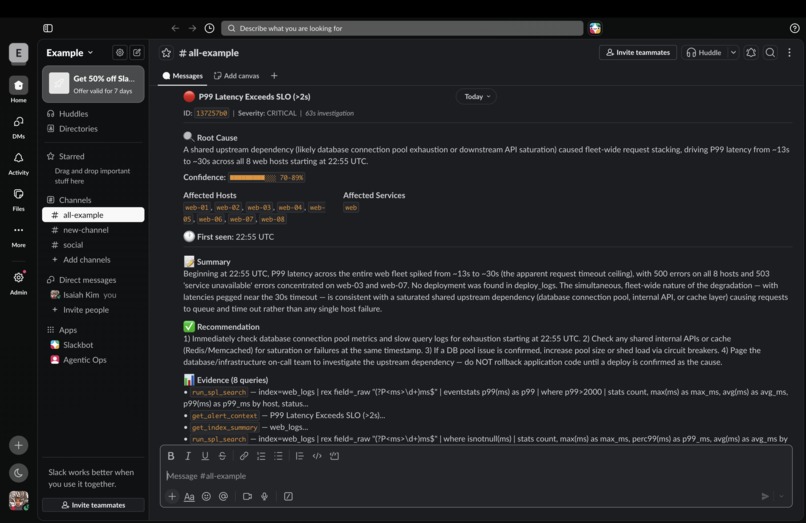
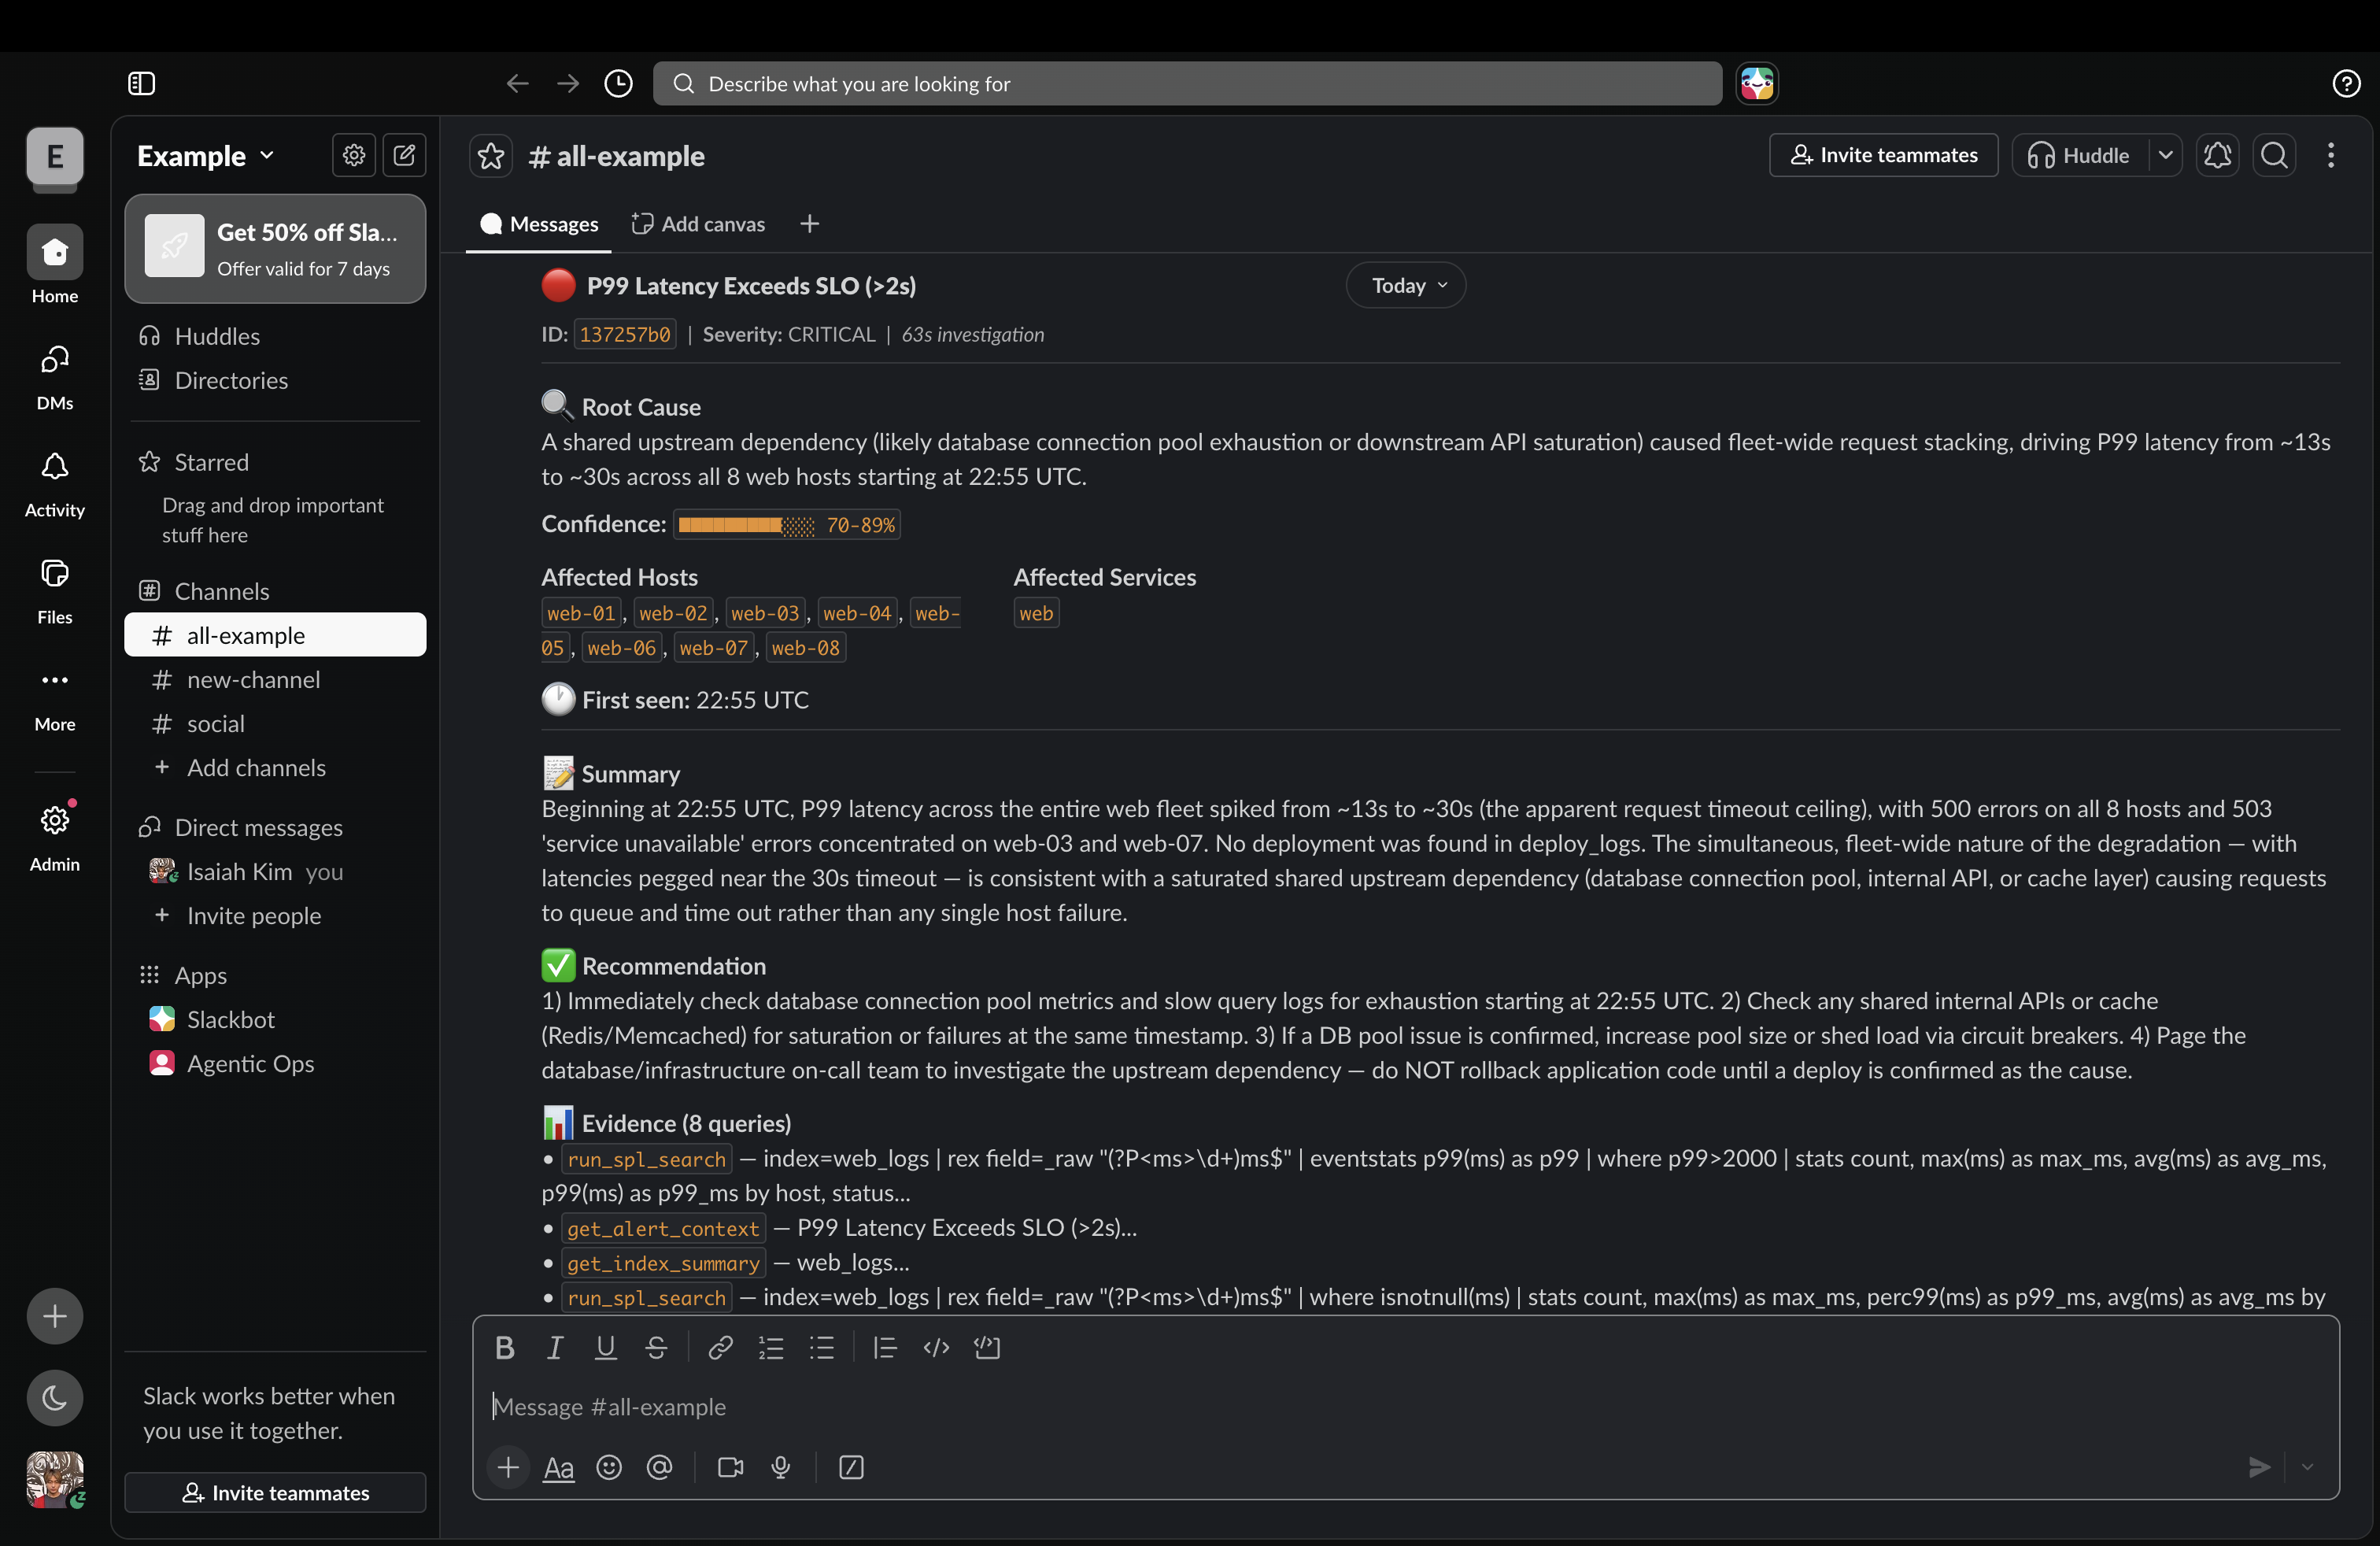
Slack (P99 Latency Exceeds SLO)
-
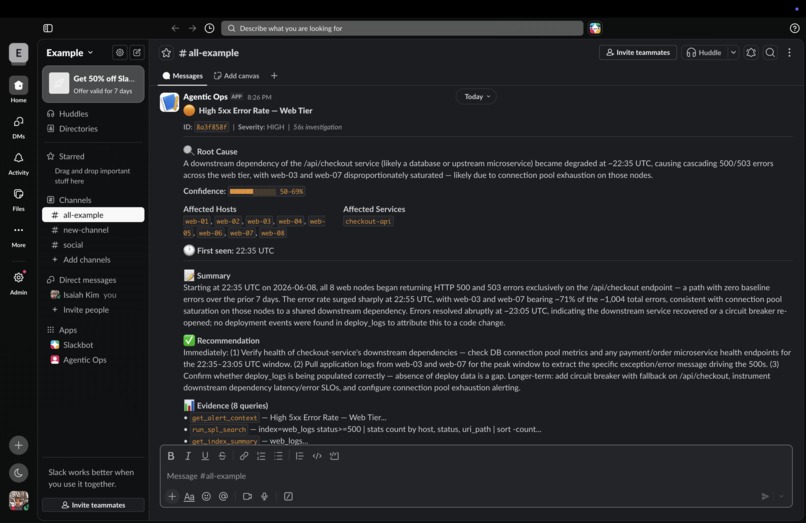
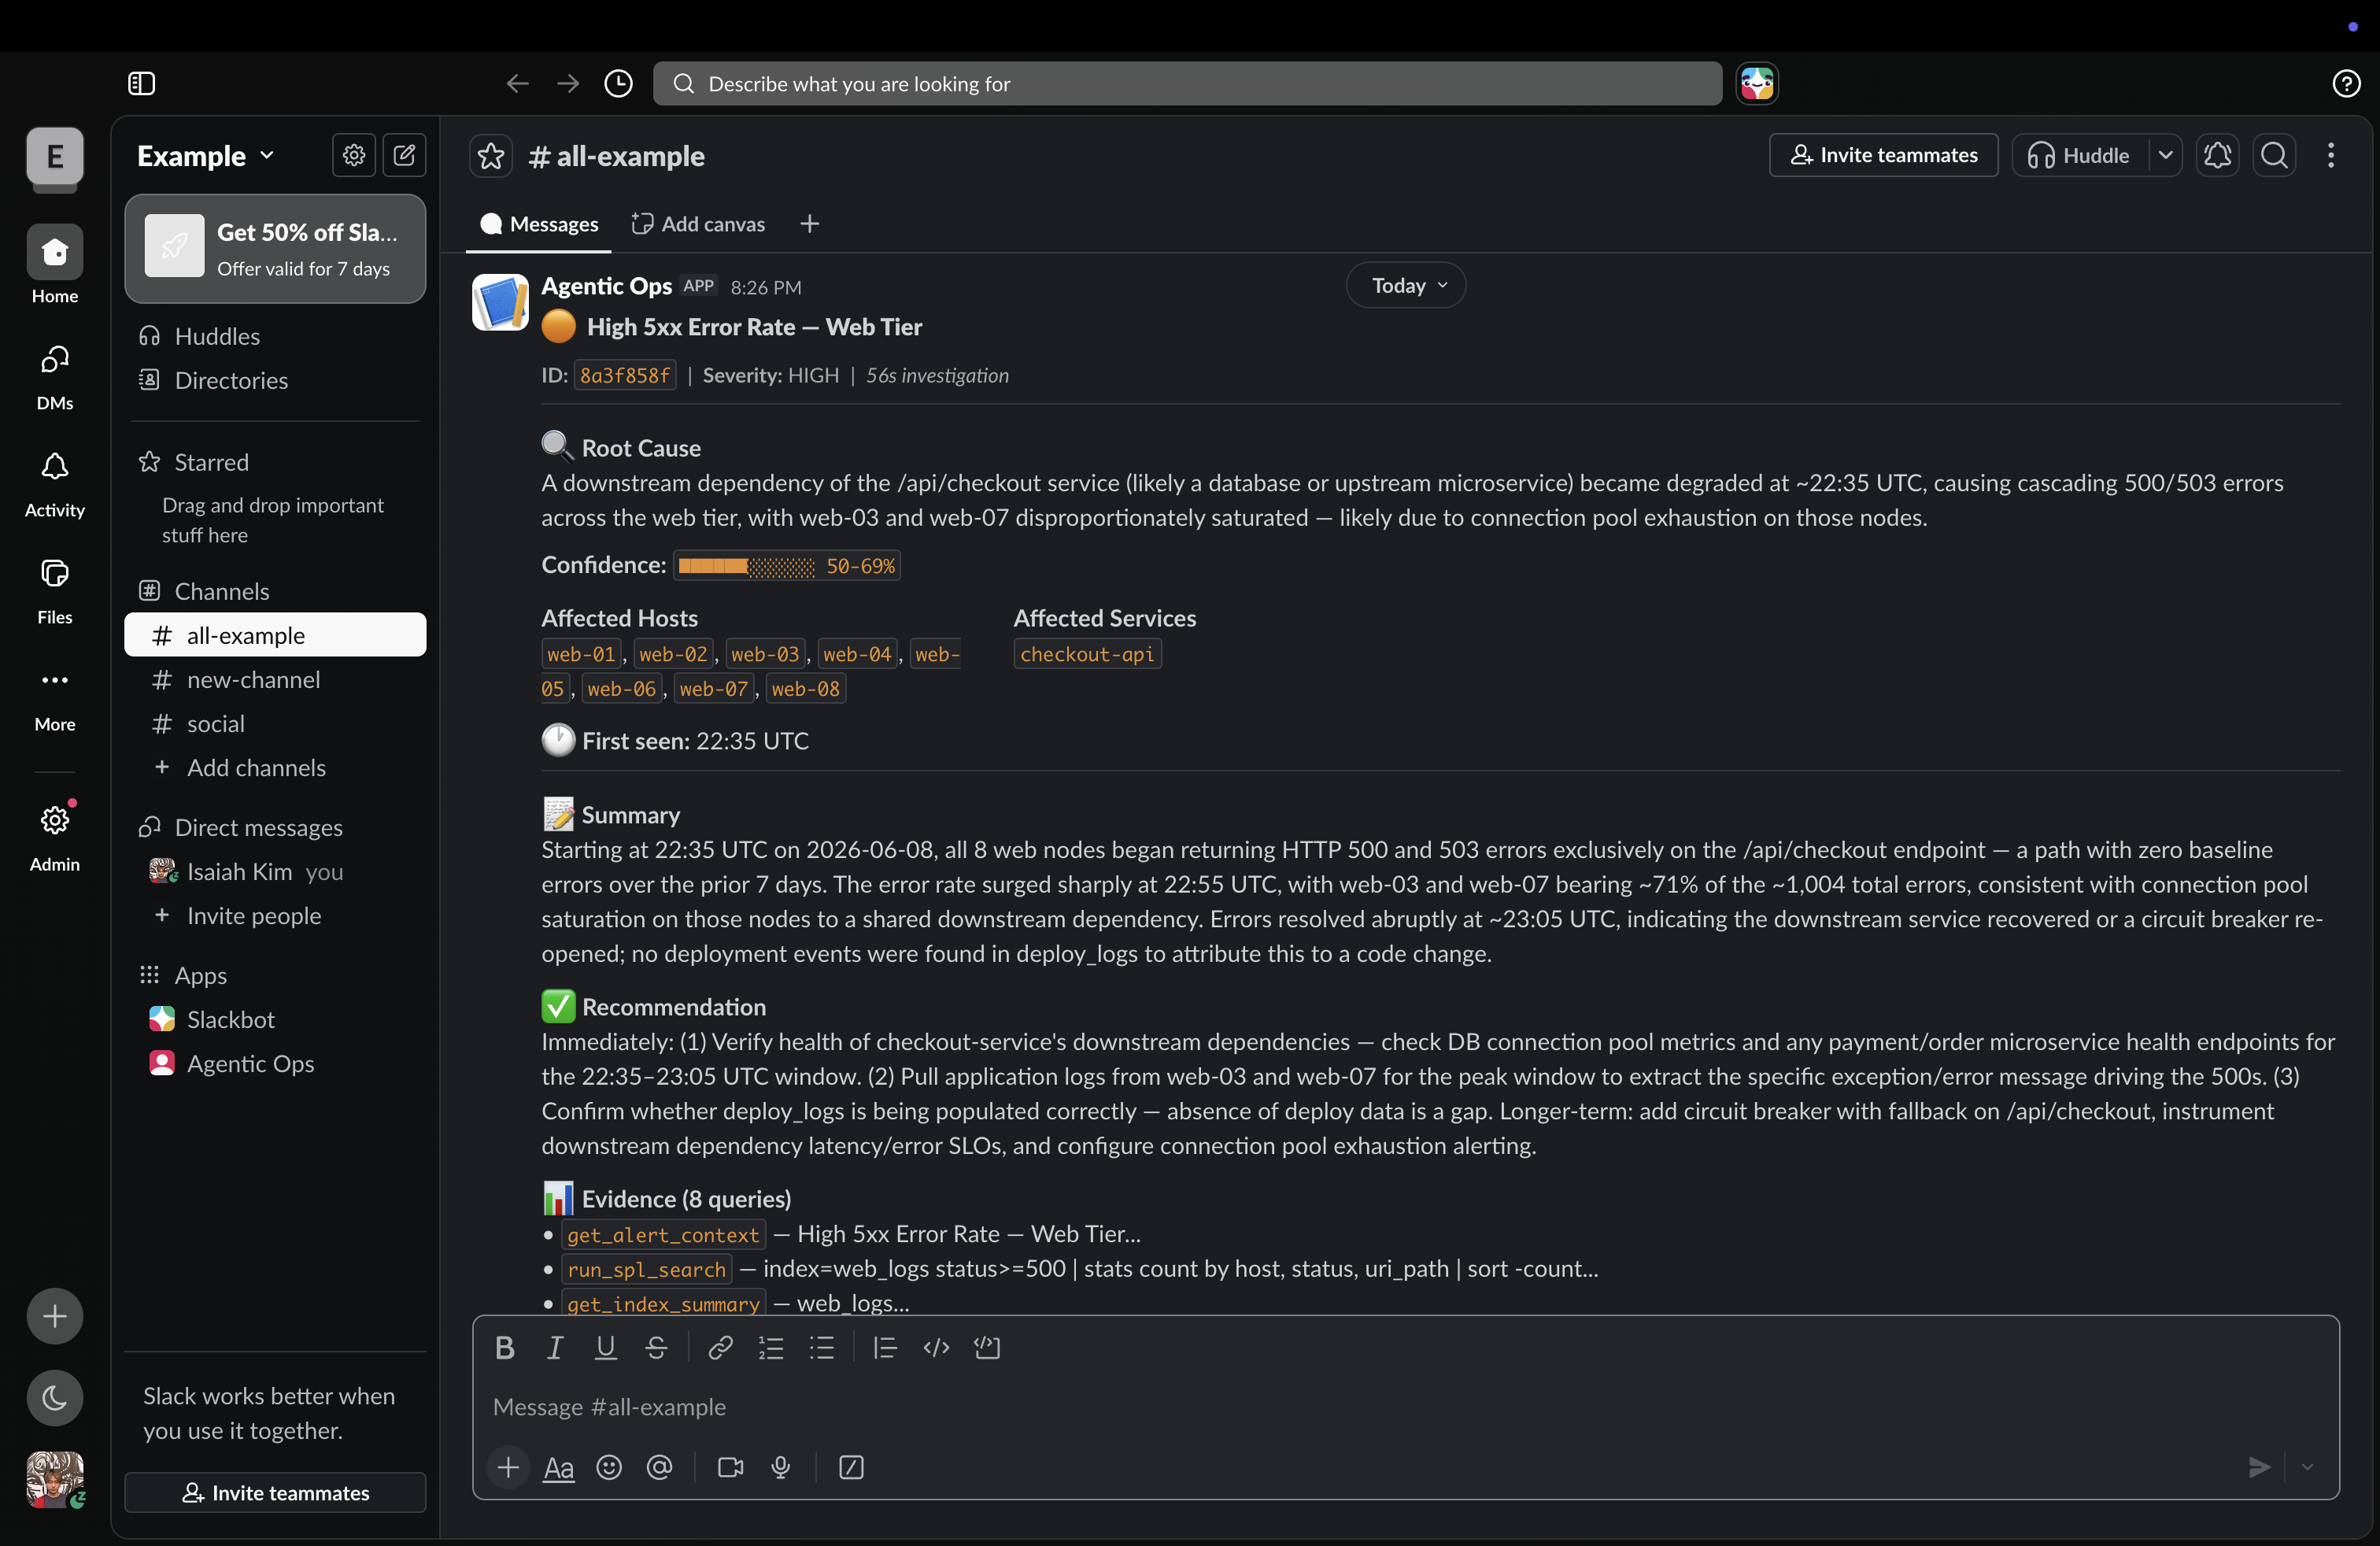
Slack (High 5xx Error Rate)

Splunk Agentic Ops 🔍
Hackathon: Splunk Agentic Ops Hackathon — Observability Track
Live Demo: https://splunk-agentic-ops.vercel.app
Repo: github.com/kyisaiah47/splunk-agentic-ops
Inspiration
On-call engineers spend the first 15–30 minutes of any incident doing the same thing: running SPL queries, checking baselines, hunting for a recent deploy, correlating hosts. It's repetitive, stressful, and happens at 3am. I wanted to automate exactly that loop — not with a static runbook, but with an AI agent that reasons like a senior SRE.
What It Does
When a Splunk alert fires, Splunk Agentic Ops takes over the investigation autonomously:
- Triage — confirms the alert, identifies which hosts and services are affected, and scopes the blast radius
- Baseline Comparison — compares current error rates or latency against a 7-day rolling baseline at the same hour to distinguish noise from a real incident
- Root Cause Investigation — checks deploy logs for recent releases, hunts for correlated infra events (OOM kills, CPU spikes, disk pressure), and traces upstream dependency failures
- Structured Report — produces a root cause, confidence score (0–100%), first-seen timestamp, affected hosts, and a specific remediation recommendation
- Slack Notification — posts a full Block Kit incident report automatically, no human needed
- Live Dashboard — a real-time command center showing all investigations, their status, and results as they complete
The entire loop — alert fires to Slack report — completes in under 30 seconds.
How I Built It
Architecture
Splunk Enterprise
  ├── web_logs / app_logs / deploy_logs (HEC ingest)
  └── Saved Search Alert
            │  Webhook
            ▼
FastAPI Backend (Python)
  POST /webhook/splunk
            │
            ▼
  Background Task: investigate_alert()
            │
            ▼
Claude claude-sonnet-4-6 (Anthropic API)
  4-phase SRE Investigation Playbook
  Agentic tool-use loop (max 8 SPL calls)
        │
        ├── run_spl_search()
        ├── get_alert_context()
        └── get_index_summary()
        │
        ▼
  Splunk MCP Server  ──▶  Splunk Enterprise
  (or REST API fallback)
        │
        ▼
  Structured JSON Report
        │
        ├──▶  Slack (Block Kit)
        └──▶  Next.js Dashboard (real-time polling)
Claude doesn't execute a fixed script. It reads the incoming alert, decides which questions to answer, writes the SPL queries, and adjusts its investigation based on what the data actually shows — exactly like a human SRE would.
Tech Stack
| Layer | Technology |
|---|---|
| AI Model | Claude claude-sonnet-4-6 (Anthropic) |
| Agent Framework | Anthropic Tool Use API (agentic loop) |
| Splunk Integration | Splunk MCP Server (primary) / Splunk REST API (fallback) |
| Backend | Python 3.14, FastAPI, uvicorn |
| Frontend | Next.js 16, Tailwind CSS v4, shadcn/ui |
| Notifications | Slack Block Kit (incoming webhook) |
| Log Ingest | Splunk HEC (HTTP Event Collector) |
Splunk + MCP Integration
Splunk is the data source and the alerting engine — every investigation starts from a real Splunk saved-search webhook and every SPL query runs against live indexed data.
The MCP Server integration turns Splunk into a first-class AI tool surface:
- The agent calls
run_spl_searchwith a specific SPL query and time range — the MCP Server executes it against Splunk and returns structured results get_alert_contextfetches the triggering saved search definition so the agent understands what threshold was crossedget_index_summarygives the agent metadata about the index before it starts querying
A REST API fallback using splunklib provides identical functionality when the MCP Server isn't available, making the system production-ready regardless of deployment environment.
The 8-query budget forces the agent to investigate like a skilled SRE — targeted and decisive, not exhaustive.
Challenges
- Agentic budget management: Claude would sometimes exhaust all 8 tool calls before synthesizing a report. Solved with a hard limit that injects a "synthesize now" instruction when the budget is hit, guaranteeing a report even on complex incidents.
- Splunk timestamp parsing: Splunk returns UTC timestamps without timezone offsets, causing JavaScript to misinterpret them as local time. Fixed by normalizing all ISO strings before parsing.
- Port conflicts: Splunk Web occupies port 8000 by default, which is also the Next.js dev convention. The backend runs on 9000 to avoid the conflict — worth documenting for anyone running locally.
- Tool result fidelity: When Splunk indexes have sparse data, Claude would sometimes hallucinate affected hosts. Prompt engineering — specifically instructing it to only report hosts that appear in actual query results — eliminated this.
What's Next
- Persistent investigation store (Postgres) for long-term incident history and trend analysis
- Auto-create Splunk incidents and annotate dashboards when a root cause is confirmed
- Multi-alert correlation — link related investigations that fire within the same time window
- Confidence calibration using historical investigation outcomes as feedback
Demo Scenarios
Trigger "High 5xx Error Rate" — the agent finds a v2.4.1 deploy to web-03 and web-07 two minutes before the spike and recommends an immediate rollback.
Trigger "P99 Latency SLO Breach" — the agent correlates slow response times across all 8 hosts, rules out deploys, and pages the infra oncall for a connection pool investigation.
Trigger "Database Connection Pool Exhausted" — the agent traces cascading failures from orders_db back to a traffic spike on /api/checkout and recommends a circuit breaker.
Team
Built solo by @kyisaiah47 for the Splunk Agentic Ops Hackathon, Observability Track.

Log in or sign up for Devpost to join the conversation.