-
-
-

-

Logo

VIDEO WAS NOT WORKING IN UPLOAD LINK HERE:
SolarSentinel
Forecast the storm before it hits.
SolarSentinel is a space-weather intelligence platform that turns raw NOAA and NASA data into a civilian-friendly, location-aware solar storm and aurora warning system.
In May 2024, Earth experienced one of the strongest geomagnetic storms in decades. For many people, it was an amazing aurora event. For companies, utilities, satellite operators, GPS systems, and communications networks, it was a reminder that space weather can affect real infrastructure.
SolarSentinel is built around one question:
What if people could understand the storm before it reached them?
Inspiration
The inspiration came from the May 2024 solar storm.
Most people only heard about the event once the auroras were already happening or once official alerts were widely shared. But the signals that led to the storm existed earlier in the data: solar flares, coronal mass ejections, CME speed, CME direction, and prior geomagnetic activity.
We wanted to build a product that does not just show raw space-weather data. We wanted to make that data useful.
For civilians, that means answering:
Can I see the aurora tonight?
For companies and operational teams, that means answering:
Is there a strong enough solar-storm signal that we should start paying attention now?
SolarSentinel is our attempt to turn complex space-weather science into a warning layer that is visual, understandable, and actionable.
What it does
SolarSentinel combines live space-weather data, a storm-risk model, and a 3D Earth interface to explain solar-storm risk.
The app can:
- Show live solar and geomagnetic conditions
- Forecast storm severity over the next 24 to 72 hours
- Explain risk in plain language
- Show local aurora visibility based on location
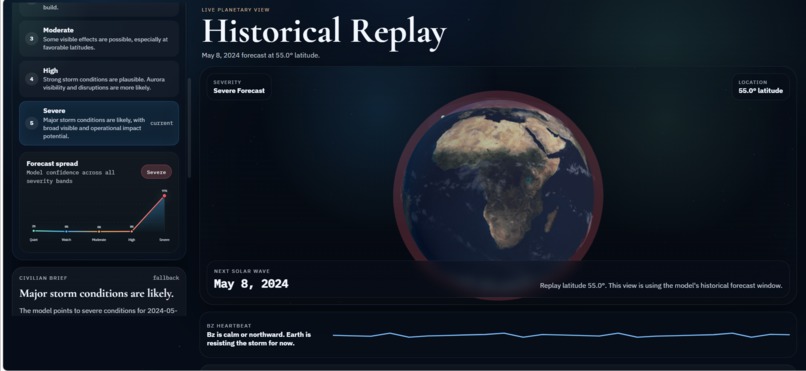
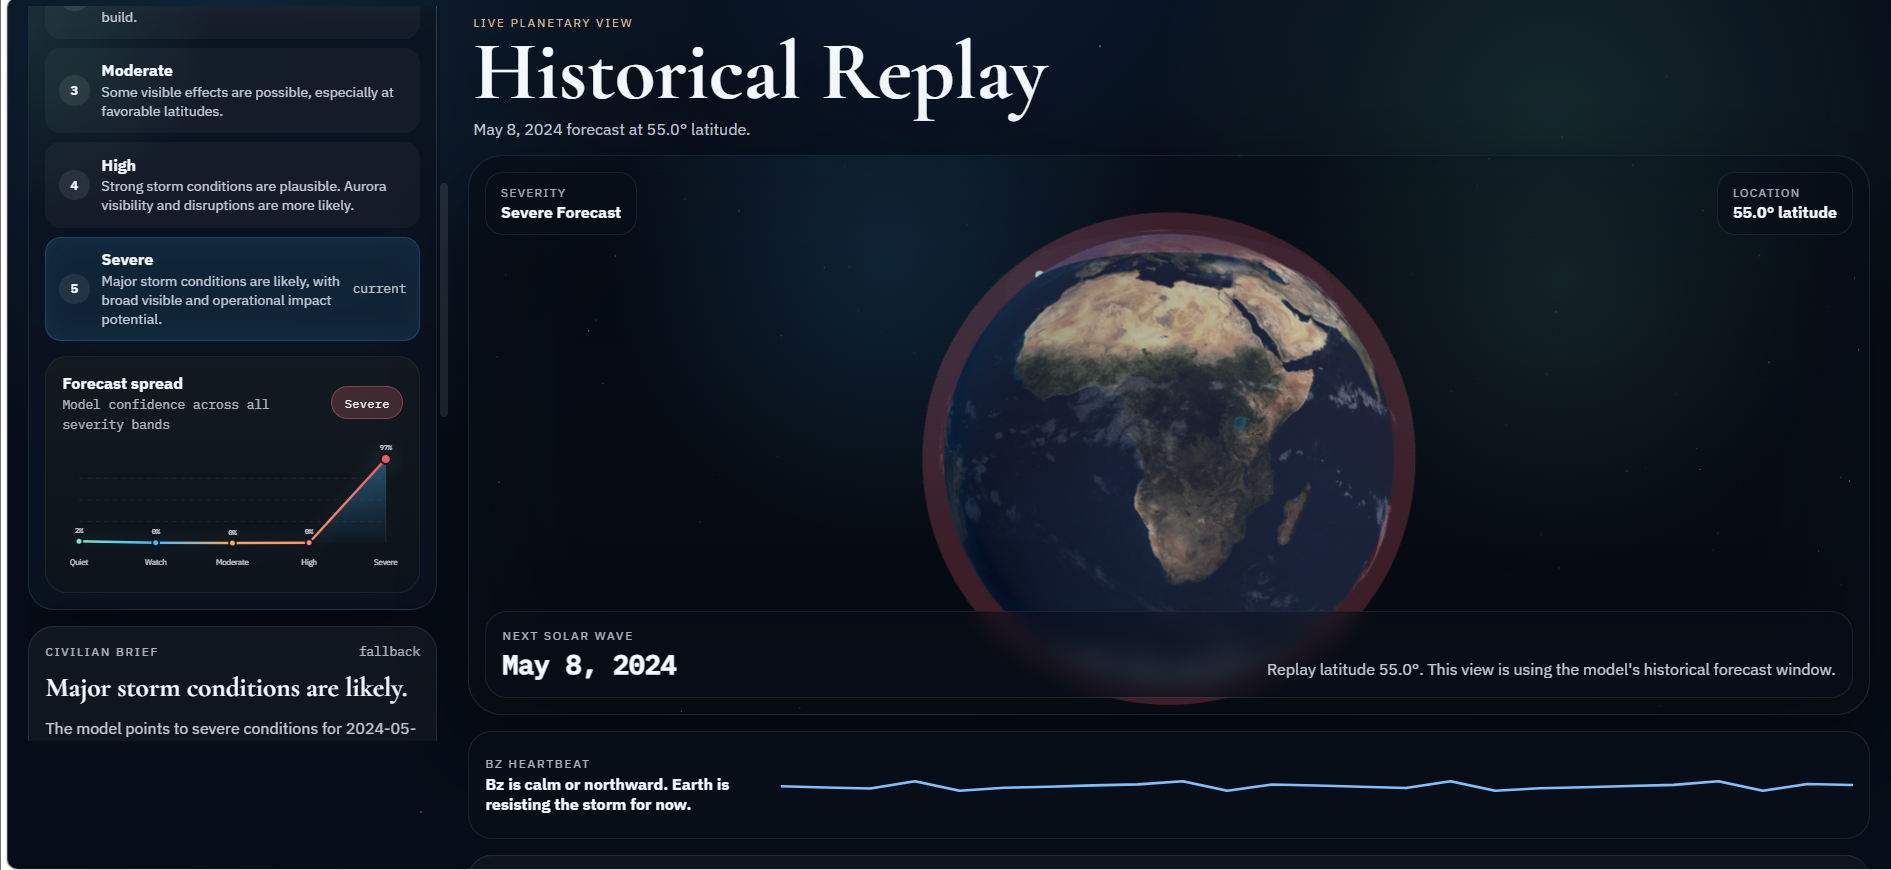
- Replay historical storm events like May 2024
- Display a 3D Earth with aurora overlays
- Provide a civilian view and a company / operational view
- Surface infrastructure posture for stronger storm signals
- Support SMS-style alert signup for future warnings
The goal is to make space weather feel less like a scientific dashboard and more like a real product people can use.
How it can be used
For civilians
SolarSentinel helps normal users understand whether a solar storm matters to them.
A civilian user can check:
- Whether an aurora may be visible near them
- How severe the storm signal is
- Whether tonight is worth watching
- What the forecast means in simple language
- Whether they should sign up for an alert
Instead of reading Kp values and technical NOAA alerts, users get a clear explanation of what is happening and what it means for their sky.
For companies and operational teams
SolarSentinel can also be used as an early risk-awareness tool.
Companies could use it to monitor:
- Satellite risk
- GPS disruption risk
- Communications risk
- Power-grid sensitivity
- Aviation and navigation concerns
- Regional infrastructure posture
The company mode does not try to replace official government alerts. Instead, it acts as an earlier intelligence layer that turns raw signals into a practical risk posture.
How we built it
SolarSentinel has three main layers: data, model, and interface.
1. Data layer
We built a FastAPI backend that connects to space-weather data sources.
The backend pulls and processes data such as:
- CME activity
- Solar flare history
- Geomagnetic storm data
- Kp index values
- Solar wind speed
- Bz and Bt magnetic field values
- NOAA alert text
- Aurora forecast data
The backend also includes endpoints for:
GET /api/status
GET /api/aurora
GET /api/visibility
GET /api/infrastructure
GET /api/civilian-brief
POST /model/predict
GET /model/predict/current
GET /model/replay
This gave us one structured API layer that the frontend could use instead of directly dealing with multiple raw feeds.
2. Model layer
The model predicts solar-storm severity using pre-impact features.
The important part is that SolarSentinel is not just reacting to what is happening right now. It tries to forecast risk before the full geomagnetic impact reaches Earth.
The model uses features like:
- Recent CME count
- Earth-directed CME count
- CME speed
- CME half-angle
- Predicted impact count
- Recent flare counts
- M-class flare count
- X-class flare count
- Prior day Kp
- Multi-day Kp average
- Latitude
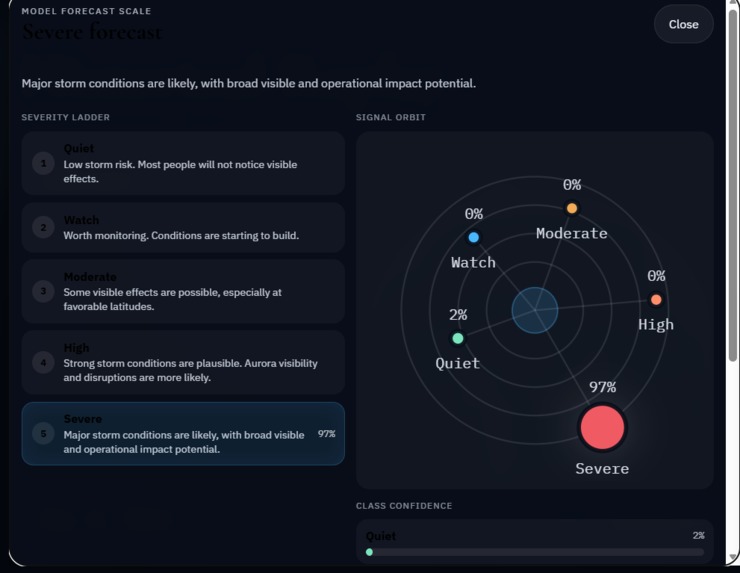
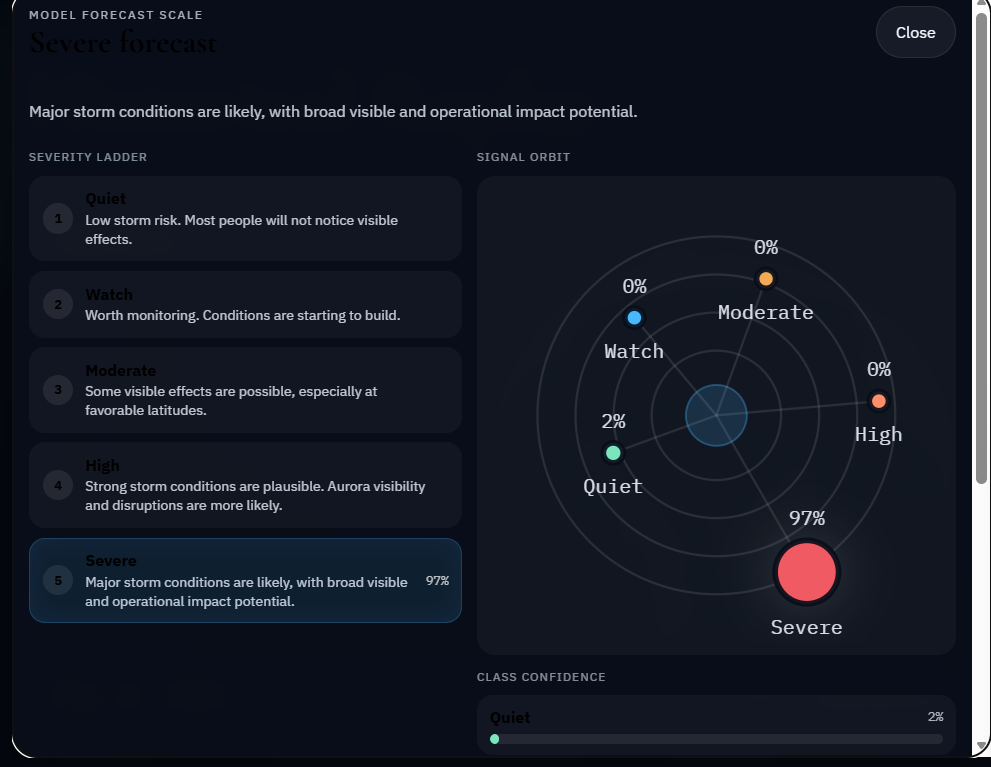
It outputs:
- Severity class:
quiet,watch,moderate,high, orsevere - Confidence score
- Prediction chart data
- Model visualization data
- Top-factor explanation
- Plain-language summary
This lets the app show both the prediction and the reasoning behind the prediction.
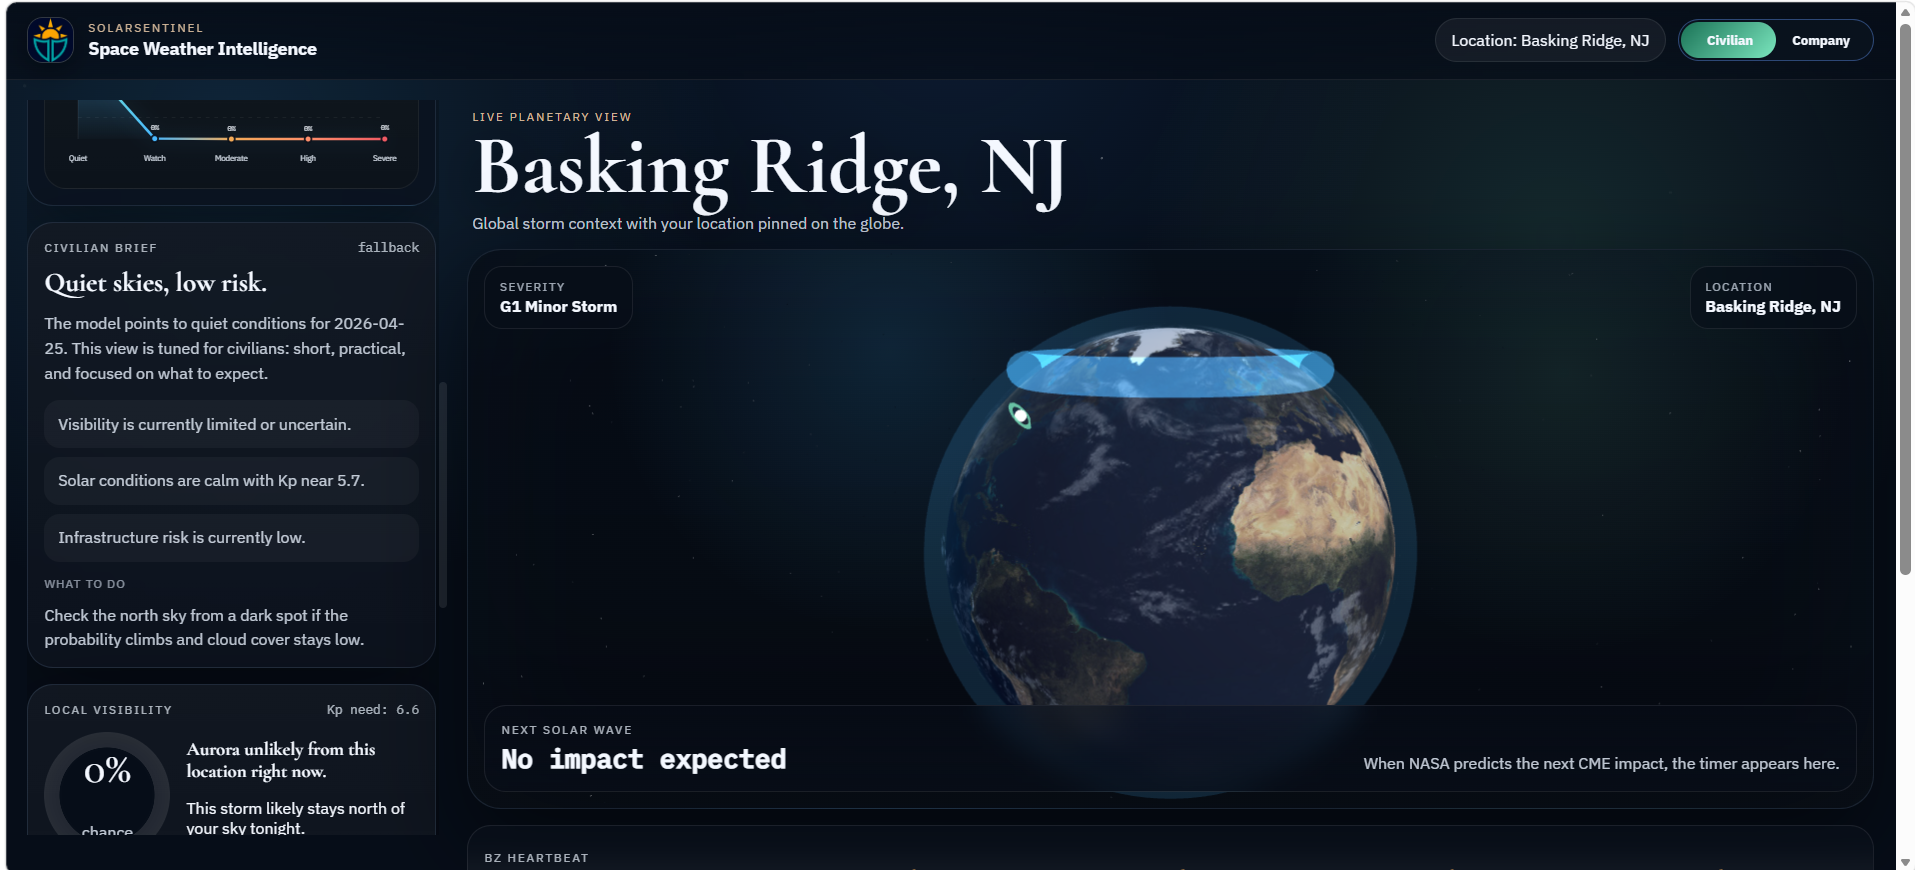
3. Frontend layer
The frontend is designed as a two-panel experience.
On one side, the user sees the intelligence layer:
- Storm status card
- Forecast graph
- Severity ladder
- Civilian explanation
- Local visibility card
- Historical replay controls
- Company mode
- SMS alert signup
On the other side, the user sees the visual layer:
- 3D WebGL Earth
- Aurora band overlay
- User location marker
- Cloud and Earth textures
- CME countdown
- Bz heartbeat strip
- Active alert strip
We wanted the app to feel exciting immediately, but still have real technical depth underneath.
Failures and obstacles
Failure 1: It started too much like a raw dashboard
Our first version was too focused on displaying data. It had numbers, feeds, and charts, but it did not clearly answer the user’s real question.
A normal user does not want to decode Kp, Bz, CME geometry, and alert text.
They want to know:
Does this matter to me?
So we redesigned the experience around user intent. The app became more focused on plain-language summaries, local visibility, severity classes, and clear next steps.
Failure 2: The model story was hard to explain
The model had many technical inputs, but that alone was not enough. We needed to explain why the model was different from a normal nowcast.
The breakthrough was framing SolarSentinel as a pre-impact forecast layer.
Instead of saying, “Here is the current Kp,” we say:
Here are the upstream signals that suggest a storm may be coming.
That made the project easier to explain and more impressive technically.
Failure 3: Historical replay was harder than live data
Live mode was important, but the best demo needed a real storm. That meant building replay support for May 2024.
Replay mode was difficult because historical data has to feel like the app is operating at that moment in time. We had to connect the model output, the UI state, the severity display, and the explanation so the demo made sense.
Failure 4: Balancing excitement with honesty
The May 2024 replay is powerful because SolarSentinel flags severe on May 8, before NOAA’s May 9 public G4 watch and before the storm reached Earth on May 10.
But we did not want to overclaim. One strong replay does not mean the model is fully operationally validated across every storm.
So we present it as a promising replay result and a strong proof of concept, while being clear that more benchmarking is needed.
The model
The core technical idea is that solar storms often have warning signals before the effects are fully felt on Earth.
SolarSentinel uses those early signals to classify storm risk.
Inputs
The model uses a mix of solar activity, CME geometry, recent flare activity, and prior geomagnetic momentum.
Key inputs include:
recent_cme_count
earth_directed_cme_count
cme_speed
cme_half_angle
predicted_impact_count
recent_flare_count
m_class_flare_count
x_class_flare_count
prior_day_kp
recent_kp_average
latitude
Outputs
The model returns:
severity_class
confidence
prediction_summary
top_factors
chart_payload
orbit_visualization_payload
The output is designed for both machine use and human explanation.
The frontend uses the model output to generate:
- Severity cards
- Forecast graphs
- Confidence visuals
- Top-factor explanations
- Plain-language risk summaries
- Historical replay states
Why this matters
Many dashboards are nowcasts. They show what is happening at the current moment.
SolarSentinel is designed as a forecast product. It tries to detect risk earlier by looking at upstream storm signals, especially CME and flare features.
That is what makes the May 2024 replay so compelling. In the current replay pipeline, SolarSentinel surfaces a severe signal on May 8, while NOAA’s public G4 watch came May 9 and the storm reached Earth May 10.
That means the app can be positioned as an early warning layer, not just a visualization tool.
What we are proud of
We are proud that SolarSentinel combines many pieces into one working product:
- Real NASA and NOAA data integration
- FastAPI backend
- Forecasting model
- 3D WebGL Earth interface
- Aurora visualization
- Local visibility logic
- Historical replay mode
- Civilian and company views
- Explainable model output
- SMS alert signup flow
- 98.7% accuracy
The project is not just technically interesting. It is understandable to a normal user.
That was the main goal.
What we learned
We learned that the hardest part of building a science-based AI product is not only the model.
The hard part is turning scientific signals into trust.
That means:
- Explaining the prediction
- Showing confidence
- Designing for nontechnical users
- Handling uncertainty honestly
- Making the product useful in real situations
- Connecting technical data to human decisions
SolarSentinel helped us understand how AI, data engineering, visualization, and product design can work together to make science actionable.
What’s next
Next, we would improve SolarSentinel by:
- Testing the model across more historical storms
- Comparing warning time against NOAA alert timing
- Adding more validation metrics
- Supporting saved locations
- Adding custom alert thresholds
- Improving mobile alerts
- Adding richer infrastructure risk categories
- Creating a full replay timeline
- Improving model explainability over time
Long term, SolarSentinel could become a practical solar-storm awareness tool for civilians, aurora watchers, schools, utilities, satellite companies, aviation teams, and emergency planning groups.
Built With
- fast-api
- html5
- nasa
- noaa-climate-data-online
- python
- sklearn
- xgboost

Log in or sign up for Devpost to join the conversation.