-
map
-
analysis
-
analysis map
-

home1
-
home2


Solarize: Intelligent Solar Site Optimization Platform
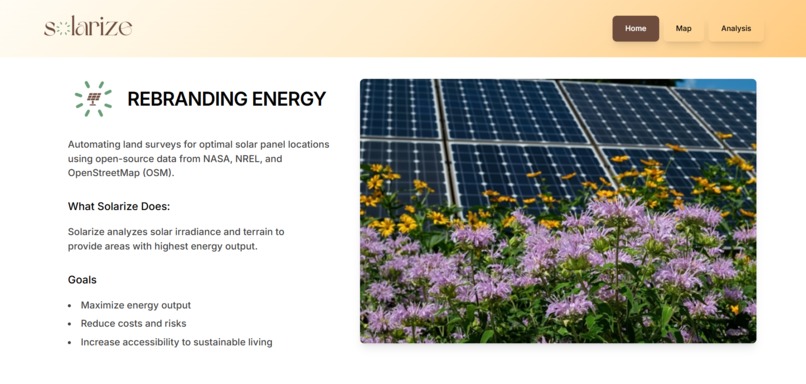
Overview
Solarize is a web app that helps users find the best places to install solar panels based on sunlight exposure, terrain, and land cost.
By combining accurate solar irradiance modeling with open mapping data and economic information, it identifies the most cost-effective spots for renewable energy projects - automatically filtering out residential and restricted areas.
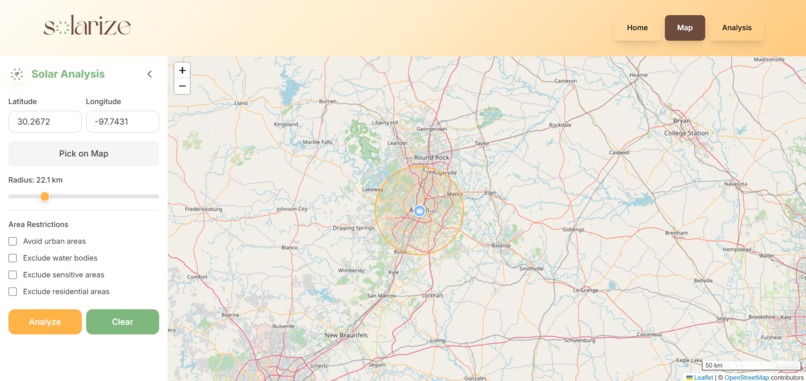
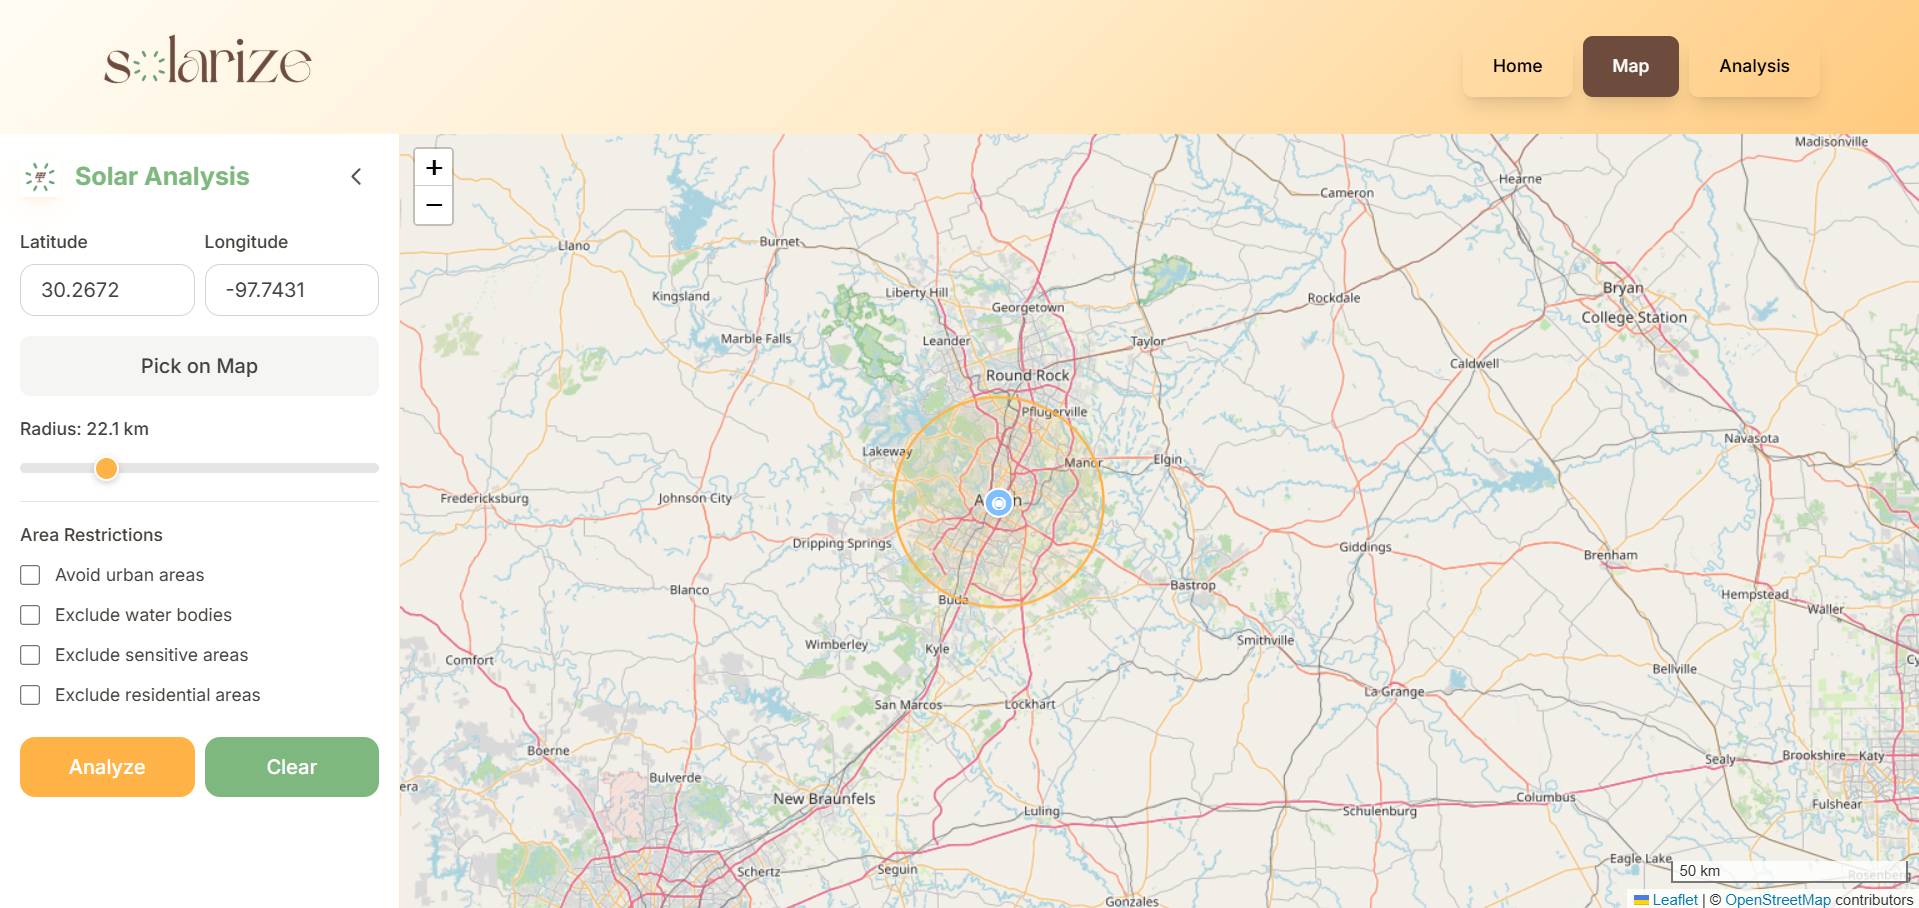
How It Works
Users provide:
- Latitude
- Longitude
- Search radius (km)
Solarize samples evenly distributed points within that circular area and evaluates each one for solar potential and land cost.
Every point receives a power-per-cost score that balances energy yield with affordability:
$$ S = \frac{E_{POA}}{P_{land}} $$
Where:
- E_POA is the plane-of-array irradiance (kWh/m²/day)
- P_land is the estimated land price (USD/m²)
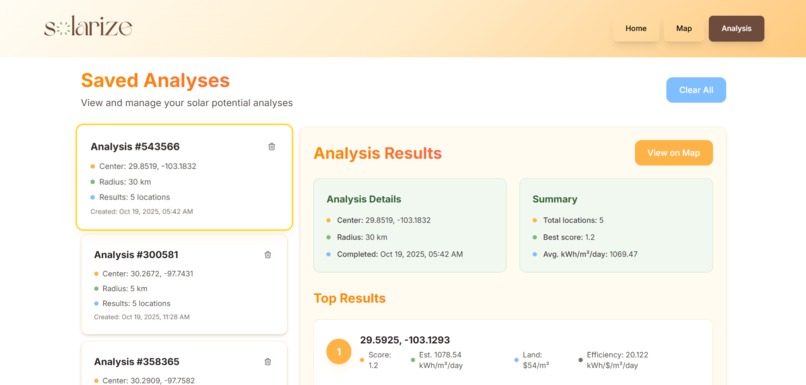
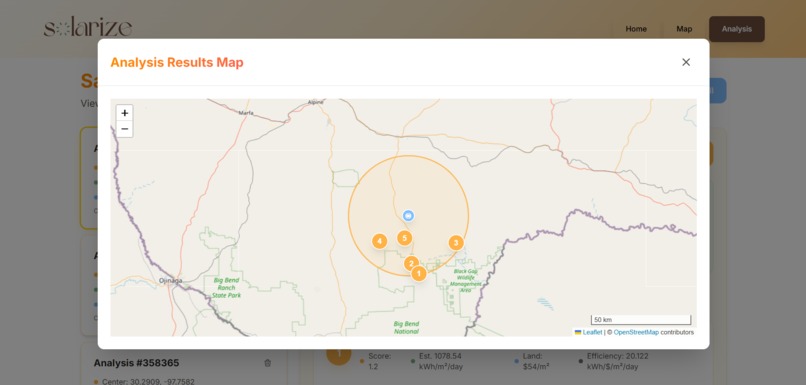
The top five highest-scoring points are displayed on an interactive OpenStreetMap view.
Mathematical Framework
Plane of Array Irradiance
The total sunlight received by a tilted solar panel is calculated using the plane-of-array (POA) model:
$$ E_{POA} = DNI \cdot \cos(\theta_i) + DHI \cdot \frac{1 + \cos(\beta)}{2} + \rho_g \cdot GHI \cdot \frac{1 - \cos(\beta)}{2} $$
Where:
- DNI – Direct Normal Irradiance
- DHI – Diffuse Horizontal Irradiance
- GHI – Global Horizontal Irradiance
- θᵢ – Angle of incidence
- β – Panel tilt
- ρg – Ground albedo (reflectivity)
The angle of incidence is defined as:
$$ \cos(\theta_i) = \cos(\theta_z)\cos(\beta) + \sin(\theta_z)\sin(\beta)\cos(\psi_s - \gamma) $$
where:
- θz – Solar zenith
- ψs – Solar azimuth
- γ – Panel azimuth (orientation)
Solar Declination (Cooper’s Equation)
To track the sun’s seasonal movement, Solarize uses Cooper’s formula for solar declination:
$$ \delta = 23.45^\circ \cdot \sin\left(\frac{360^\circ}{365}(284 + n)\right) $$
where n is the day of the year.
This angle is used to calculate the solar zenith and hour angle for any given location and time.
Power-Per-Cost Scoring
Each evaluated point includes both its solar potential and its estimated land cost.
Solarize ranks these points by efficiency:
$$ S = \frac{E_{POA}}{\max(P_{land}, \epsilon)} $$
The higher the score, the more power you get per dollar of land cost.
Vector Polygon Ray-Tracing
To avoid residential zones, Solarize uses polygon data from OpenStreetMap and applies a ray-casting algorithm to test whether each sampled point lies inside restricted land.
Point-in-Polygon Method
- For each test point, a horizontal ray is cast to the right.
- For every polygon edge between \((x_i, y_i)\) and \((x_{i+1}, y_{i+1})\), Solarize checks whether the ray crosses it.
- A crossing occurs when
$$ (y_i > y) \neq (y_{i+1} > y) $$ and $$ x < x_i + \frac{(y - y_i)(x_{i+1} - x_i)}{(y_{i+1} - y_i)}. $$ - If the number of crossings is odd, the point is inside the polygon; if even, it’s outside.
A small 25–50 m buffer is added around residential polygons to ensure no sites overlap restricted areas.
Sampling
Solarize generates a reproducible, evenly distributed set of points within the search radius using a seeded hexagonal or blue-noise pattern:
$$ n_{points} = \left(\frac{r_{km}}{100}\right) + 64 $$
Points falling inside excluded polygons are skipped before irradiance is calculated.
Technical Architecture
| Layer | Technology | Purpose |
|---|---|---|
| Frontend | React + Tailwind + OpenStreetMap | User interface and visualization |
| Backend | Node.js / Python Flask | Irradiance and cost computation |
| Mapping | OpenStreetMap / Overpass API | Terrain and zoning polygons |
| Computation | NREL clear-sky models + Cooper’s equation | Accurate irradiance calculations |
| Data Storage | IndexedDB / SQLite | Local caching and analysis |
| Visualization | Leaflet + D3.js | Dynamic overlays and result mapping |
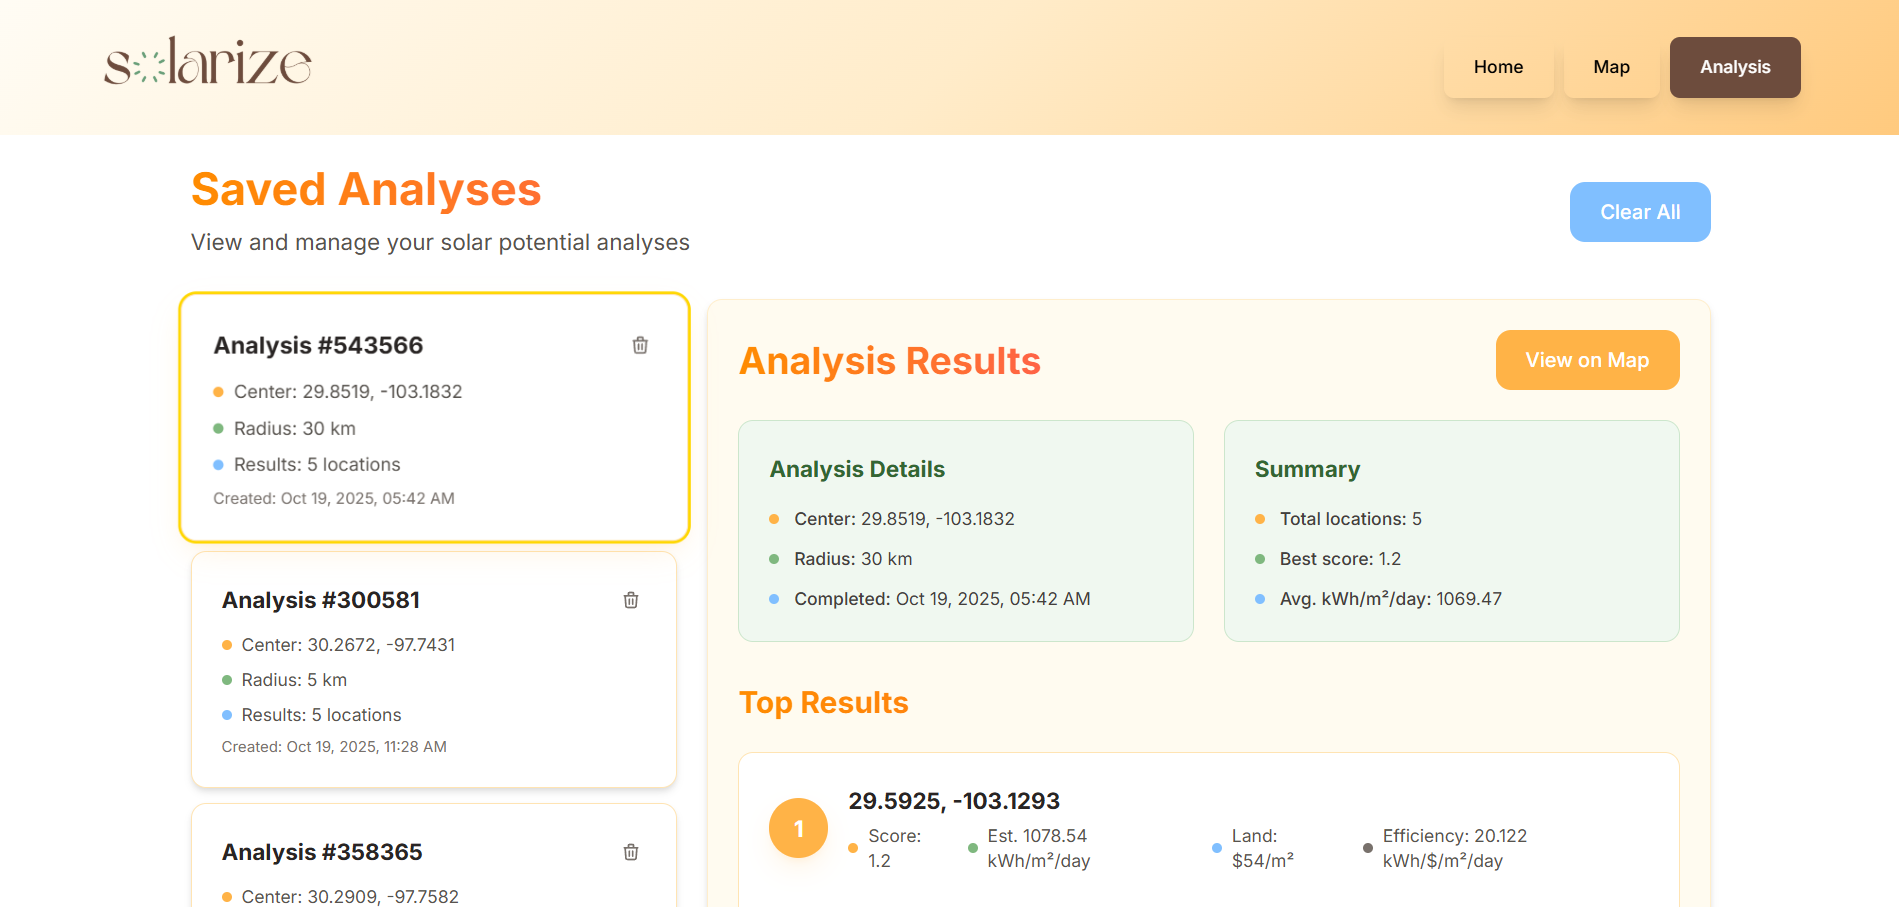
Results
- Evenly spaced sample points are generated within the chosen radius.
- Residential and restricted zones are filtered out using OSM vector data.
- For each valid location, Solarize calculates the plane-of-array irradiance based on tilt and solar geometry.
- Land cost is estimated for each coordinate.
- All points are scored by power-per-cost, and the top five optimal sites are highlighted on the map.
Impact
By combining physics-based modeling, geospatial data, and real-world cost information, Solarize makes renewable site planning both smarter and more accessible.
It helps individuals, communities, and developers quickly identify locations that maximize energy generation while minimizing land expenses - turning complex solar feasibility analysis into a few simple clicks.
Built for HackTX25. Developed with a focus on clean energy, computational precision, and open geospatial data.
Built With
- css
- figma
- leaflet.js
- node.js
- openstreetmap
- tailwind
- typescript
- vercel
- zustand


Log in or sign up for Devpost to join the conversation.