-
-
-
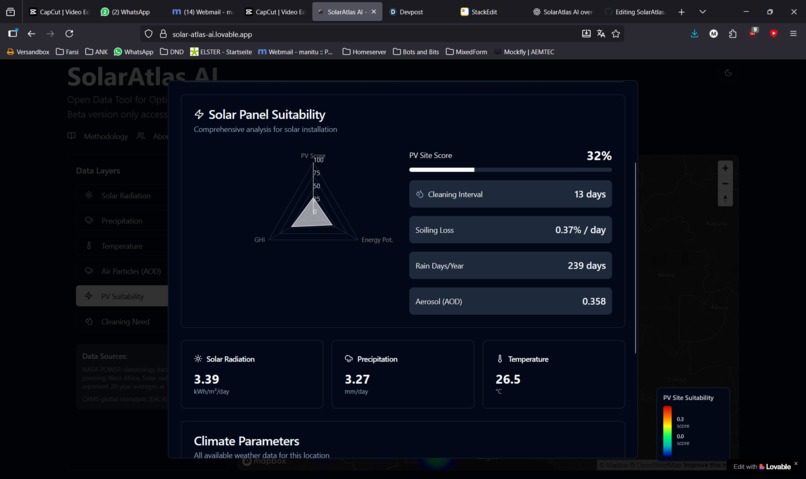
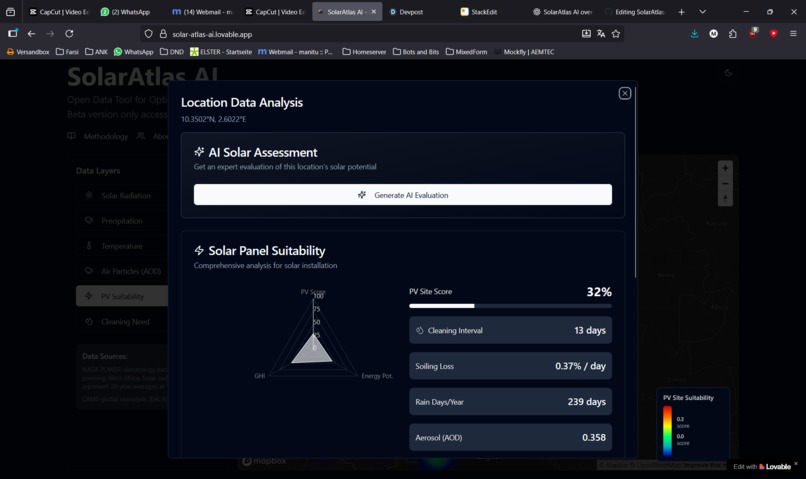
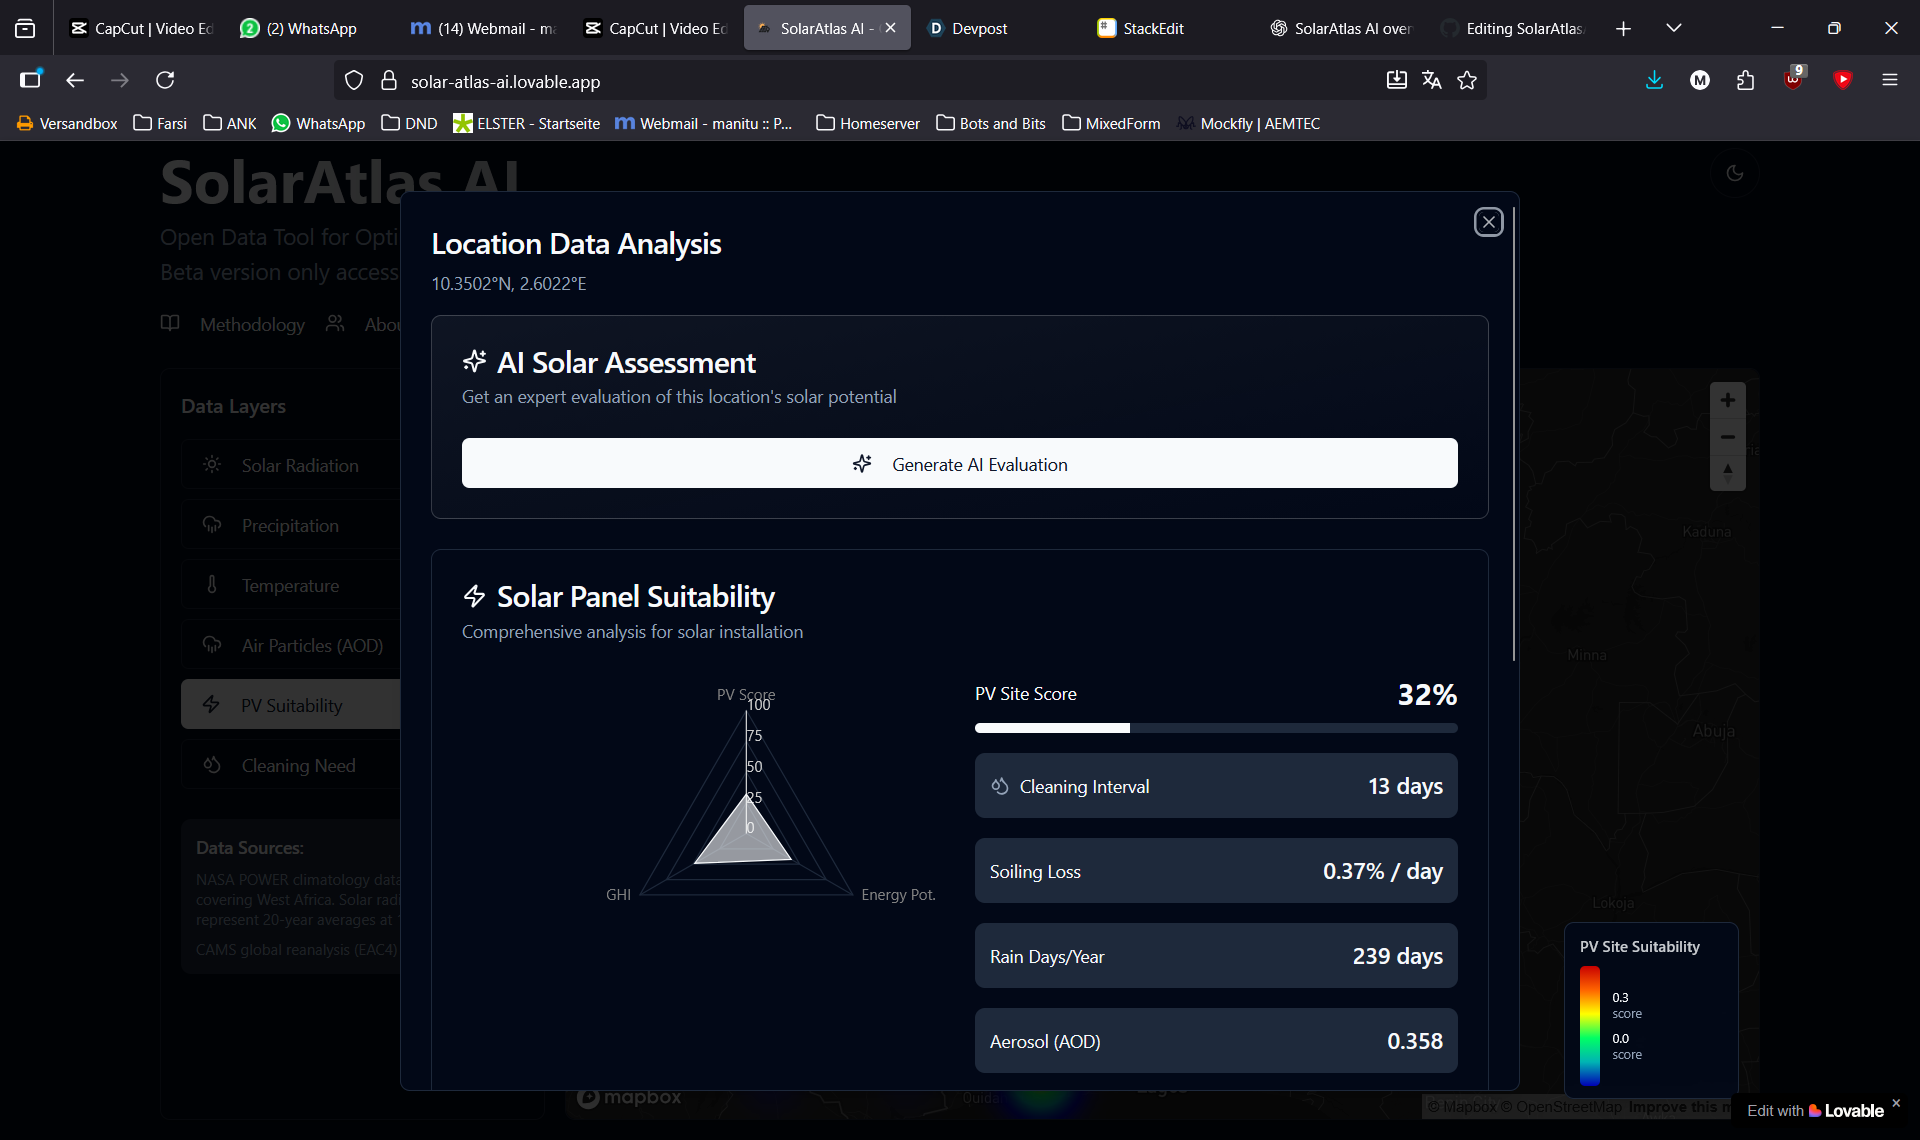
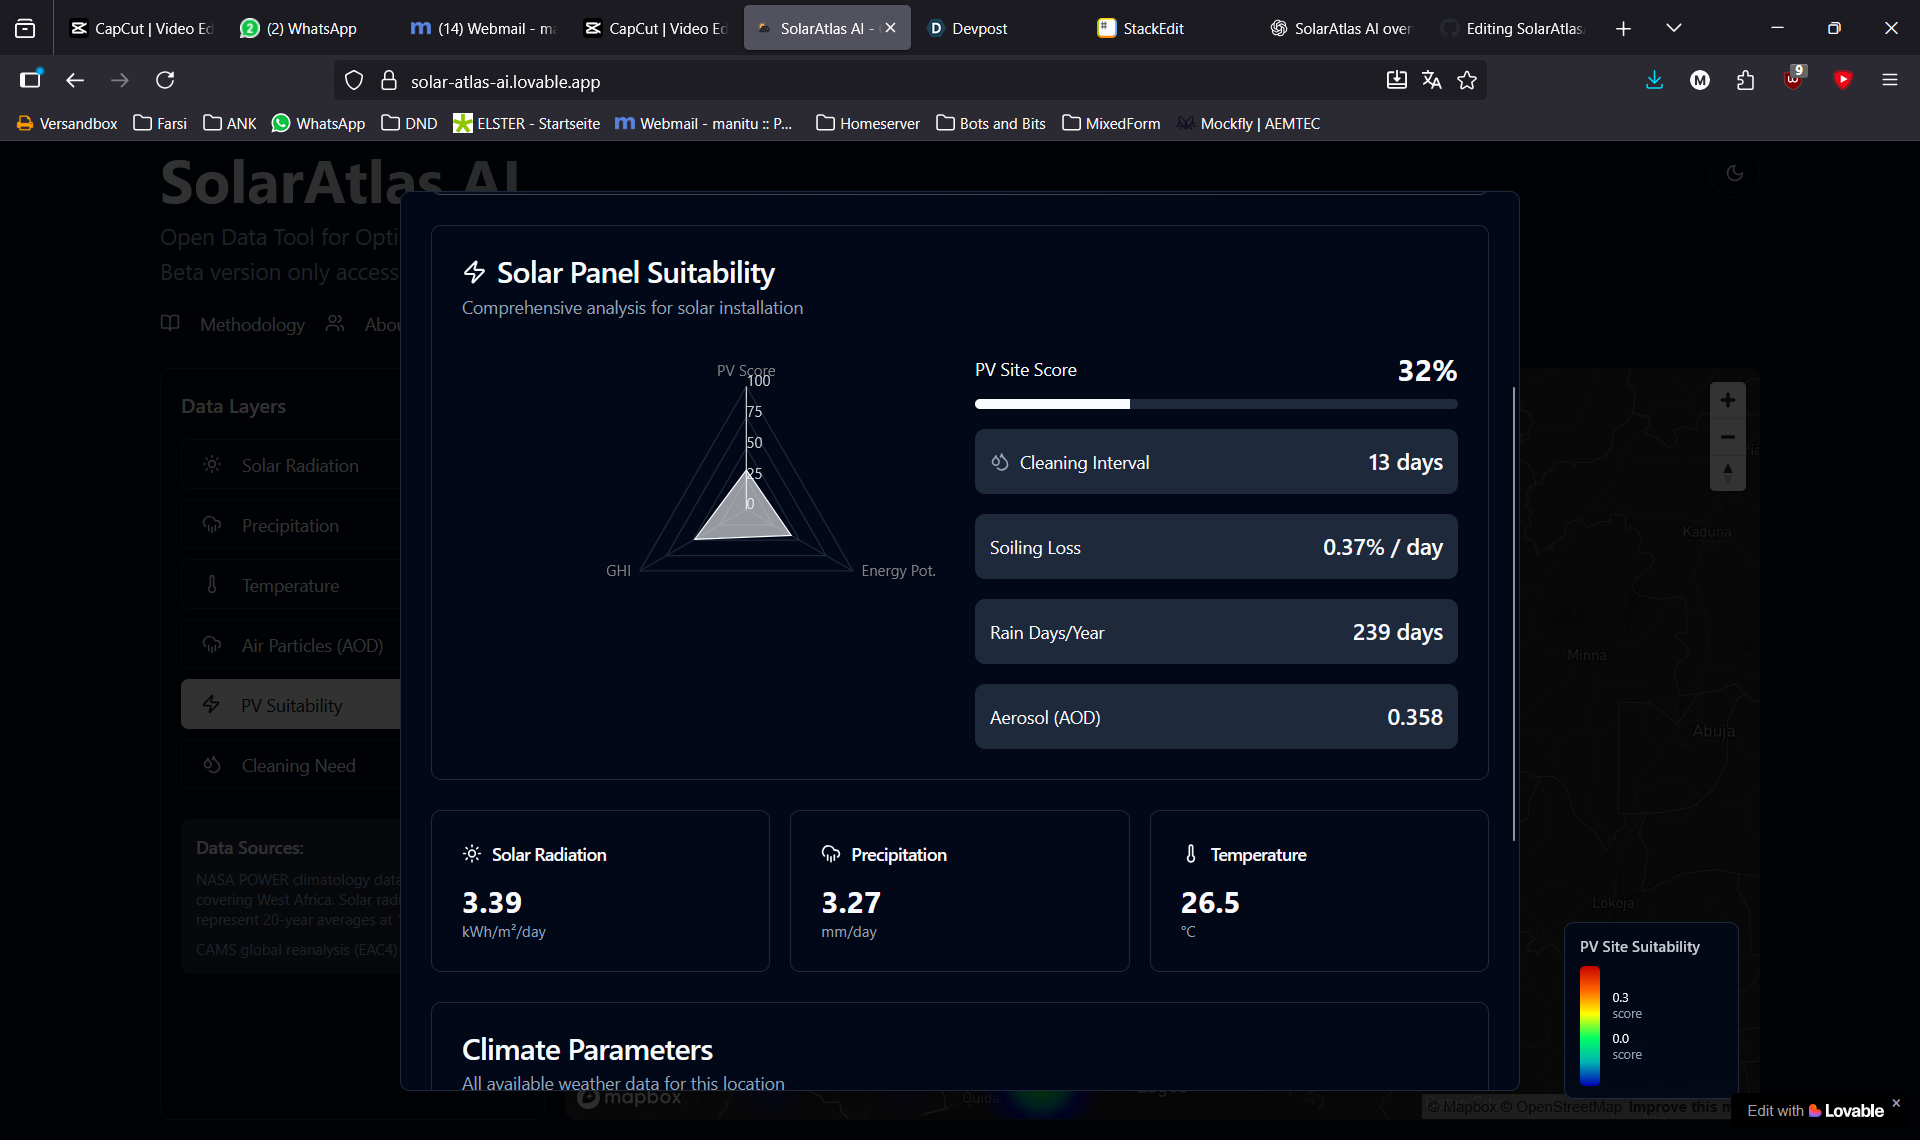
Data summaries
-
-
-
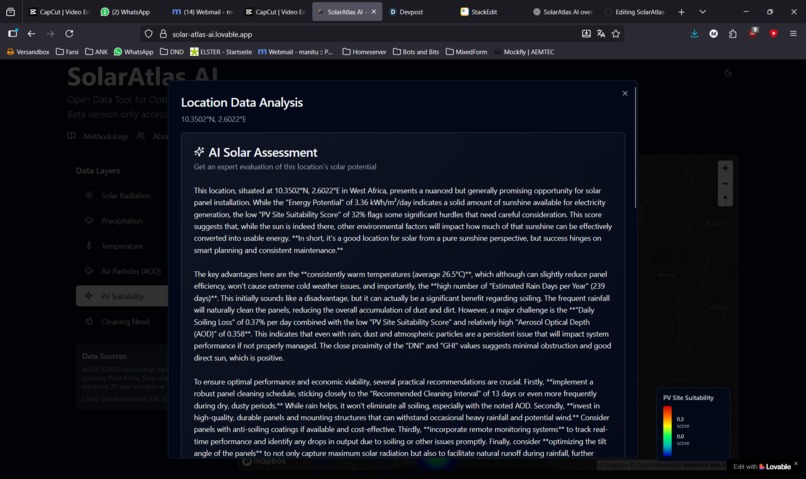
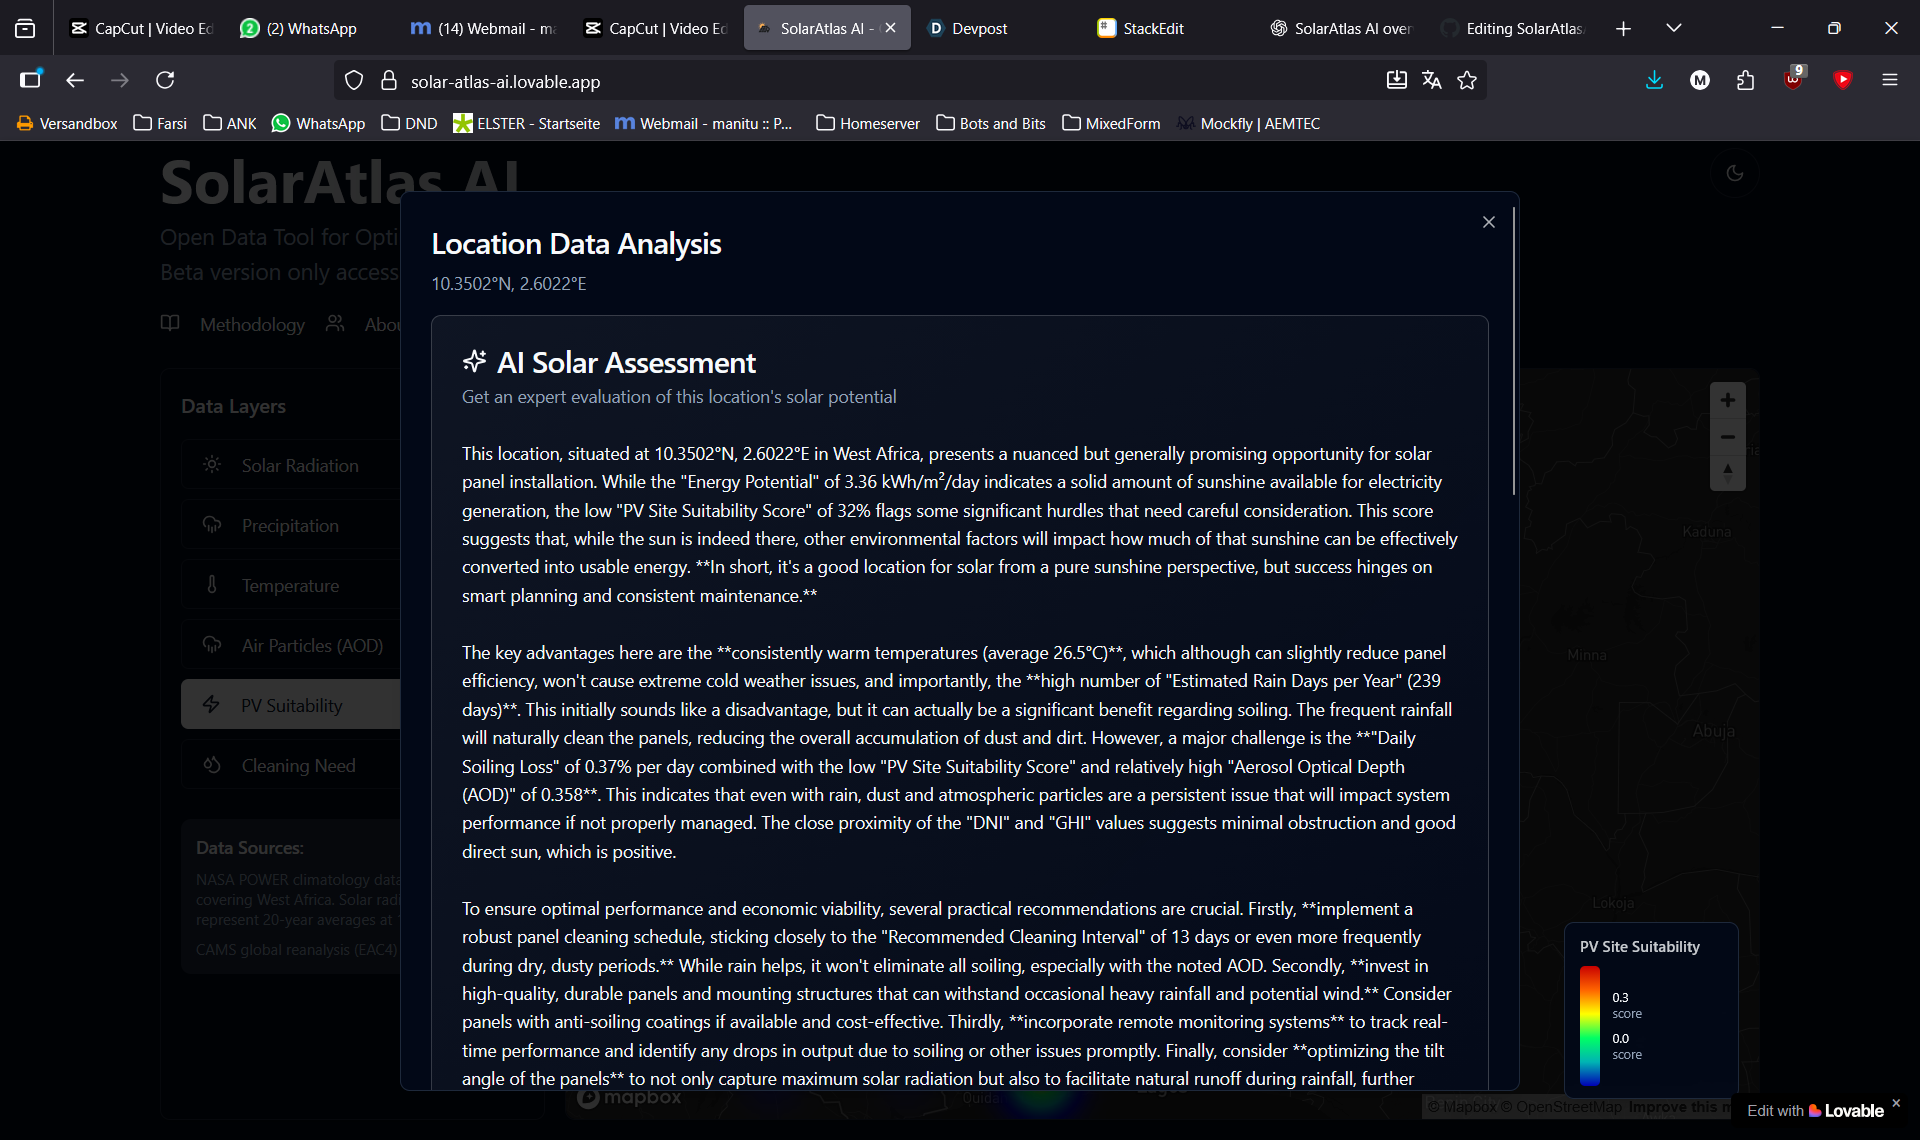
LLM Expert Summaries
-
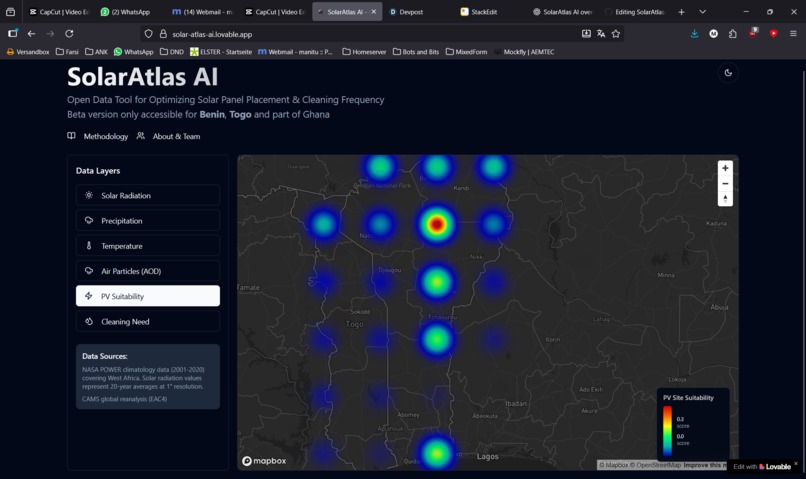
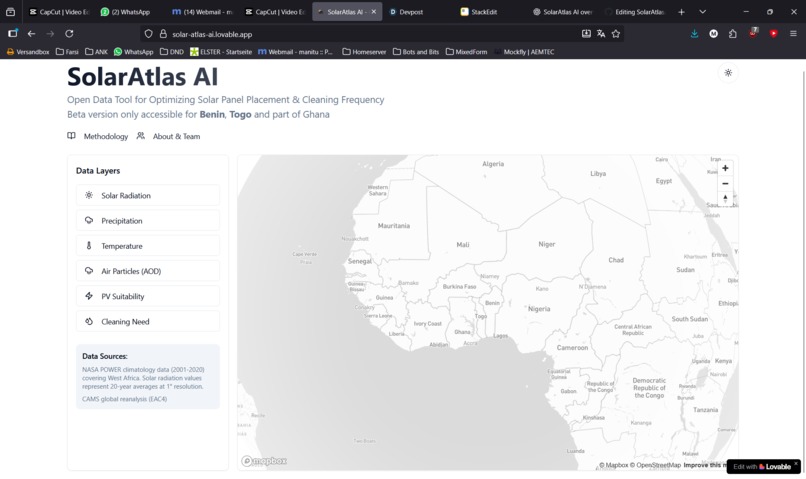
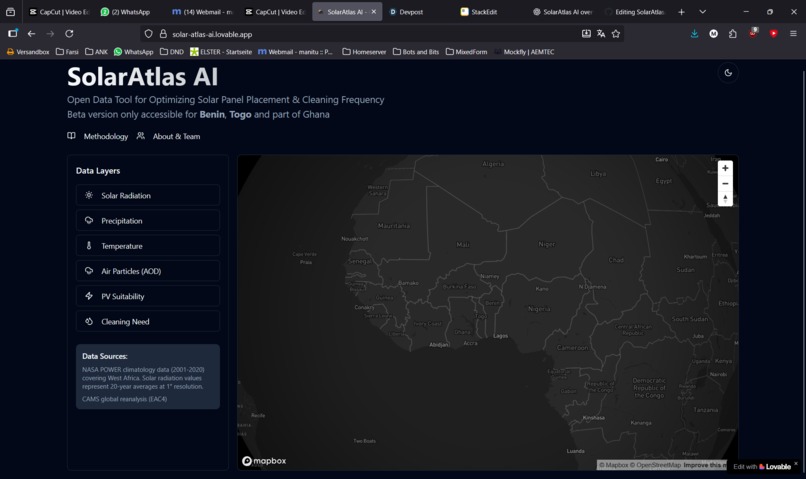
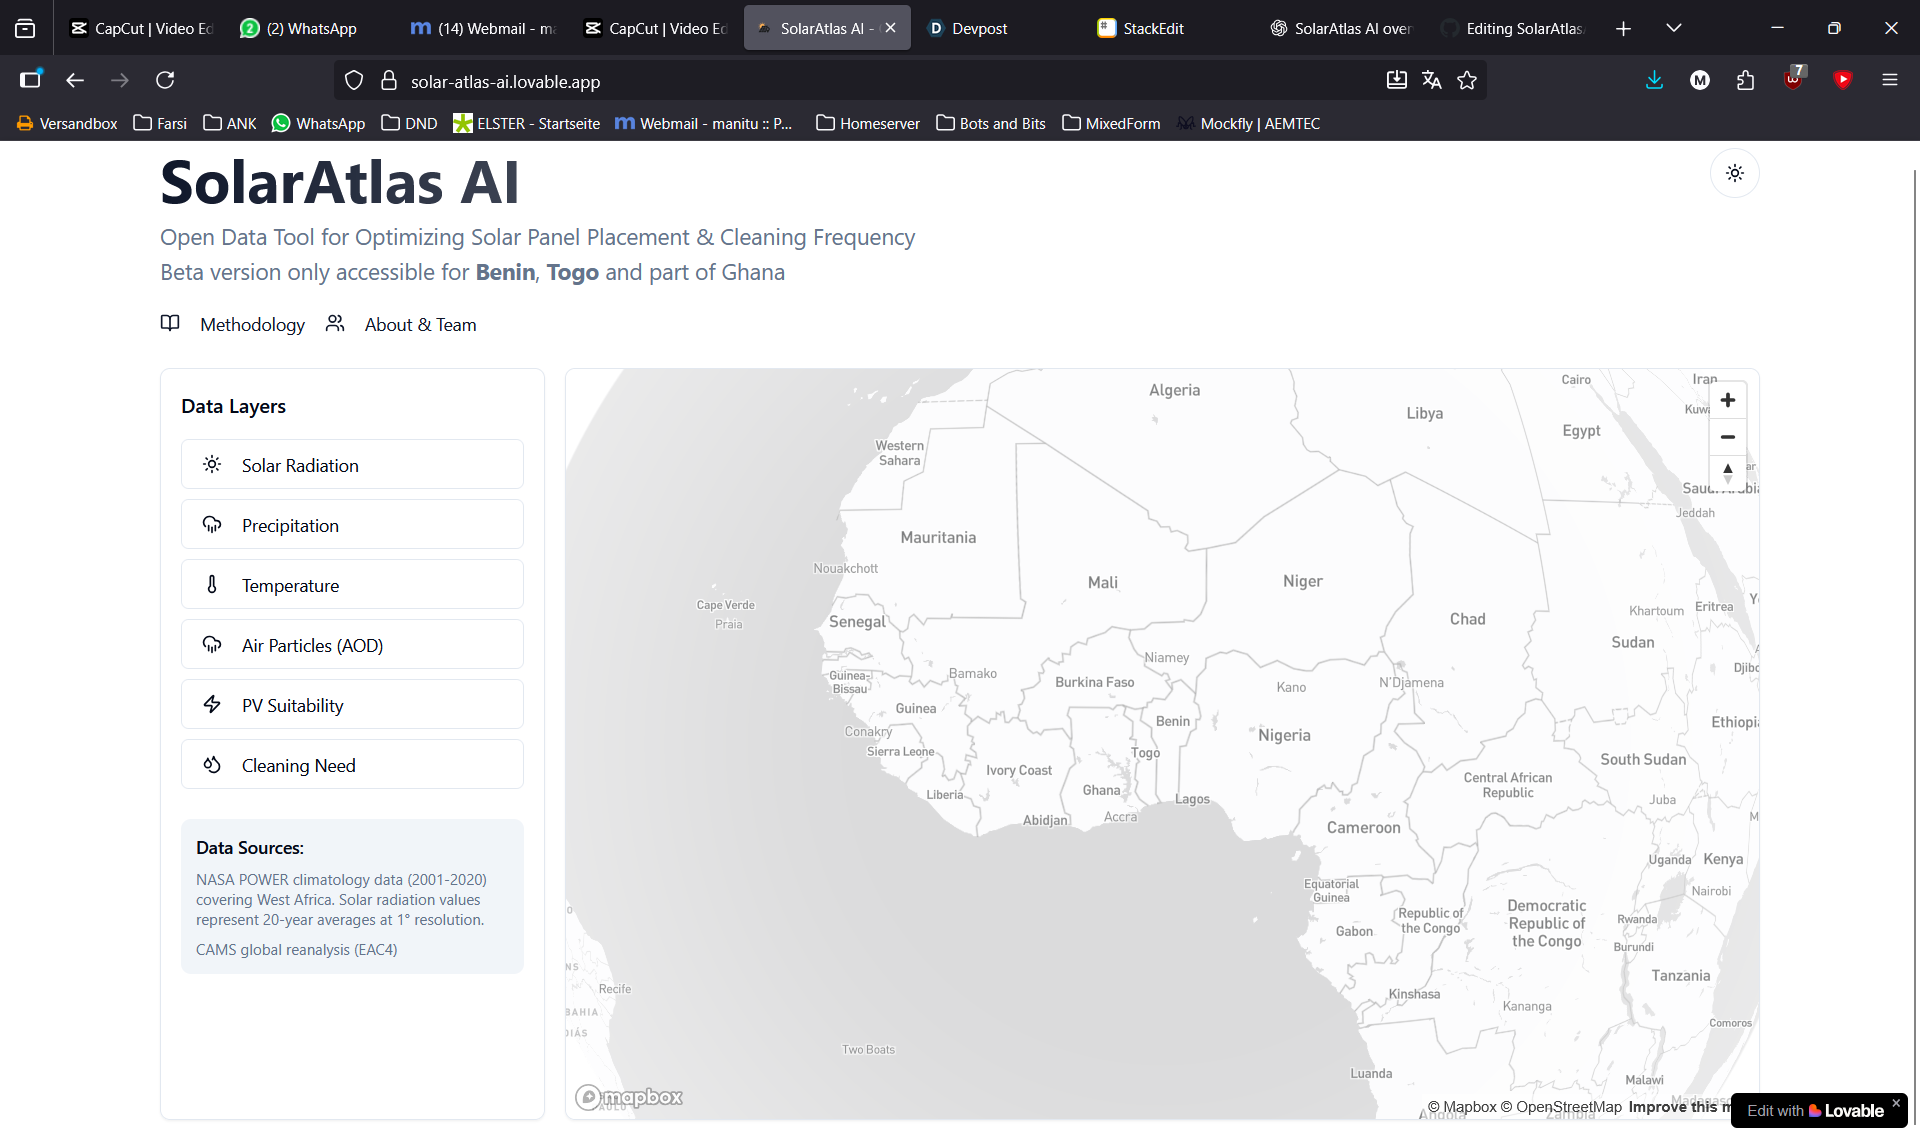
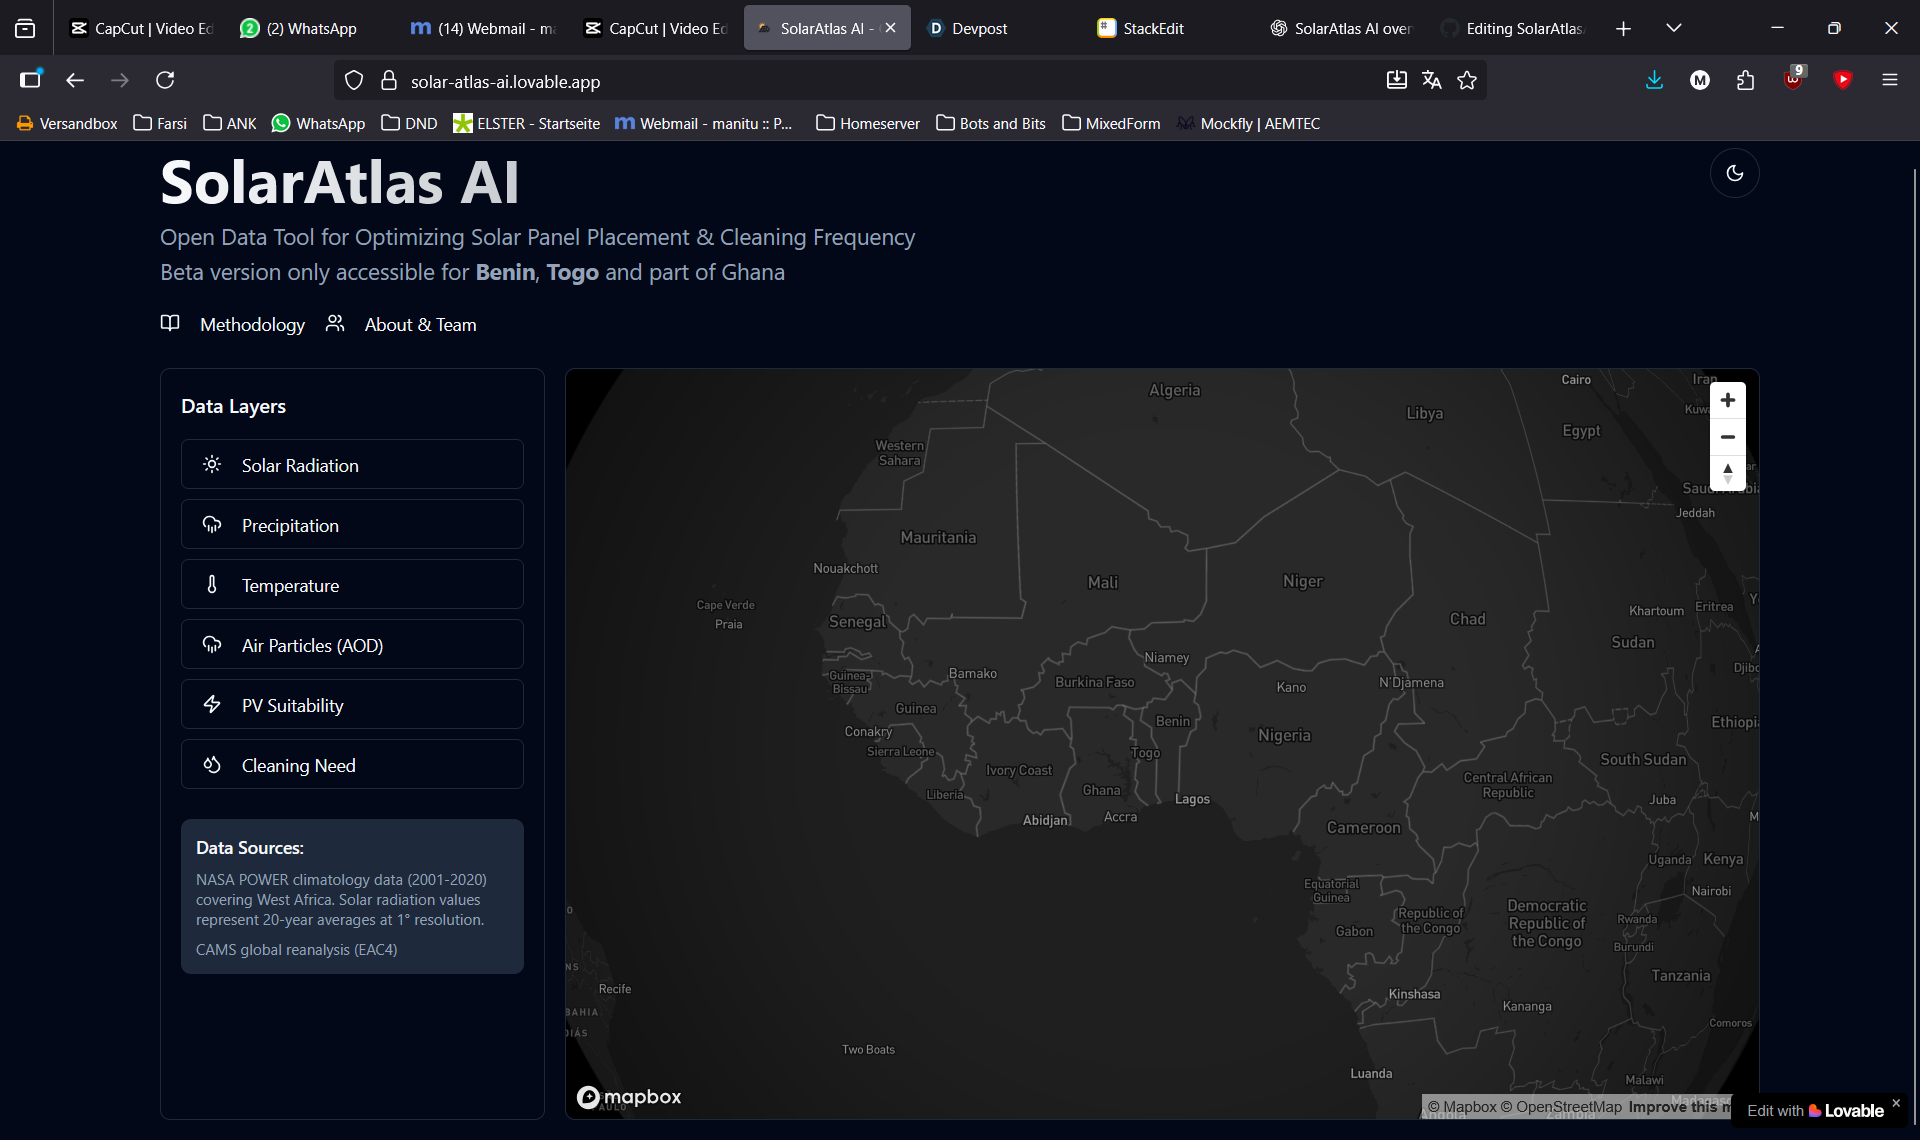
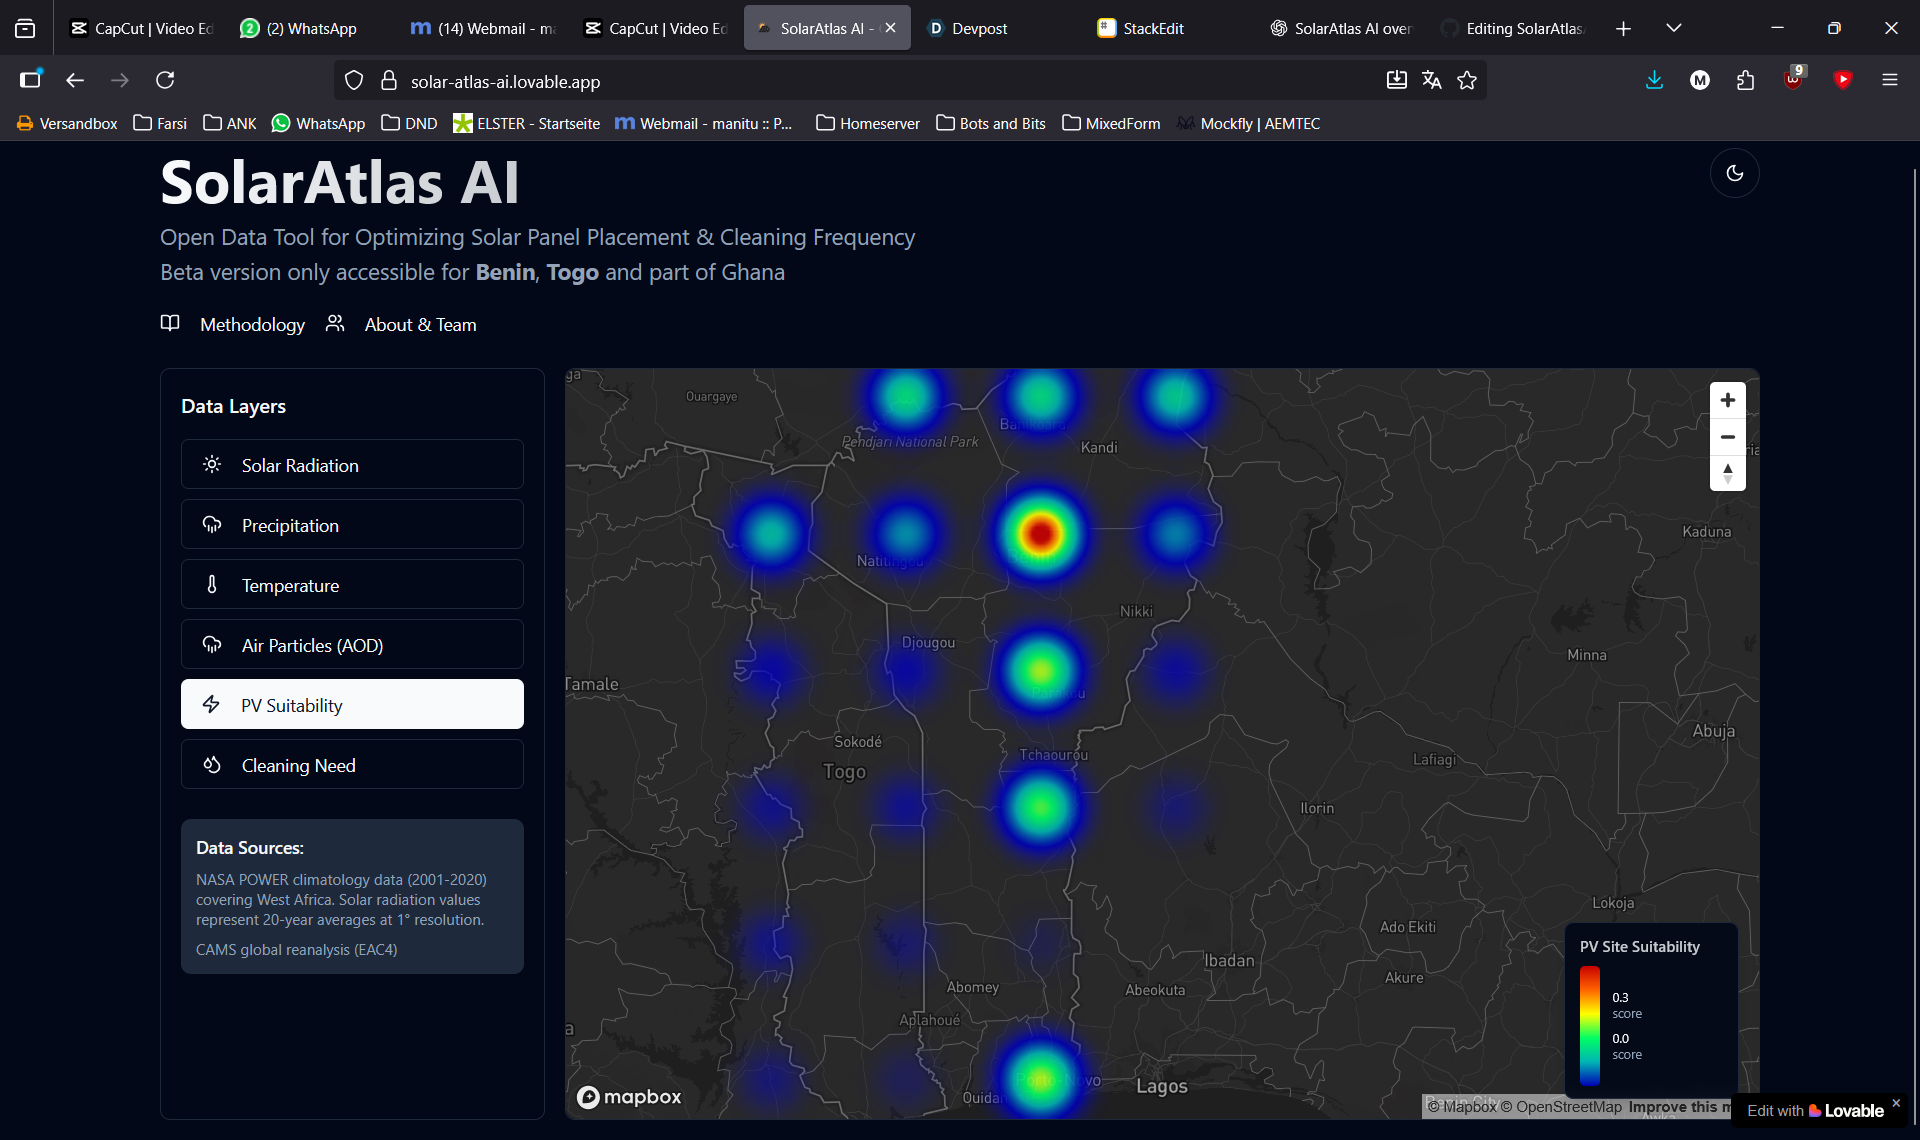
Selectable datalayers
-
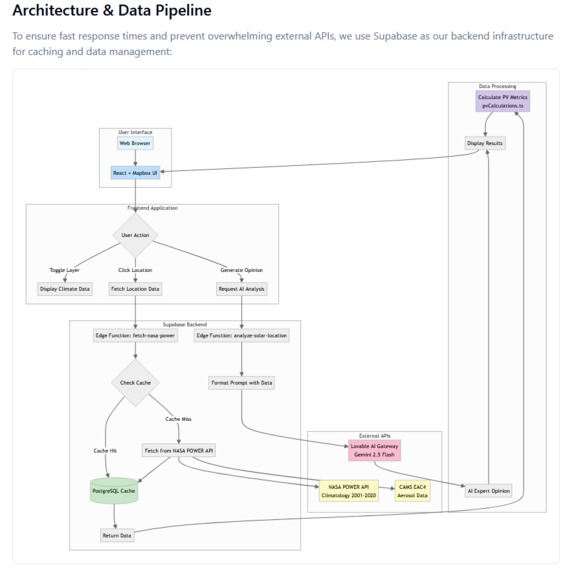
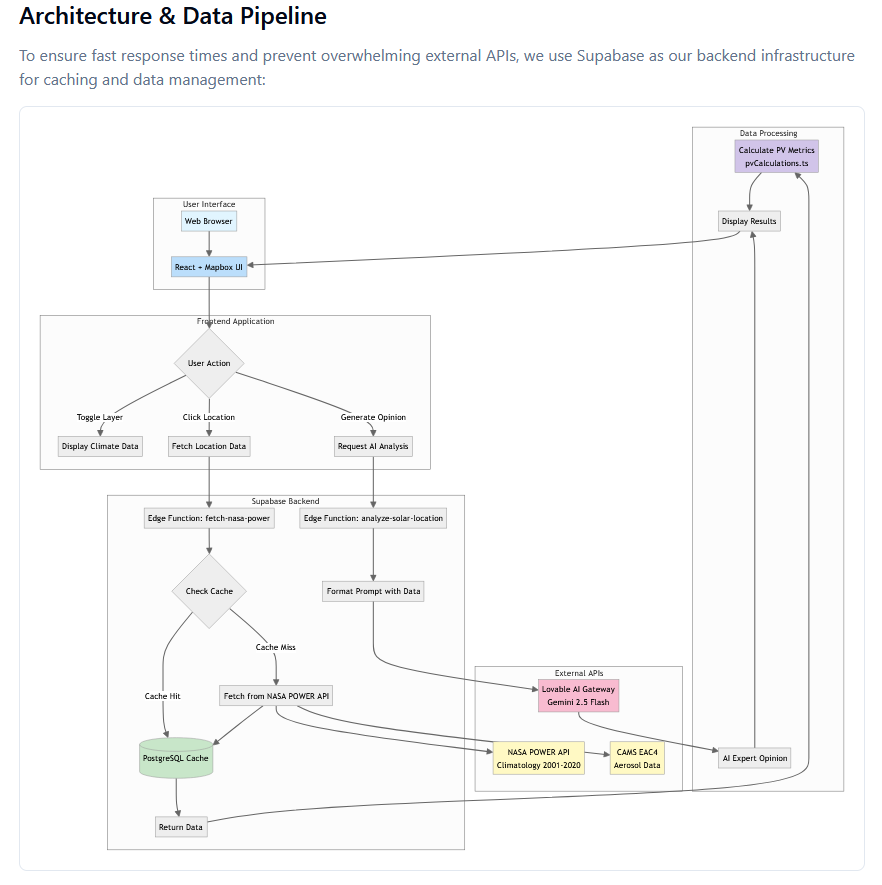
Archictecture Diagram
SolarAtlas AI
Open Data Tool for Optimizing Solar Panel Placement & Cleaning Frequency
Live Demo: https://solar-atlas-ai.lovable.app/
Documentation: https://solar-atlas-ai.lovable.app/methodology
Inspiration
Soiling — the buildup of dust and particles on solar panels — reduces efficiency and increases maintenance costs, especially in arid regions. In Sub-Saharan Africa, where millions still lack access to electricity, small-scale solar grids could make a major difference.
However, feasibility studies are often expensive and inaccessible to local communities. SolarAtlas AI was built to change that — a transparent, open-data platform that empowers local governments, NGOs, and researchers to identify high-potential solar sites and plan maintenance efficiently.
What It Does
SolarAtlas AI is an interactive map-based web application that visualizes solar potential and maintenance needs using open climate data and AI-driven insights.
The platform lets users:
Explore Climate Layers: solar radiation, temperature, precipitation, aerosols, cleaning intervals, and PV suitability.
Click Any Location: view energy potential, soiling risk, cleaning frequency, and local climate metrics.
Get AI Expert Insights: receive tailored recommendations about installation potential, challenges, and economic viability through an integrated AI agent.
This combination of data transparency, visual interactivity, and AI explanations bridges the gap between technical feasibility and community-level decision-making.
How We Built It
We developed the application using a TypeScript + React stack and the Lovable.ai rapid prototyping platform.
The backend runs on Supabase, using Edge Functions to fetch and cache open climate datasets from:
NASA POWER (solar irradiance, temperature, precipitation)
CAMS Global Reanalysis (EAC4) (aerosol optical depth)
ERA5 / ECMWF (meteorological validation)
Key calculations — including energy potential, temperature correction, soiling loss, rain days, and PV suitability scores — are implemented in /src/lib/pvCalculations.ts, following industry-standard formulas.
Data requests are cached in a PostgreSQL database, minimizing API calls and improving performance.
For AI-generated insights, we use Lovable’s Gemini 2.5 Flash model via Supabase Edge Functions (analyze-solar-location).
Challenges We Ran Into
Integrating datasets with inconsistent spatial and temporal resolutions
Estimating rain days from monthly precipitation averages
Designing formulas that are both scientifically sound and interpretable for non-experts
Managing API limits and ensuring responsive map interactions
Maintaining clarity and correctness in AI explanations
Accomplishments We’re Proud Of
Built a functional, open-source web tool in under 24 hours
Successfully merged multi-source climate data for Benin, Togo, and parts of Ghana
Created an intuitive, interactive visualization that democratizes solar planning
Established a transparent, reproducible methodology for PV assessment
Designed a modular system ready for global expansion and deeper analytics
What We Learned
We learned how to unify complex climatological data into actionable, human-readable insights — and how open, interpretable AI can empower sustainable development.
We also realized that simplifying models for accessibility can be more difficult than achieving technical precision, especially when the goal is community impact.
What’s Next for SolarAtlas AI
Data Expansion: integrate grid proximity, elevation, and land use layers
Economic Modeling: include cleaning cost vs. yield optimization
Global Coverage: scale from West Africa to worldwide solar feasibility
API & Integration: enable data access for policy and NGO platforms
Smarter AI Agent: refine the expert assistant to provide more context-aware, location-specific recommendations
Built With
- github
- lovable
- mapbox-gl
- openstreetmap
- python
- react
- supabase
- tailwind
- typescript
- vite

Log in or sign up for Devpost to join the conversation.