Inspiration
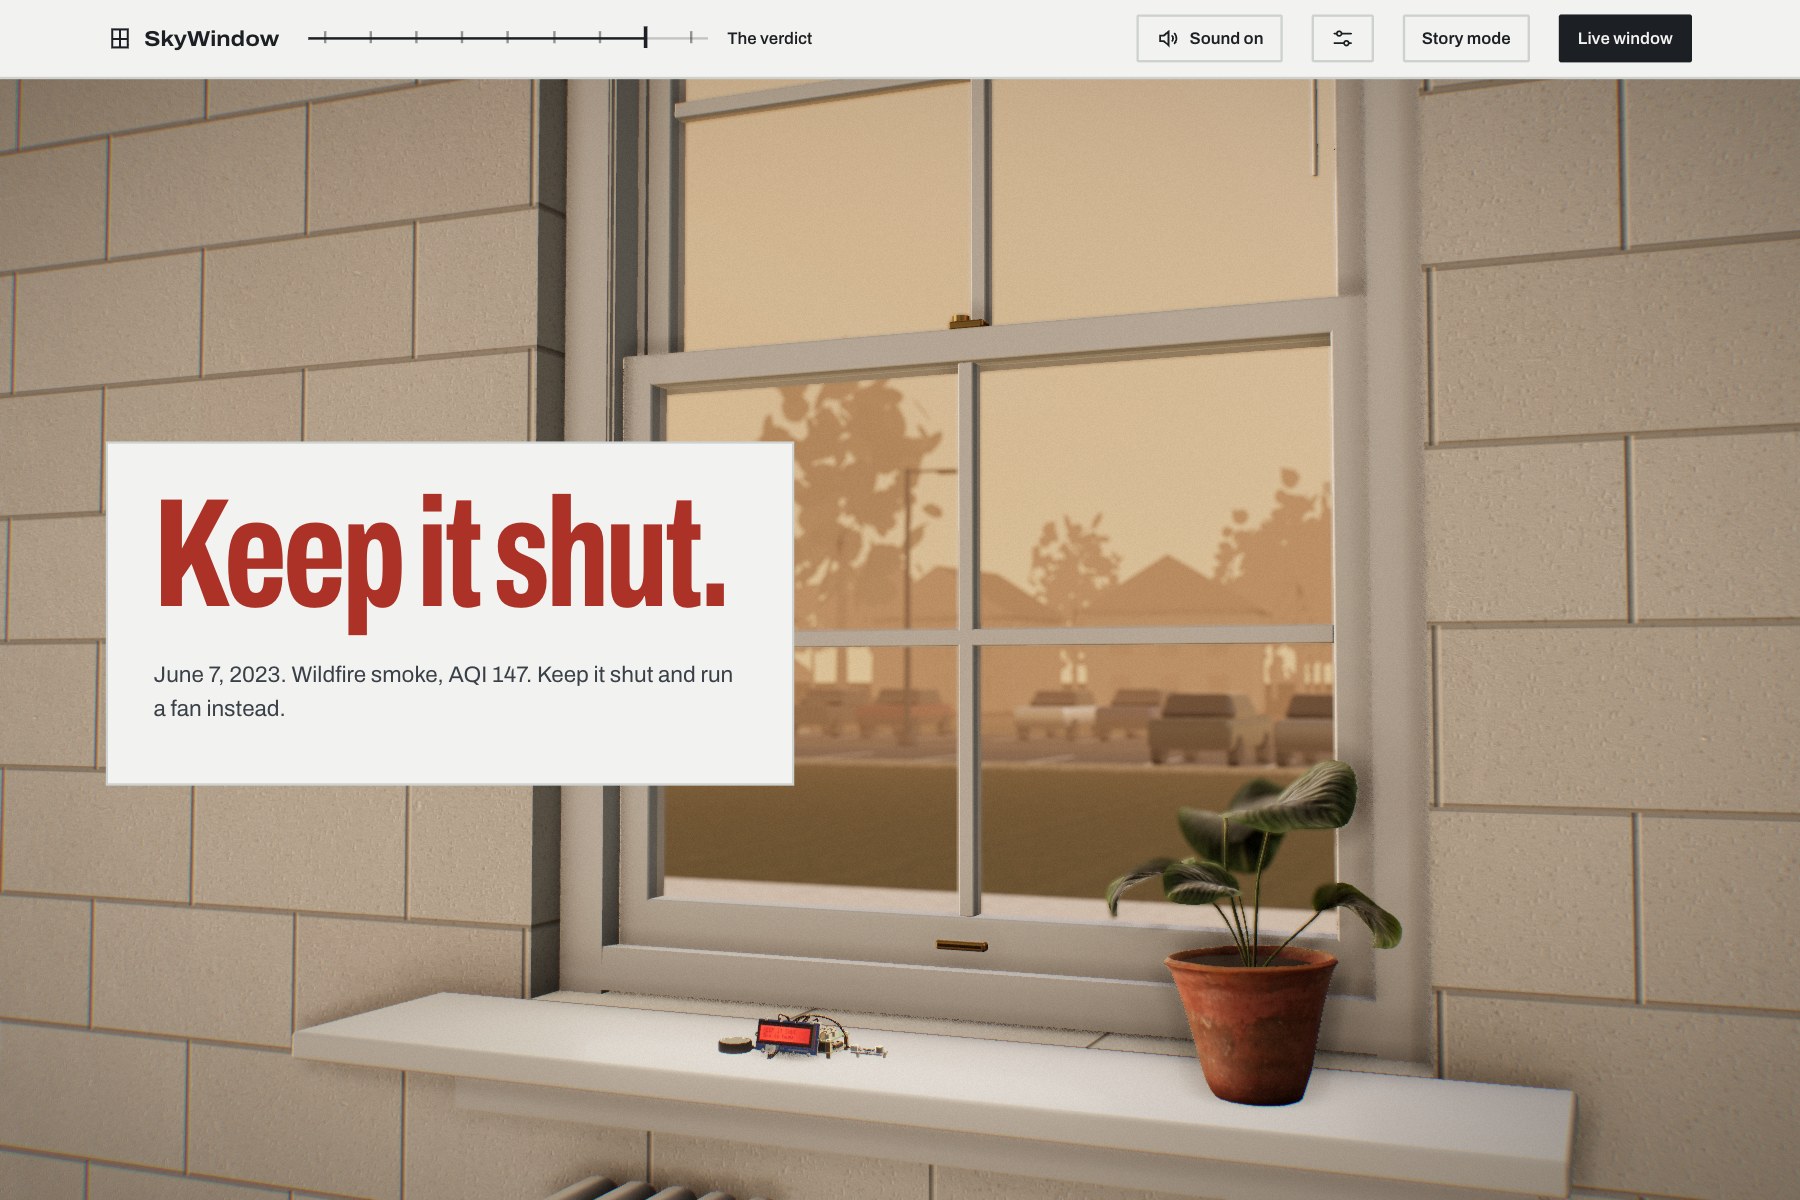
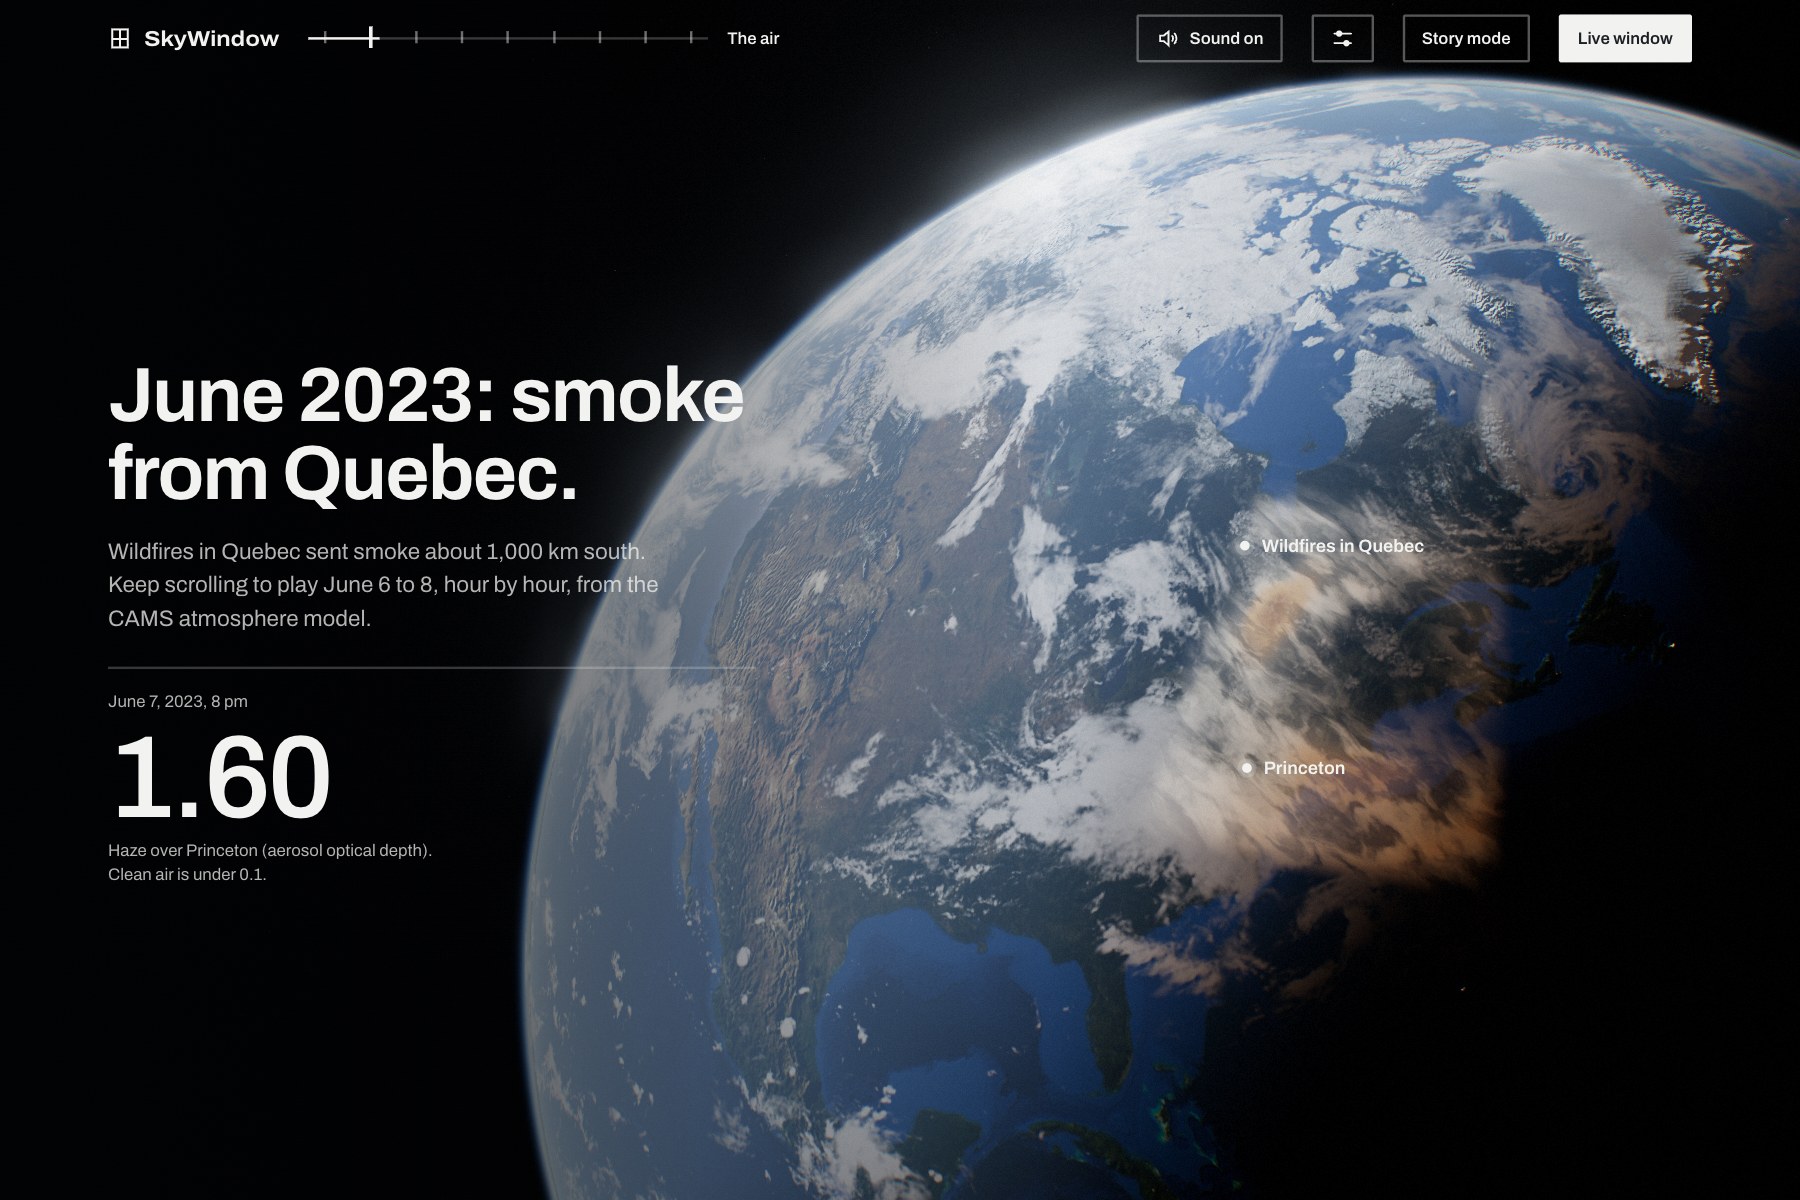
On June 7, 2023, smoke from Canadian wildfires turned the sky over Princeton orange. That day, opening a window was the worst thing you could do. On almost any other day, it's the best thing you can do for a stuffy classroom.
The problem is that you can't tell which kind of day it is from inside a room. Haze can be invisible, and a room can go stale without anyone noticing. The theme was "Into the Skies", so we picked one question about the sky that people can actually act on: should I let the sky in?
What it does
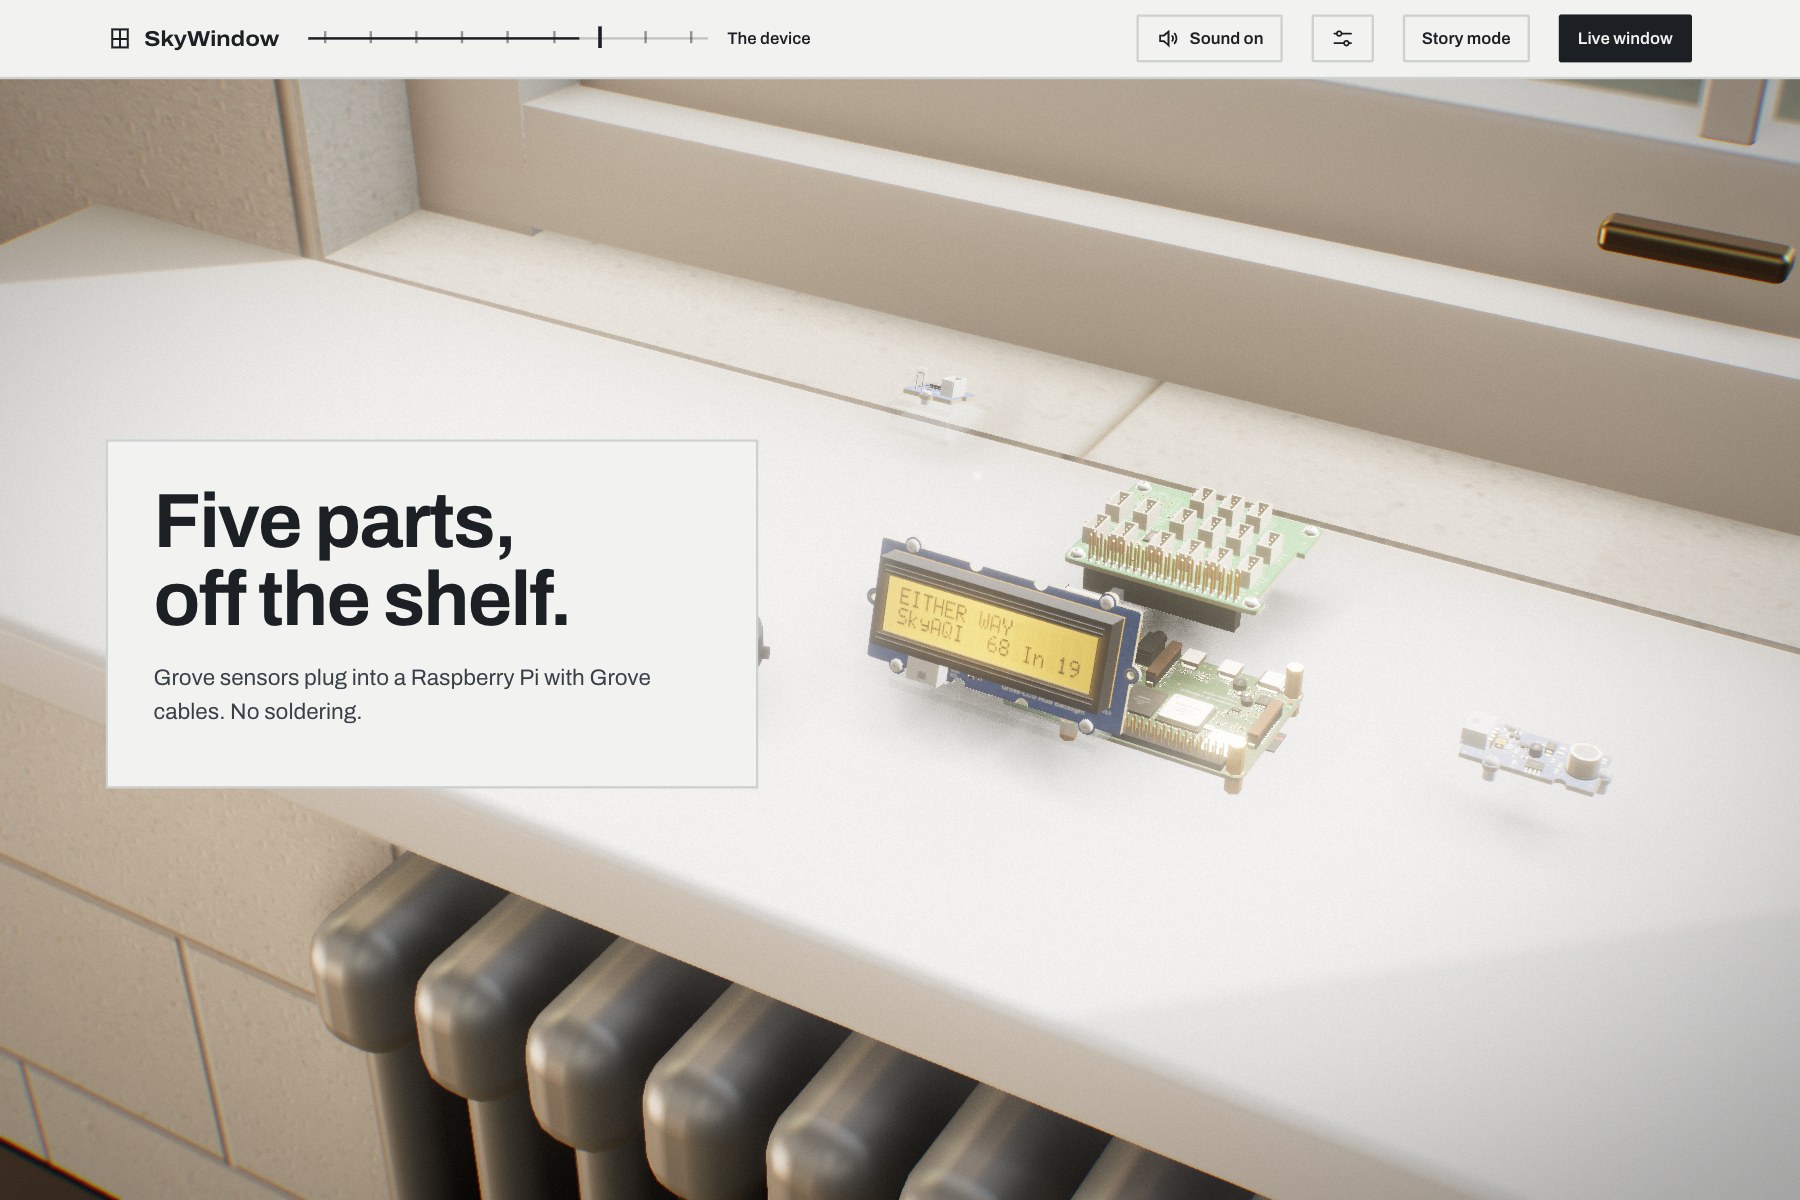
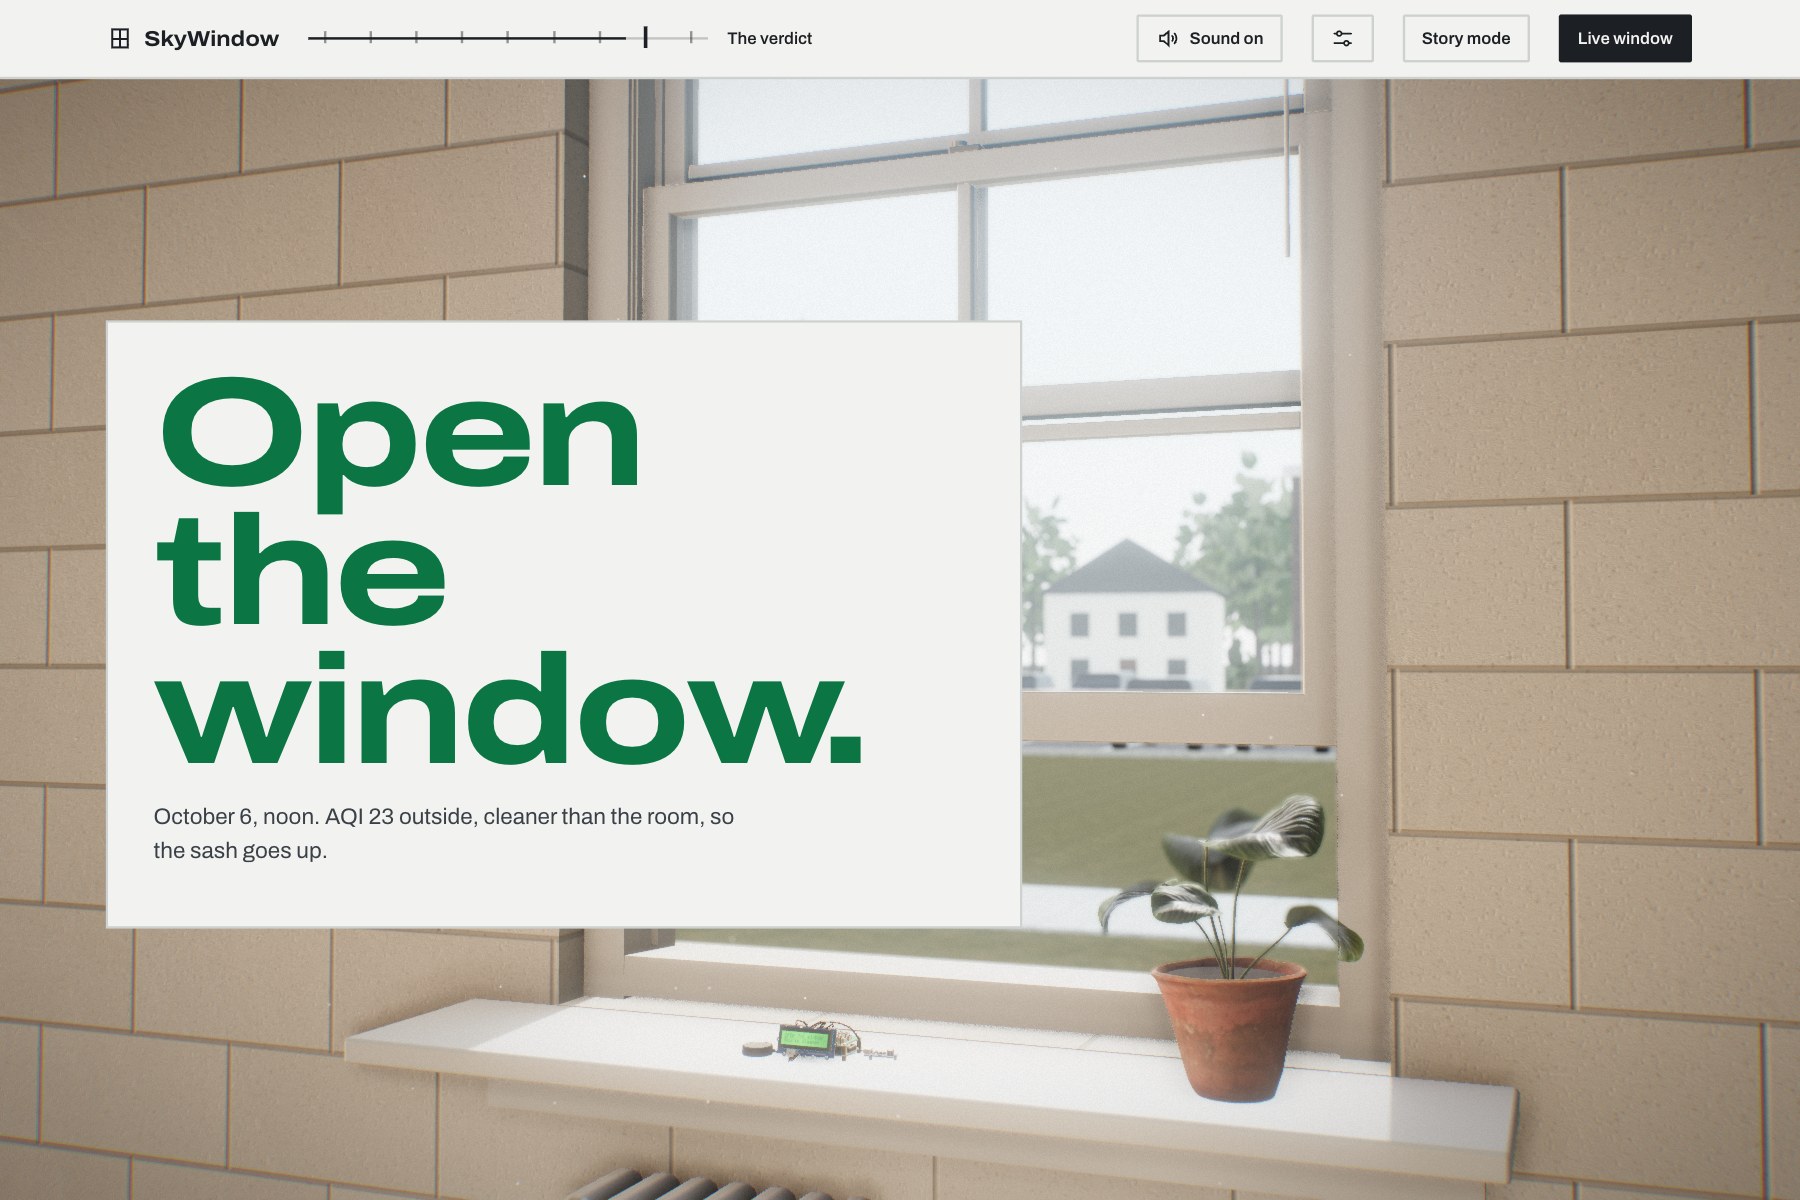
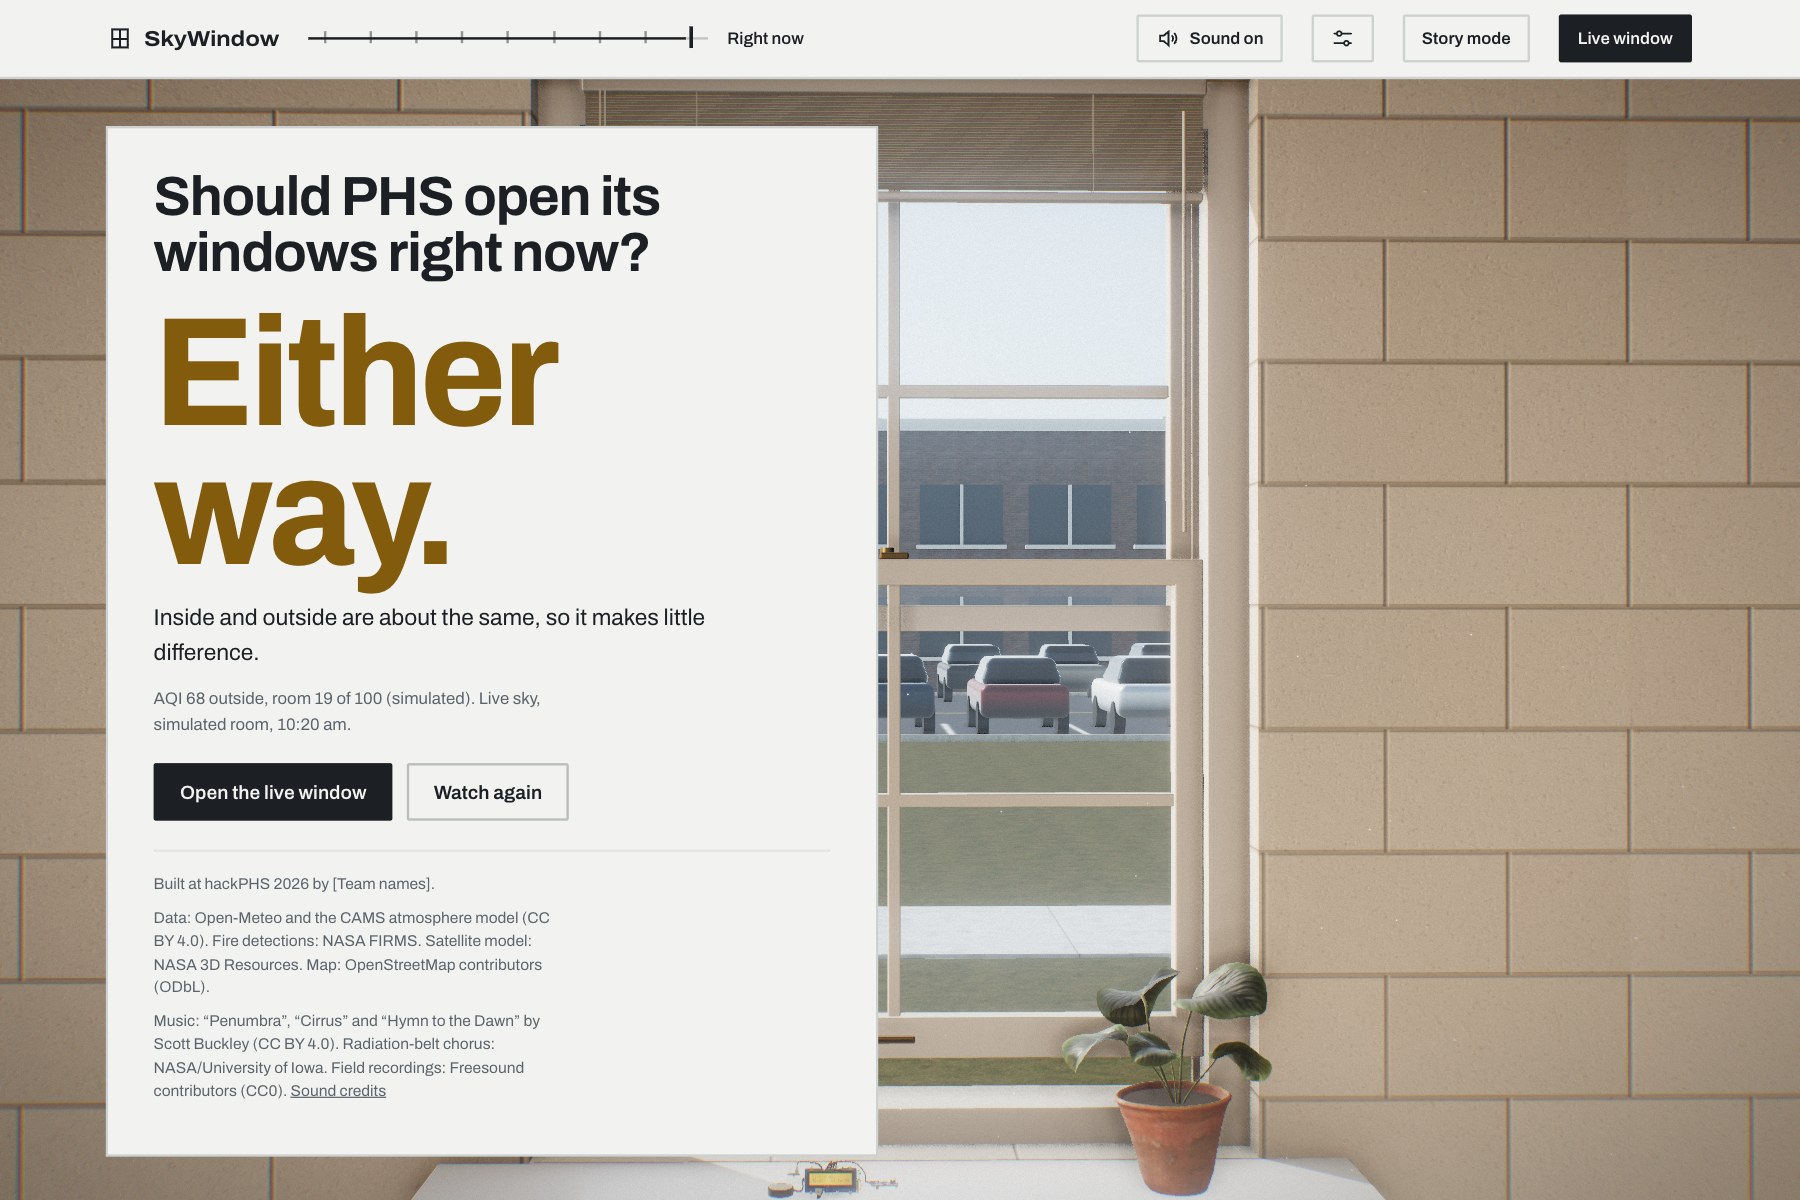
SkyWindow is a Raspberry Pi that sits on a classroom windowsill. It compares the sky above Princeton High School with the air in the room, and its LCD shows one answer:
| LCD | Verdict | When |
|---|---|---|
| 🟢 | OPEN THE WINDOW | The sky is cleaner than the room |
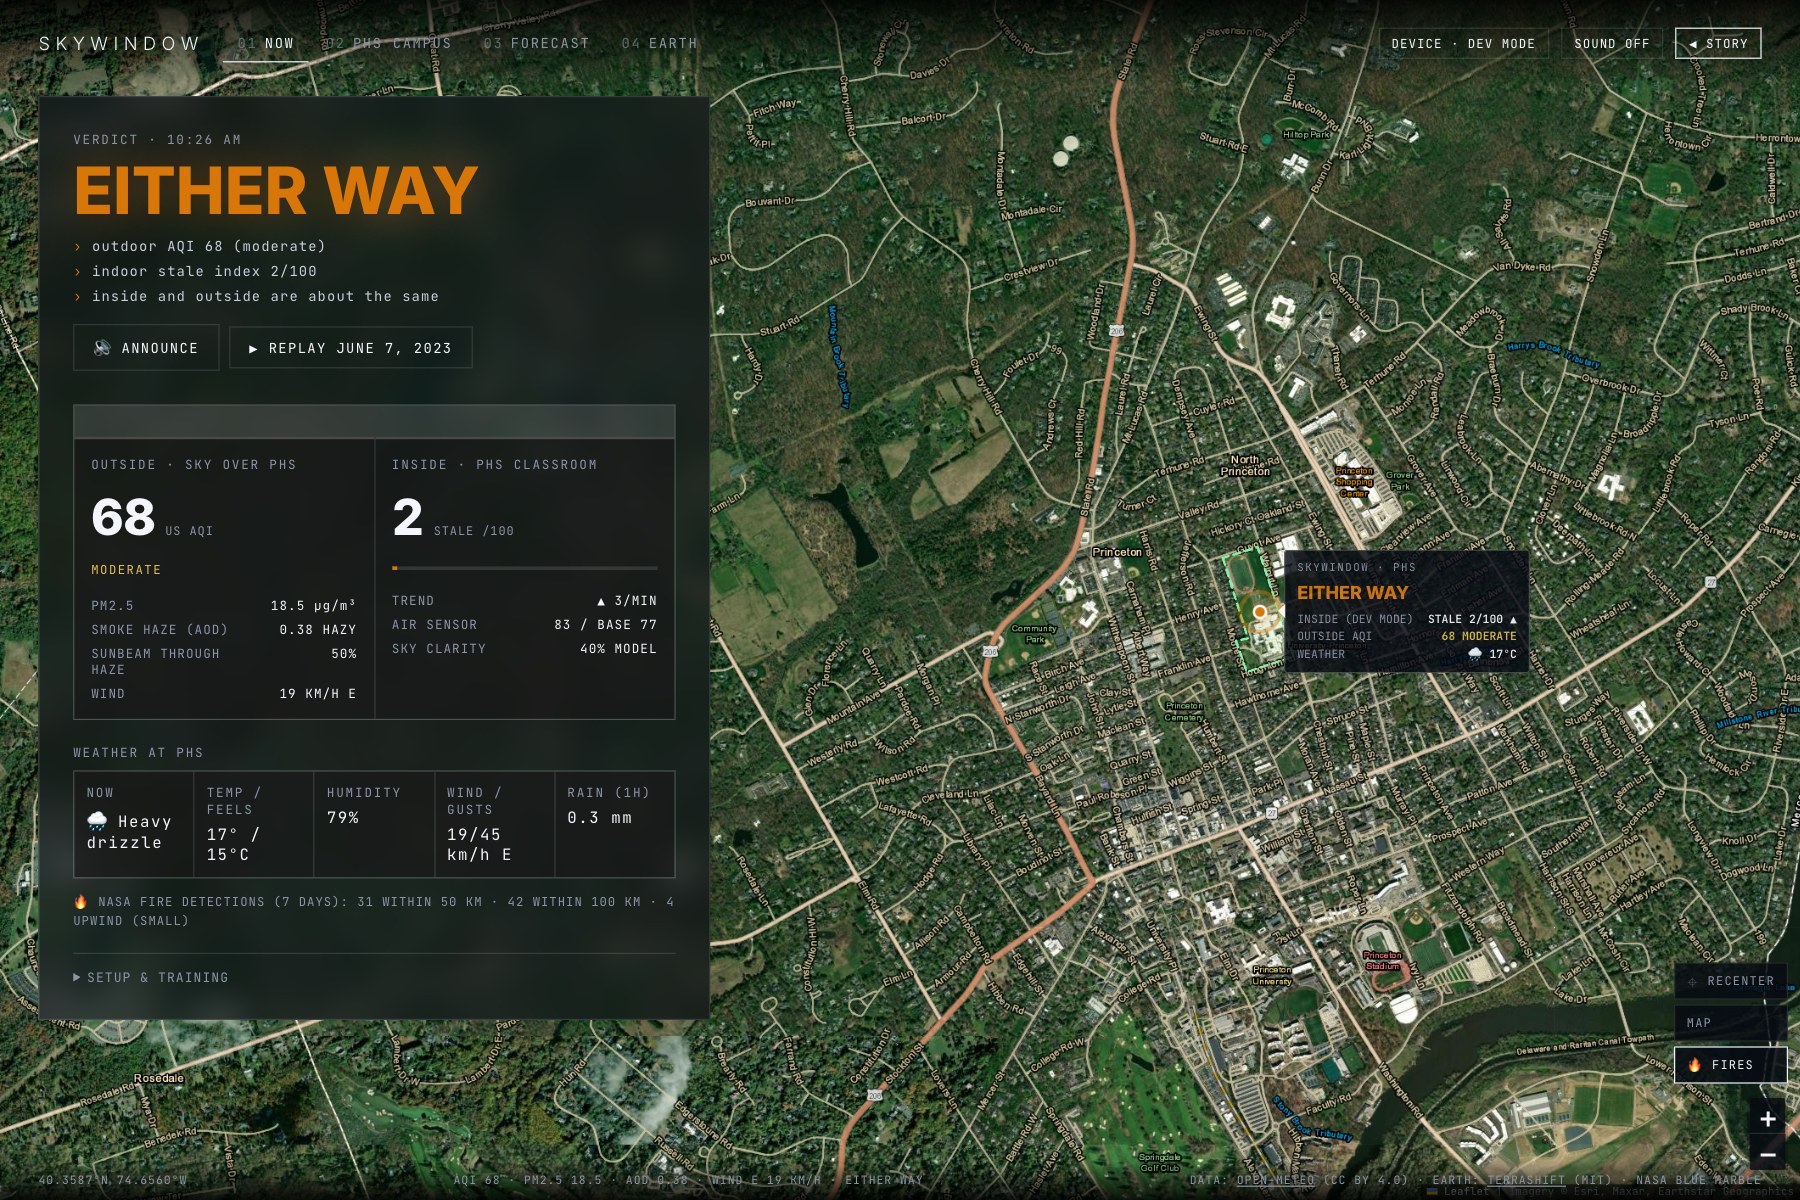
| 🟡 | EITHER WAY | Inside and outside are about the same |
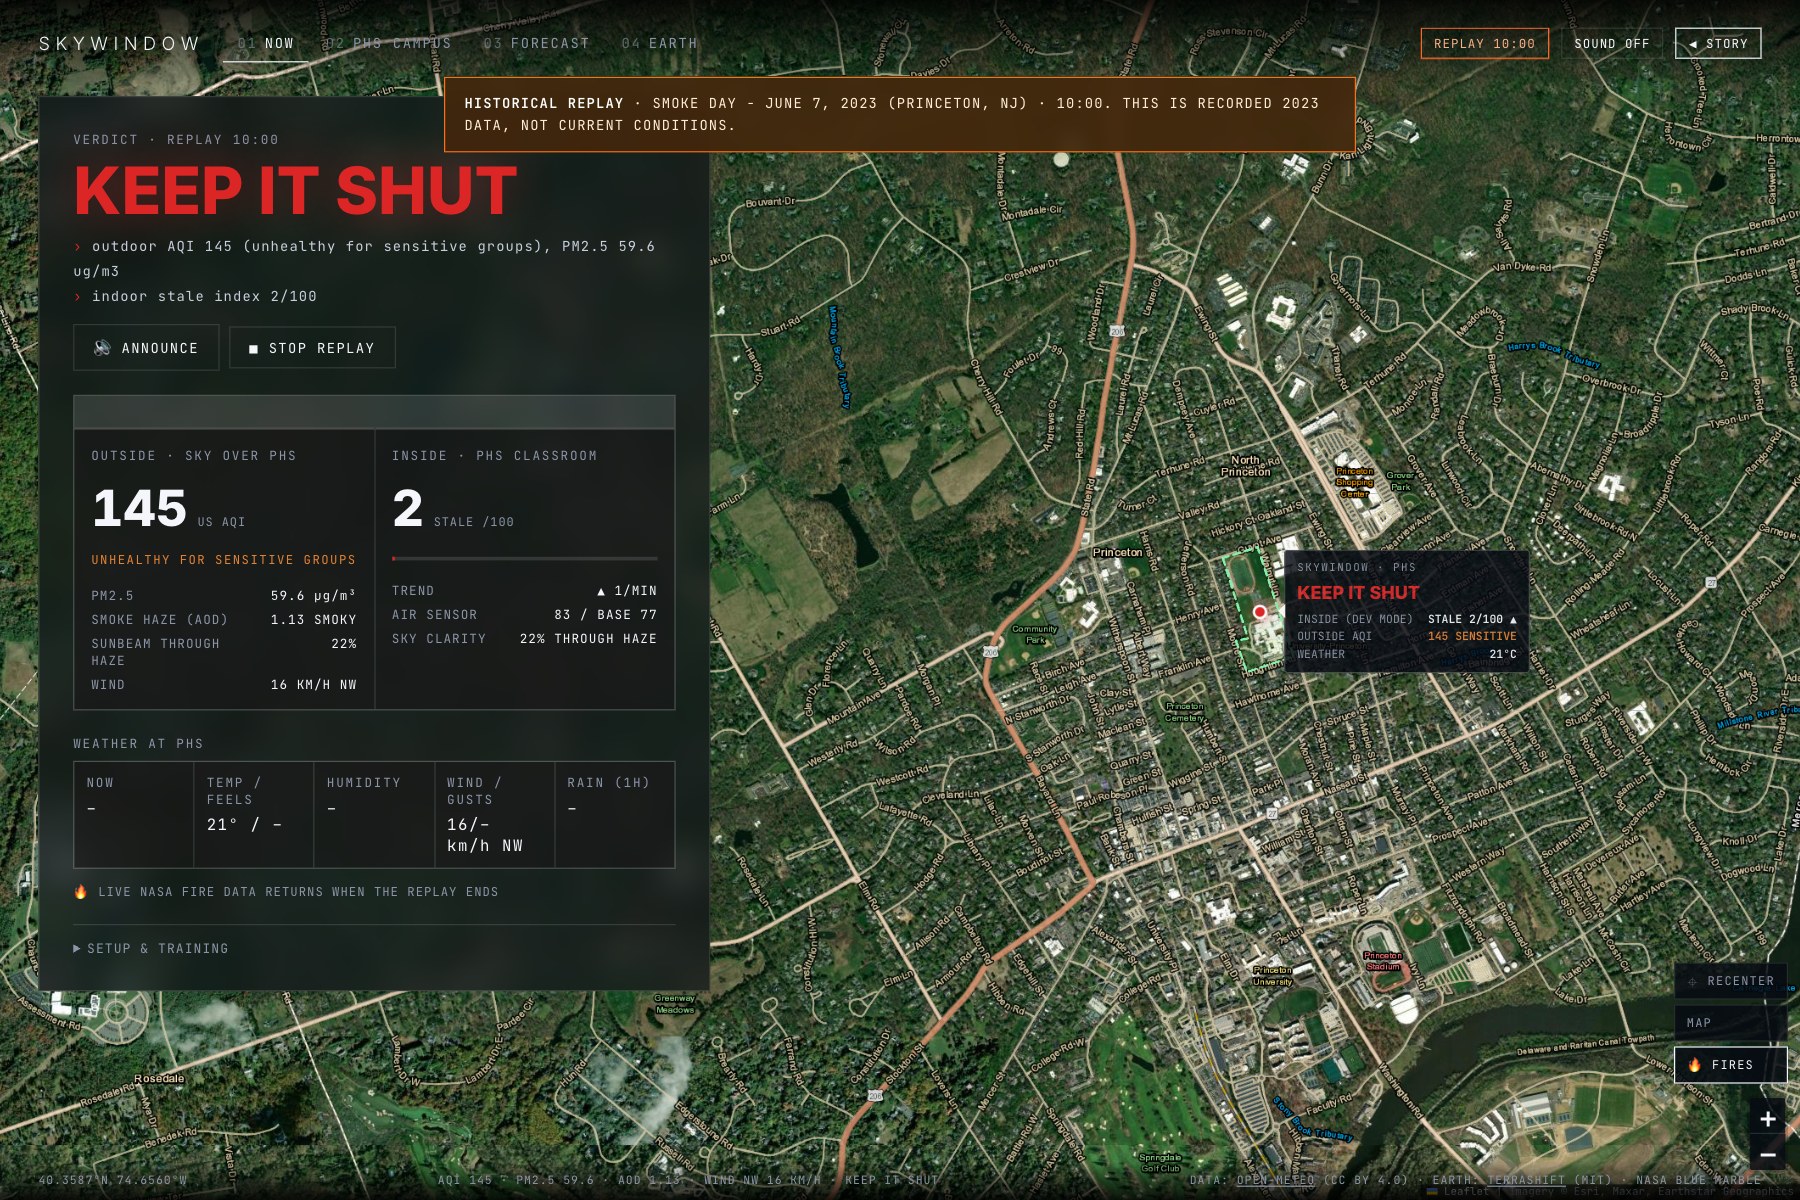
| 🔴 | KEEP IT SHUT | Smoke, haze or particles outside (AQI > 100, PM2.5 > 35.4 µg/m³, or heavy haze) |
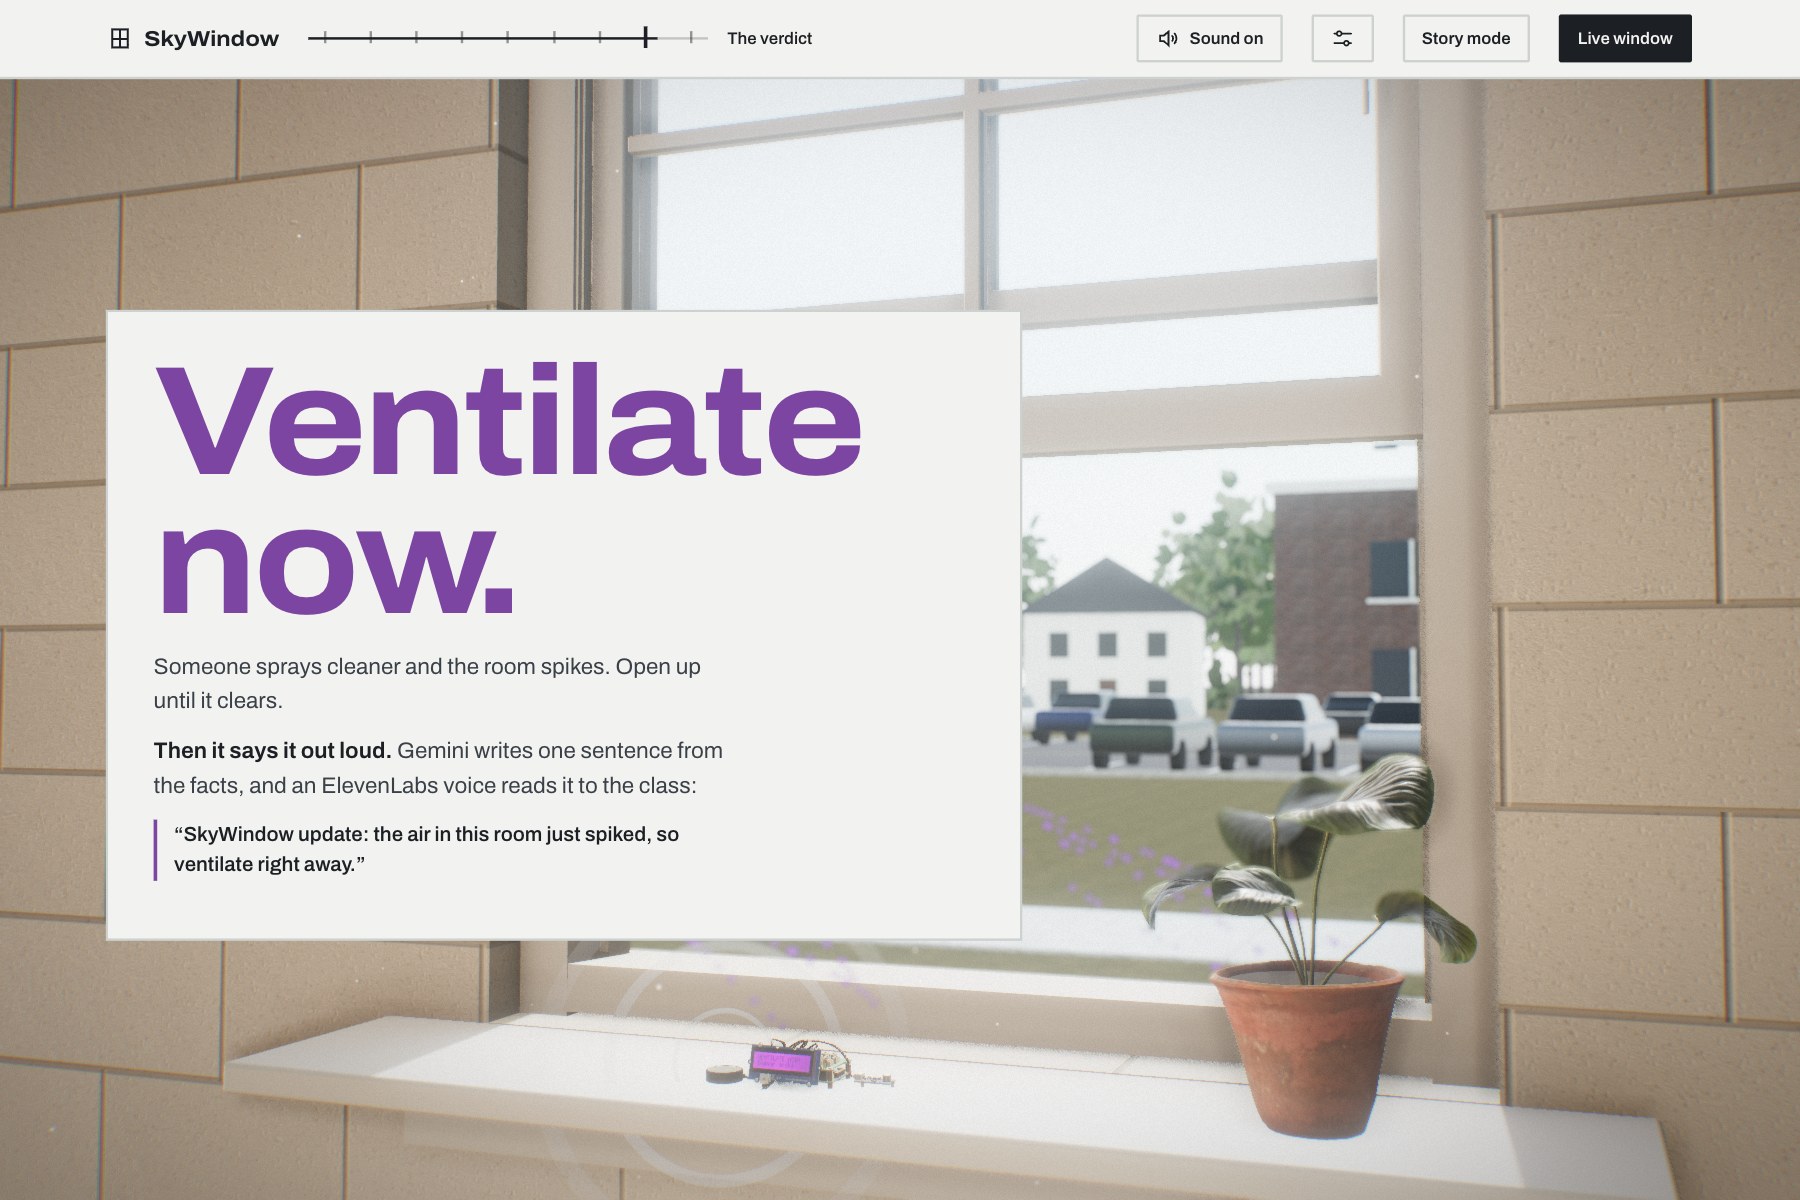
| 🟣 | VENTILATE NOW | The room just spiked (hand sanitizer, markers, cleaning spray) |
- Read it aloud. Gemini turns the live numbers into a one- or two-sentence classroom announcement. An ElevenLabs voice reads it out in the browser or through the device's speaker.
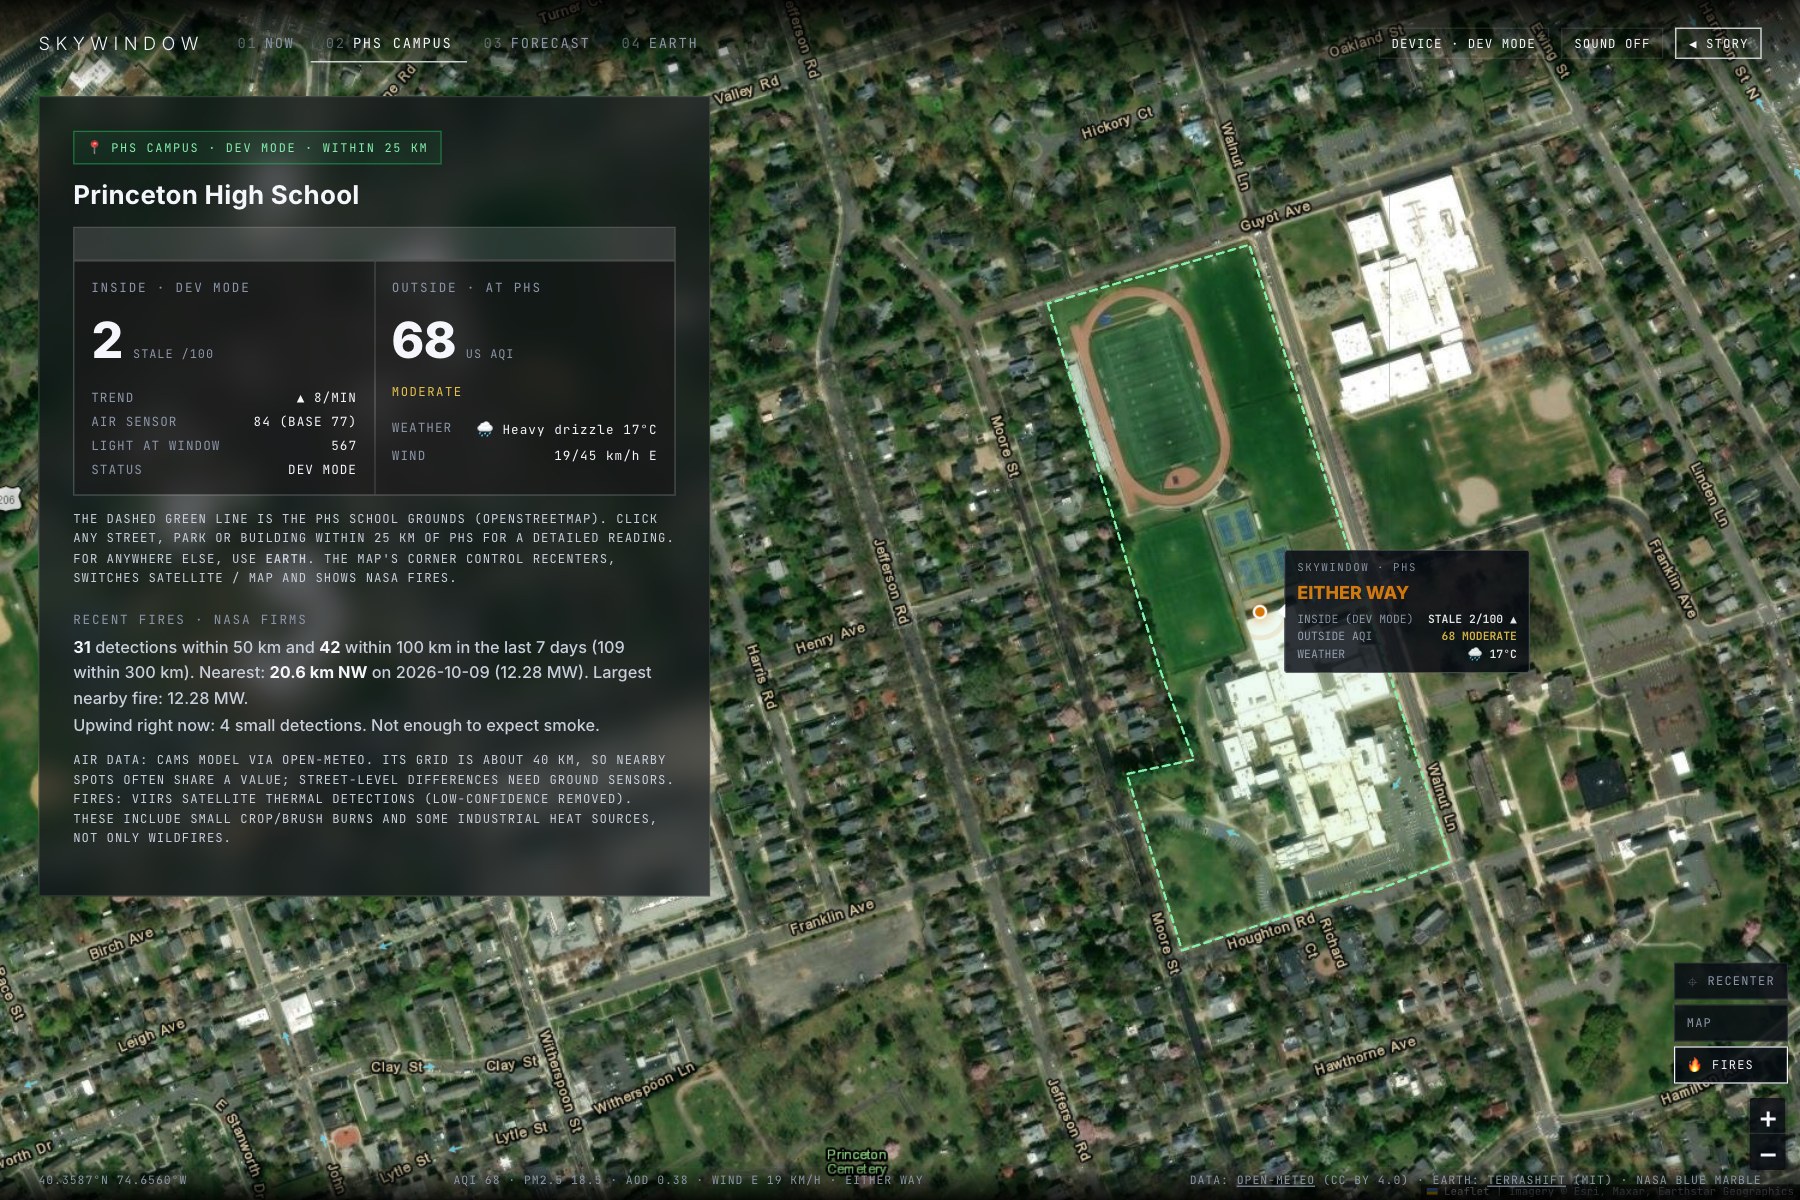
- Fire Watch. Every hour the Pi downloads NASA's VIIRS satellite fire detections and works out which fires are upwind. If sizeable fires could blow smoke our way, "open" becomes "either way".
- Smoke Day replay. One button replays June 7, 2023 hour by hour from real historical atmospheric data. The LCD, the verdict and the voice react as if it were happening again.
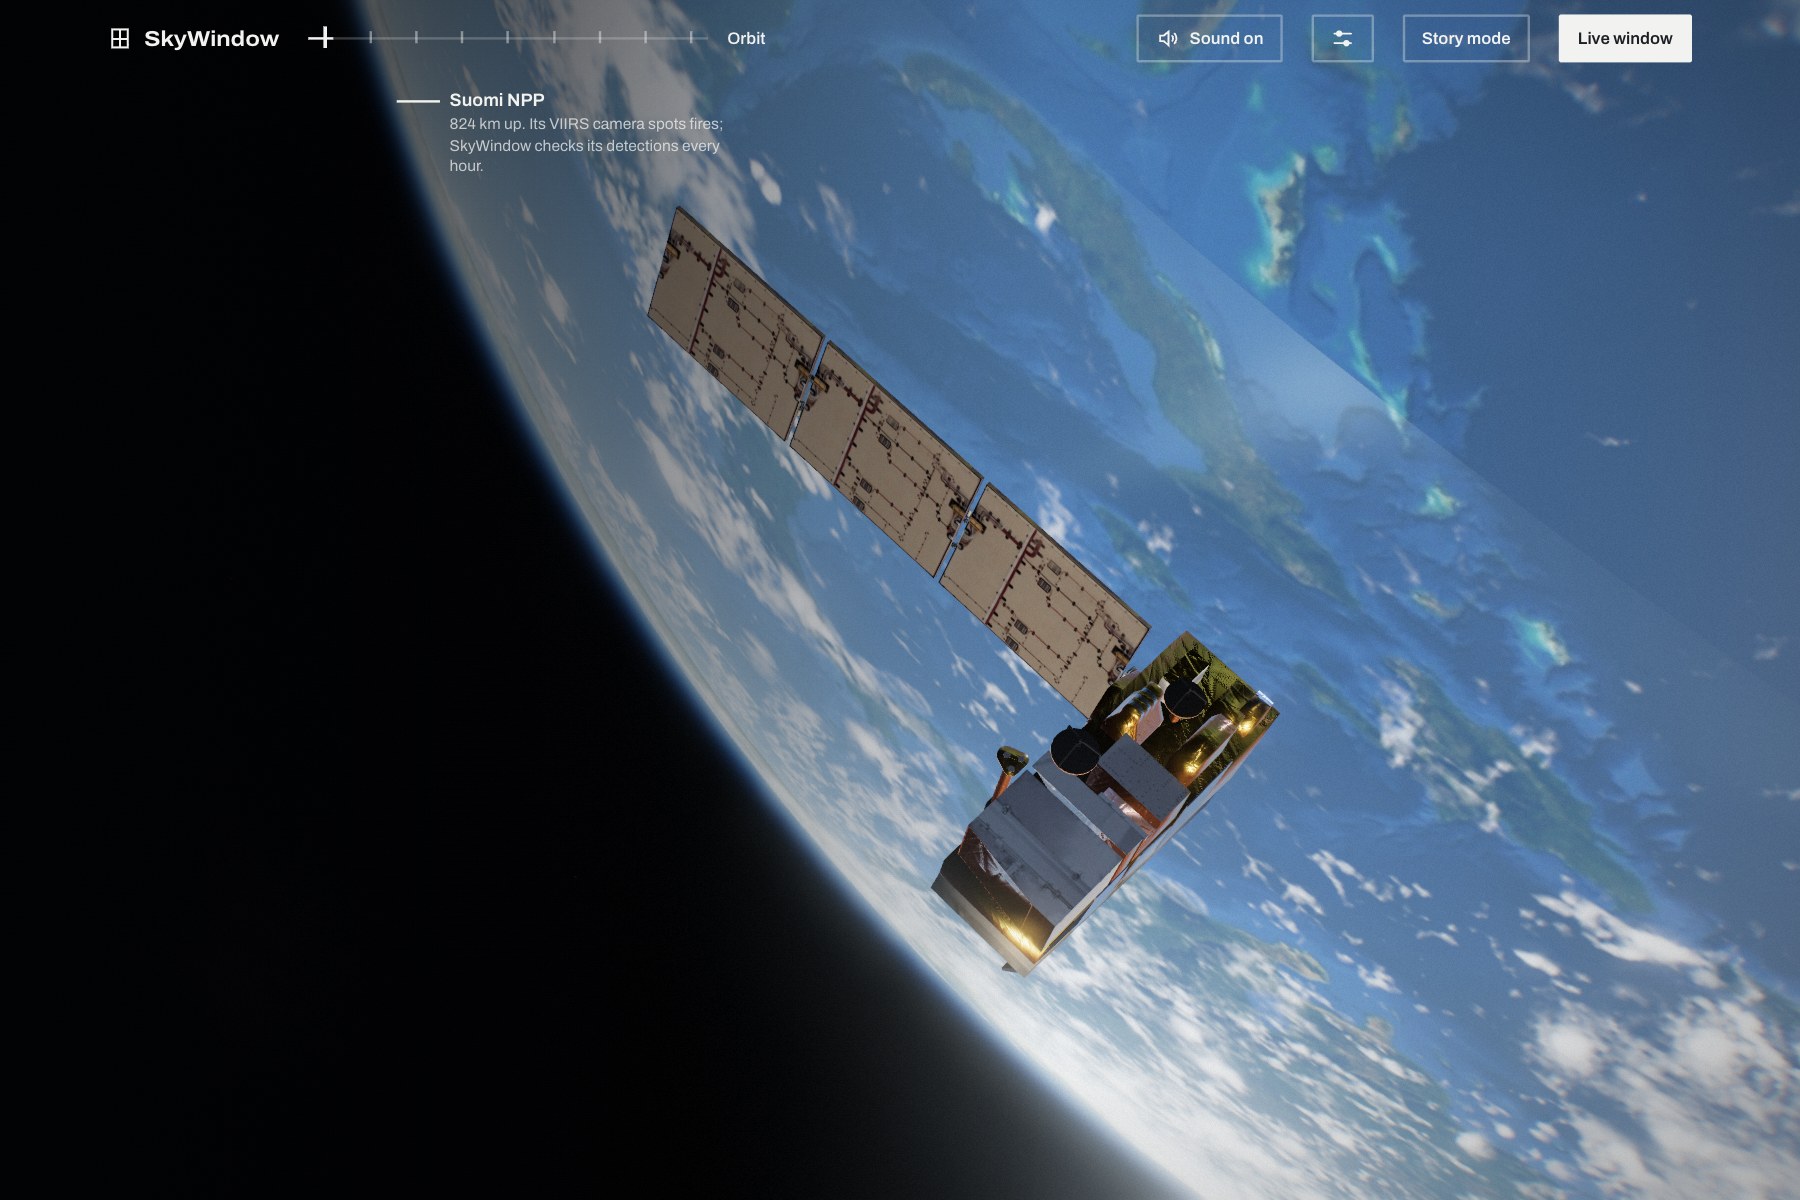
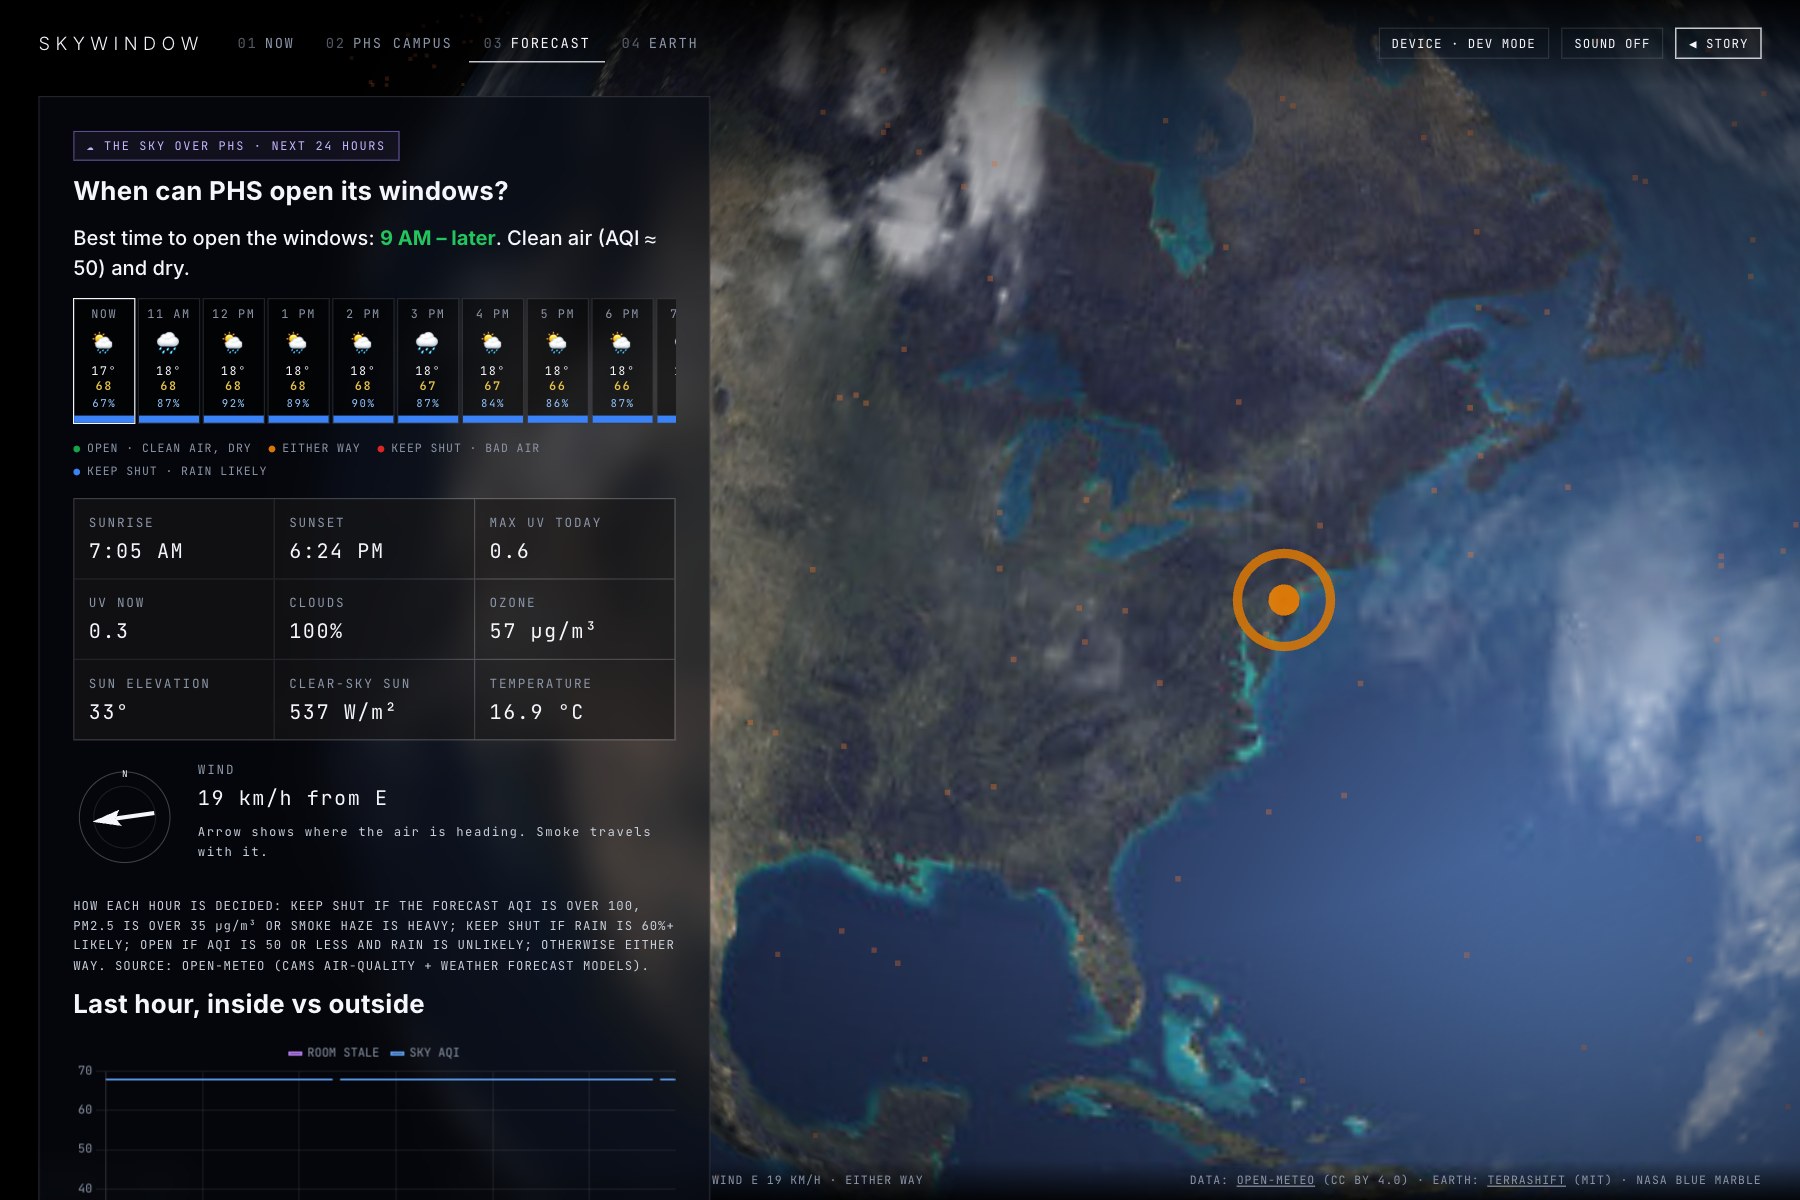
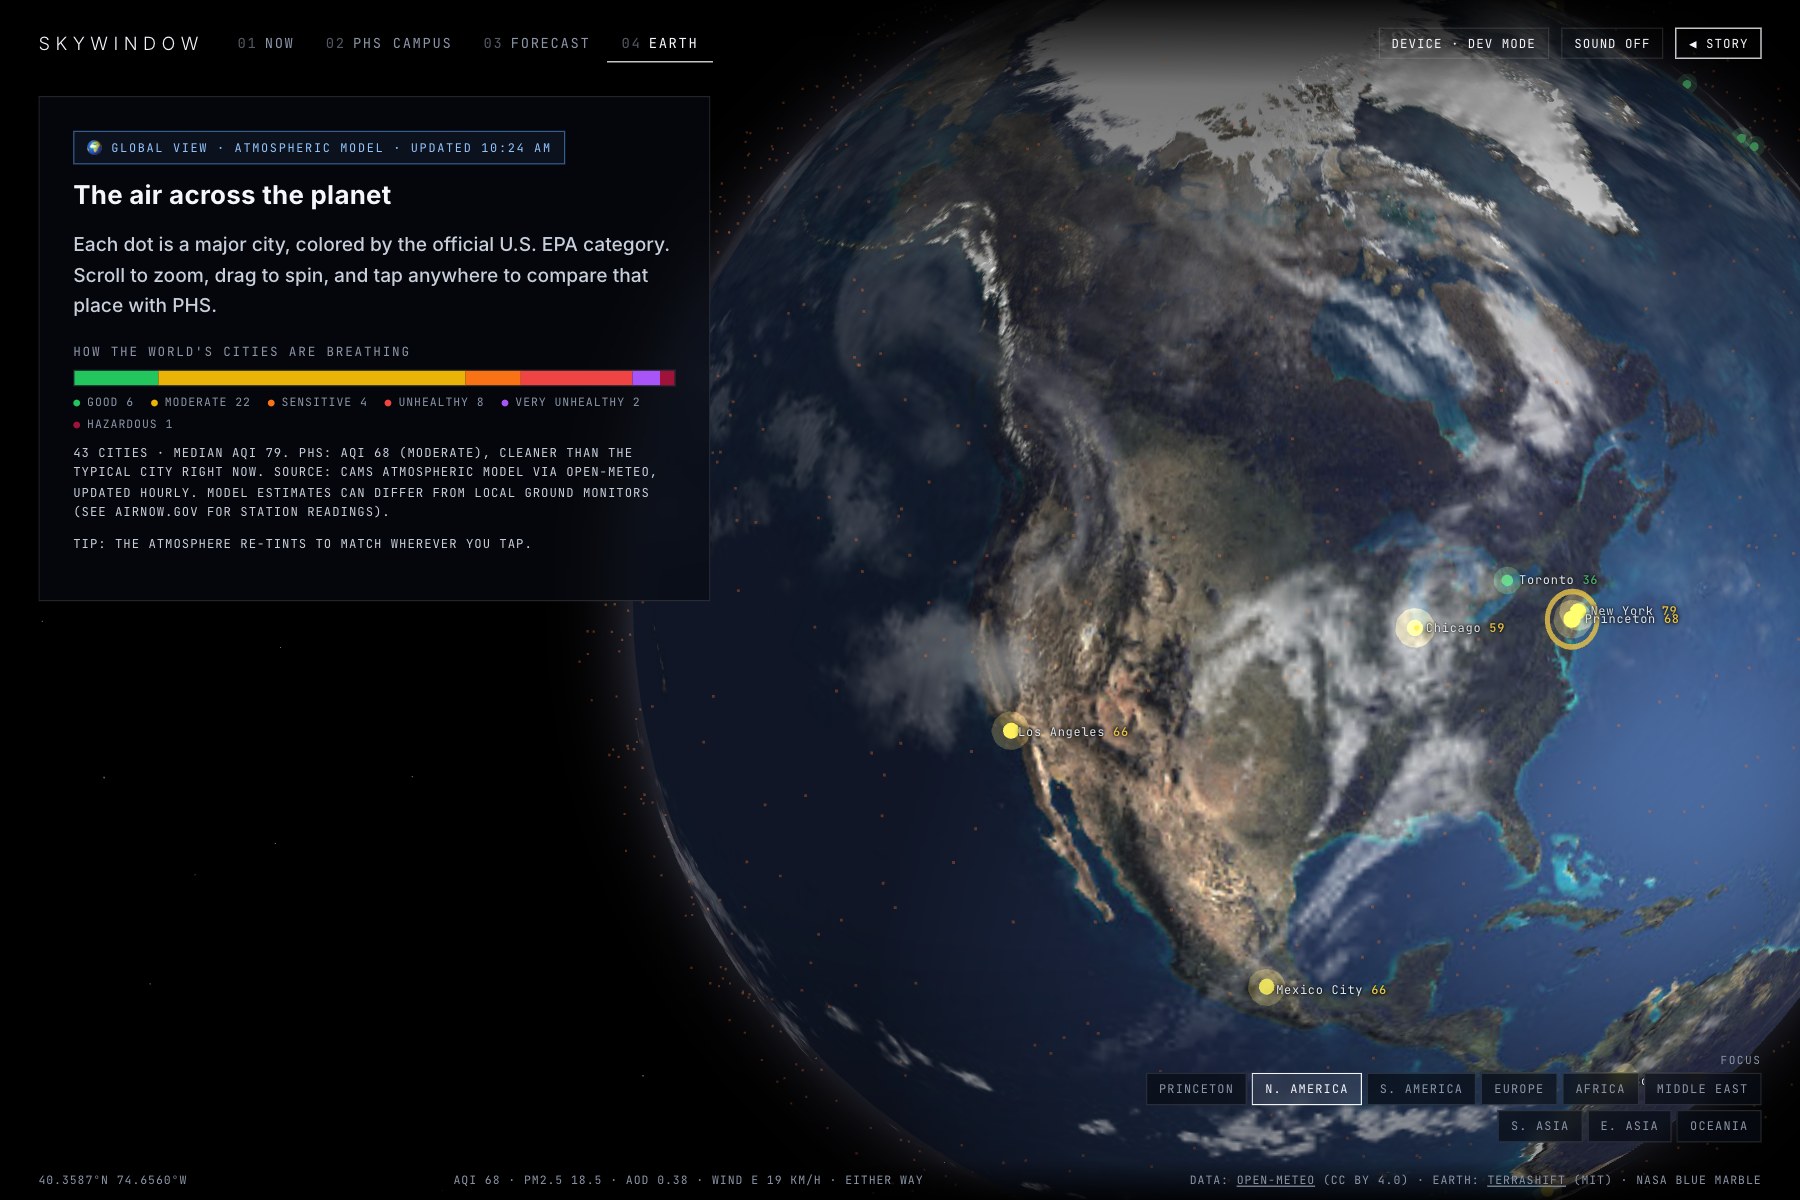
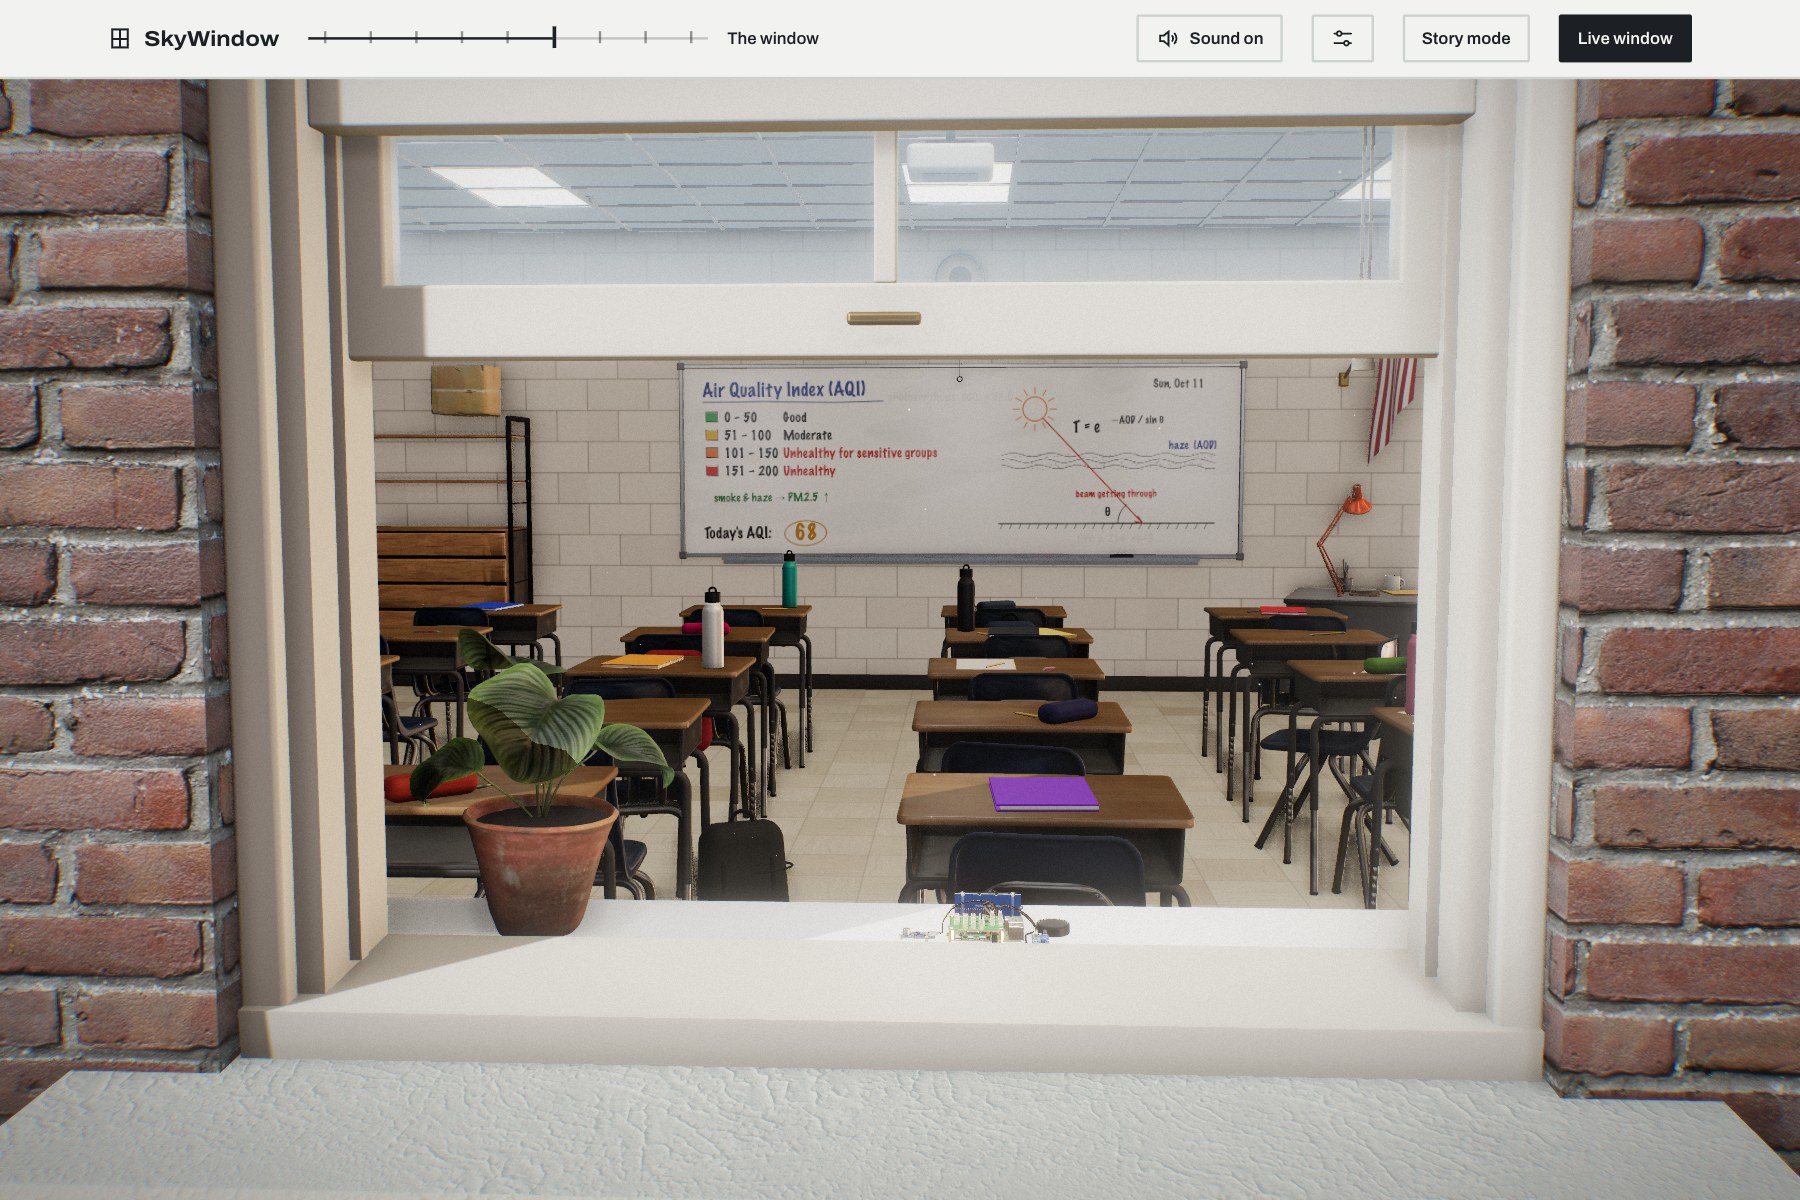
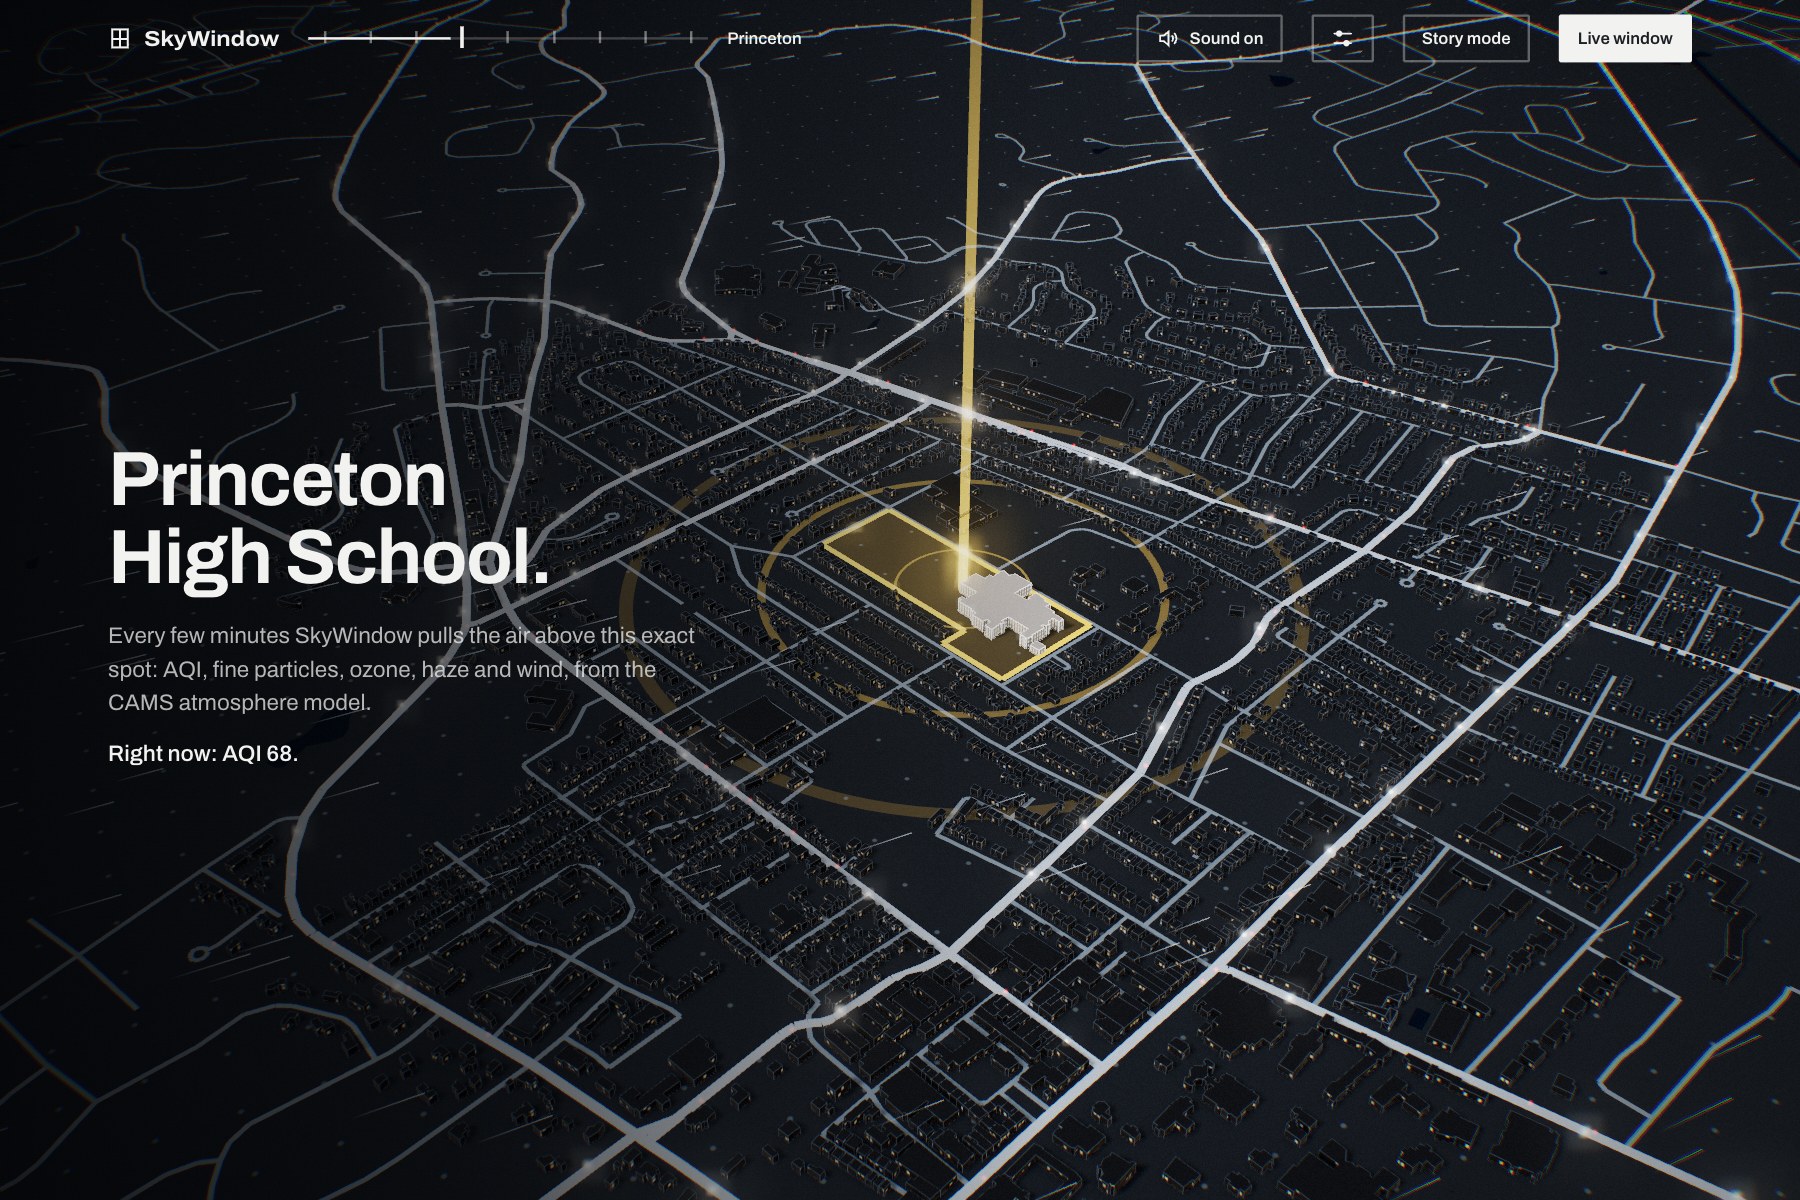
- The website. A scroll-driven 3D story starts at a satellite 824 km up. It flies through the real 2023 smoke plume and down to the device on the windowsill. Then it dives into a live dashboard: the current verdict, inside vs. outside readings, a 24-hour "When can PHS open its windows?" forecast and a global air-quality view. Without the Pi, the site runs in showcase mode, so anyone can try it on their phone.
How we built it
Hardware. A Raspberry Pi 4 with a Grove Base HAT, a Grove Air Quality v1.3 sensor, a Grove light sensor facing out the window, a Grove RGB LCD and a small speaker.
Backend. Python and FastAPI run a loop once a second. Each tick reads and smooths the sensors, gets the sky data, decides the verdict, updates the LCD and logs to SQLite. The outdoor data (US AQI, PM2.5, ozone, aerosol optical depth, wind and weather) comes from Open-Meteo, which uses the CAMS atmospheric models.
The indoor reading. Our air sensor measures relative VOC levels, not AQI, so we never call it AQI. Instead we turn it into a 0–100 "stale index", measured against the cleanest air the room has had in the last 24 hours (b):
$$ \text{stale index} = \min\left(100,\ \max\left(0,\ 100\cdot\frac{r - b}{250}\right)\right) $$
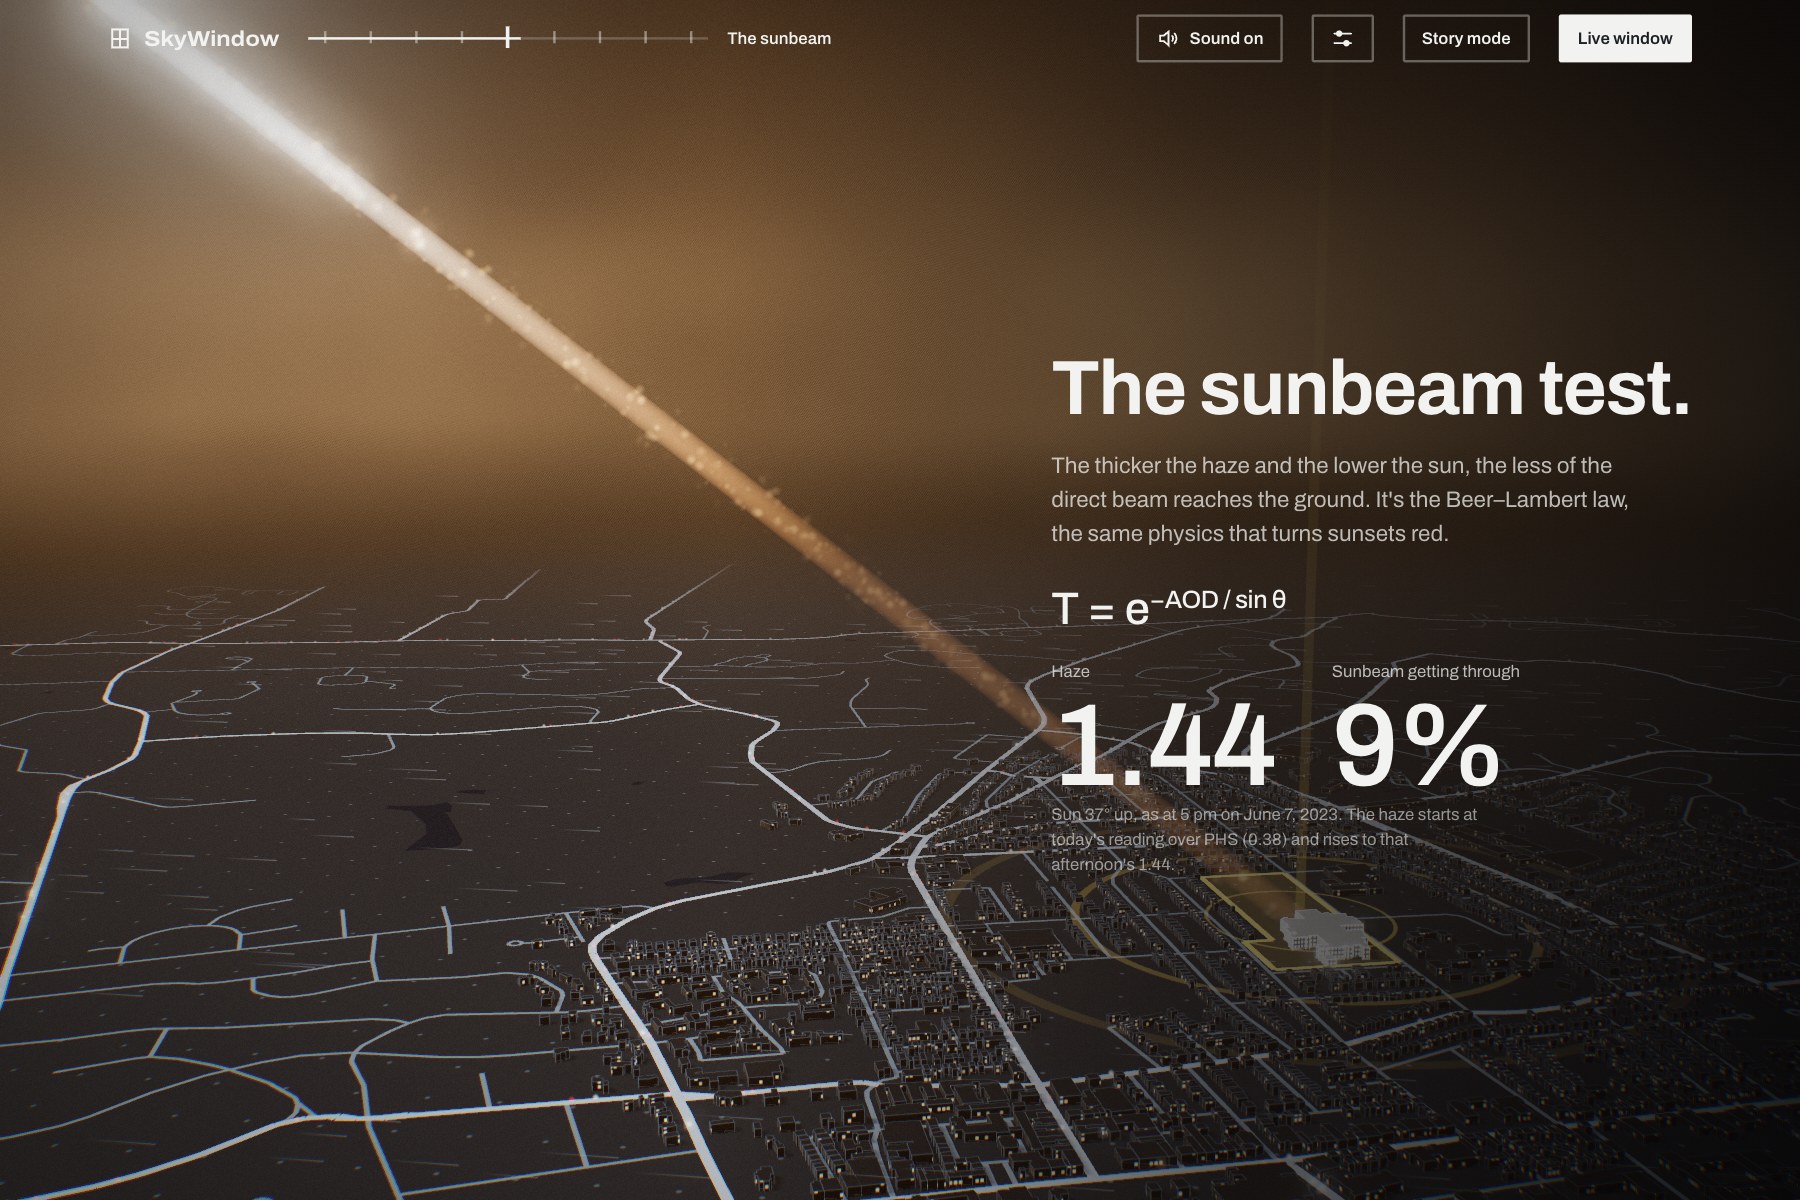
The sky physics. We calculate the sun's position with NOAA's solar equations. Then the Beer–Lambert law tells us how much of the direct sunbeam gets through the haze on its slanted path:
$$ T = e^{-\tau / \sin h} $$
Here τ is the aerosol optical depth and h is the sun's elevation. With the sun high on a clear day, T is about 88%. Under the June 2023 smoke, with τ near 1.5, it drops to roughly 5–30%, depending on the sun angle. We also compare the light sensor with the Haurwitz clear-sky model, where Z is the solar zenith angle:
$$ \text{GHI}_{\text{clear}} = 1098\,\cos Z\; e^{-0.057/\cos Z} $$
The ratio shows how much of the expected sunlight is actually reaching the window.
Fires. A fire counts as upwind if it's within 45° of the direction the wind is coming from. We only warn when the upwind fires within 150 km add up to at least 30 MW of fire radiative power. That way, small crop burns don't set off alarms.
AI. The Gemini prompt gets a fixed fact sheet: the verdict, AQI, haze, wind and the cleanest two-hour window in the forecast. The prompt only allows those facts, so the model can't invent numbers. We also trained a random forest to guess what's happening in the room. Its training data is sensor samples we labeled during the hackathon: normal air, chemicals, breath and a covered light sensor. We cross-validated it by labeling session, so near-identical back-to-back samples couldn't inflate the score.
Web. The story is built with three.js, GSAP and Lenis. It uses NASA Blue Marble and Black Marble imagery, a real star catalogue, NASA's Suomi NPP satellite model, 3,000 Princeton buildings from OpenStreetMap and the CAMS smoke plume for June 6–8, 2023. Everything is bundled, so only the live data needs internet. A test keeps the browser's copy of the verdict logic identical to the Python version.
A backup backend. Sensors can fail during a demo, so we built a separate process with a classroom simulator based on published research. It models hand sanitizer, breath, markers, cleaning spray, and CO₂ that rises and falls realistically with the people in the room. It never touches the Pi's readings or database, and the dashboard labels its data BACKUP FEED.
Challenges we ran into
- Our sensor doesn't measure AQI. The Grove VOC sensor gives a relative number that drifts. Our first baseline was the all-time lowest reading, so it could only ever go down. Switching to a rolling 24-hour minimum fixed that.
- The first version only looked outside. It never compared the room with the sky. We rewrote the verdict so that a moderate sky plus a stale room means "open".
- Flickering verdicts. Readings that hovered near a threshold made the LCD and the announcements flip back and forth. We added hysteresis: KEEP IT SHUT starts above AQI 100 but only ends below 95.
- The network froze the sensors. With the Wi-Fi down, every once-a-second update took about 11 seconds, because it waited for the sky data. We moved the sky fetching to its own thread, with retries and a cache.
- "96% sky clarity" under an orange sky. In the replay, the historical sunlight data barely dropped, because that dataset (ERA5) uses average aerosols instead of the actual smoke. We hid that number during the replay and show the Beer–Lambert haze transmission instead.
- Rendering a planet on a school laptop. The 3D story stuttered on some GPUs. We added quality tiers that adapt to each device, turned the sun's shadow map off by default, and show a plain text version when WebGL isn't available.
- Three people, one day. We merged a backend, a dashboard and a 3D story from several branches in 24 hours.
Accomplishments that we're proud of
- SkyWindow gives one honest answer from real data. It never fakes an AQI. If a sensor drops out, it says SENSOR OFFLINE and decides on the outside air alone.
- The Smoke Day replay uses real historical data, so judges can see exactly what SkyWindow would have said on June 7, 2023.
- The story is one continuous flight from orbit to the windowsill, built from real data.
- It works offline, on phones, and without the Pi.
- We wrote a test suite, including the test that keeps the browser and Python verdicts identical.
What we learned
- What aerosol optical depth means, and how the Beer–Lambert law turns it into "how much sun gets through".
- The difference between a forecast model (CAMS) and a reanalysis (ERA5), and why the reanalysis missed the smoke.
- Cheap gas sensors need baselines and warm-up time, and their readings need honest labels.
- Thresholds need hysteresis, or the output flickers.
- An LLM is great for wording, but only when you control which facts it can use.
- Splitting ML data by session instead of randomly gives an honest accuracy.
What's next for SkyWindow
- A second sensor mounted outside the window, so we measure outdoor air directly instead of relying on the model.
- A smoke arrival estimate from upwind fires and wind speed ("smoke may arrive in about 3 hours").
- A real CO₂ sensor, since CO₂ is the clearest sign of a stuffy classroom.
- A servo or smart plug that opens a vent or turns on an air purifier automatically.
- SkyWindows in more PHS classrooms, with a school-wide view of which rooms need air.
Built With
- chart.js
- copernicus-cams
- css3
- elevenlabs
- fastapi
- google-gemini
- grove
- gsap
- html5
- javascript
- leaflet.js
- lenis
- nasa-firms
- node.js
- open-meteo
- openstreetmap
- pytest
- python
- raspberry-pi
- scikit-learn
- sqlite
- three.js
- uvicorn
- web-audio-api
- webgl


Log in or sign up for Devpost to join the conversation.