Inspiration
We wanted to help utility planners identify distribution transformers that may need attention as neighborhoods add new electric loads, especially heat pumps. Rather than wait for equipment problems to expose capacity constraints, the tool helps a planner review loading patterns and projected demand.
What it does
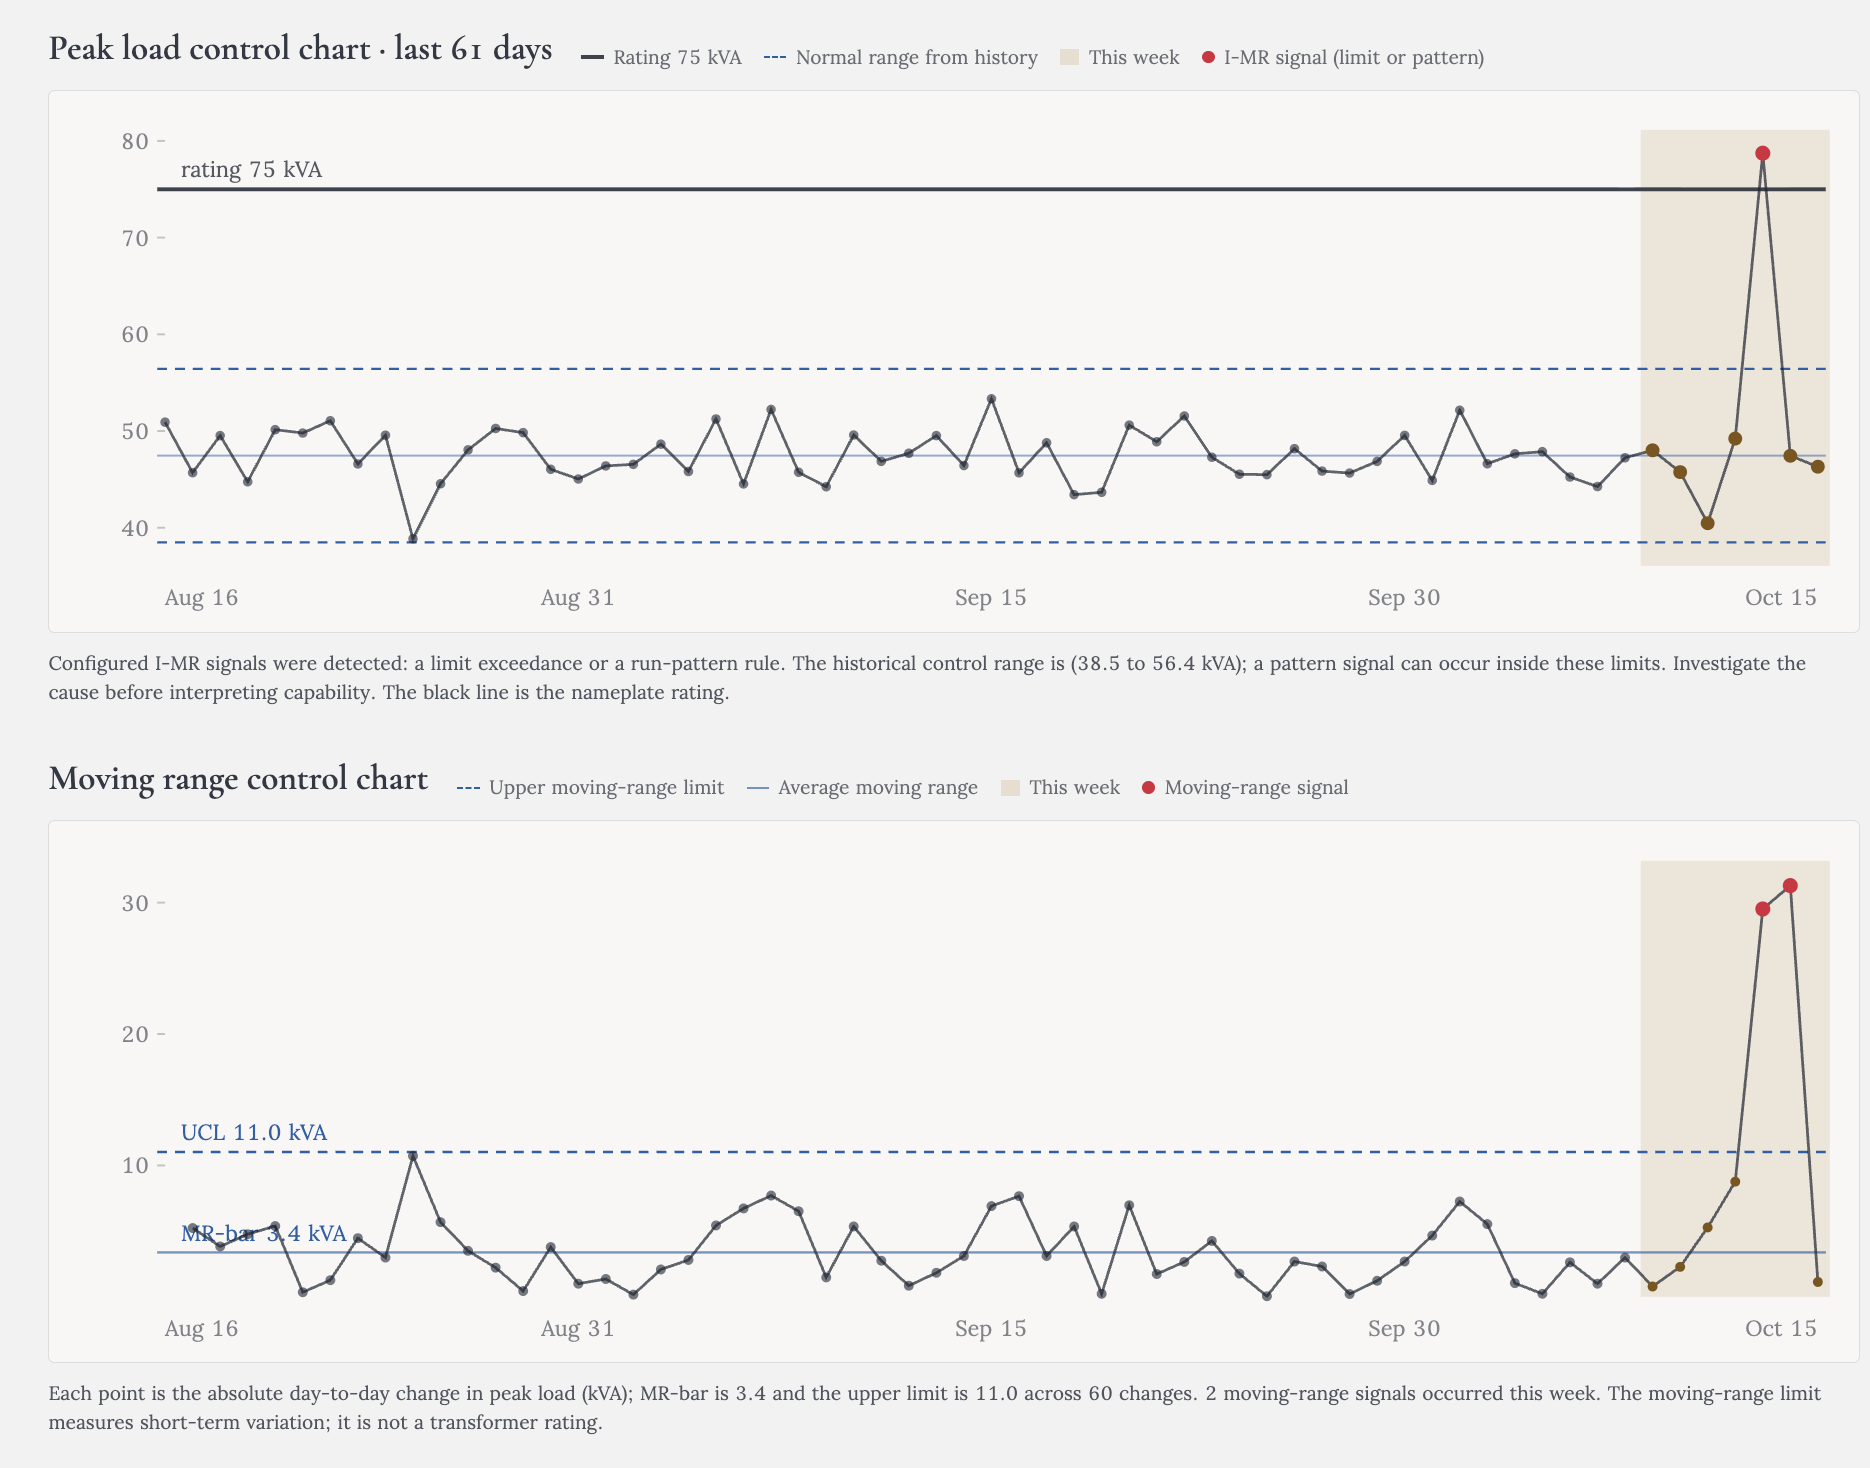
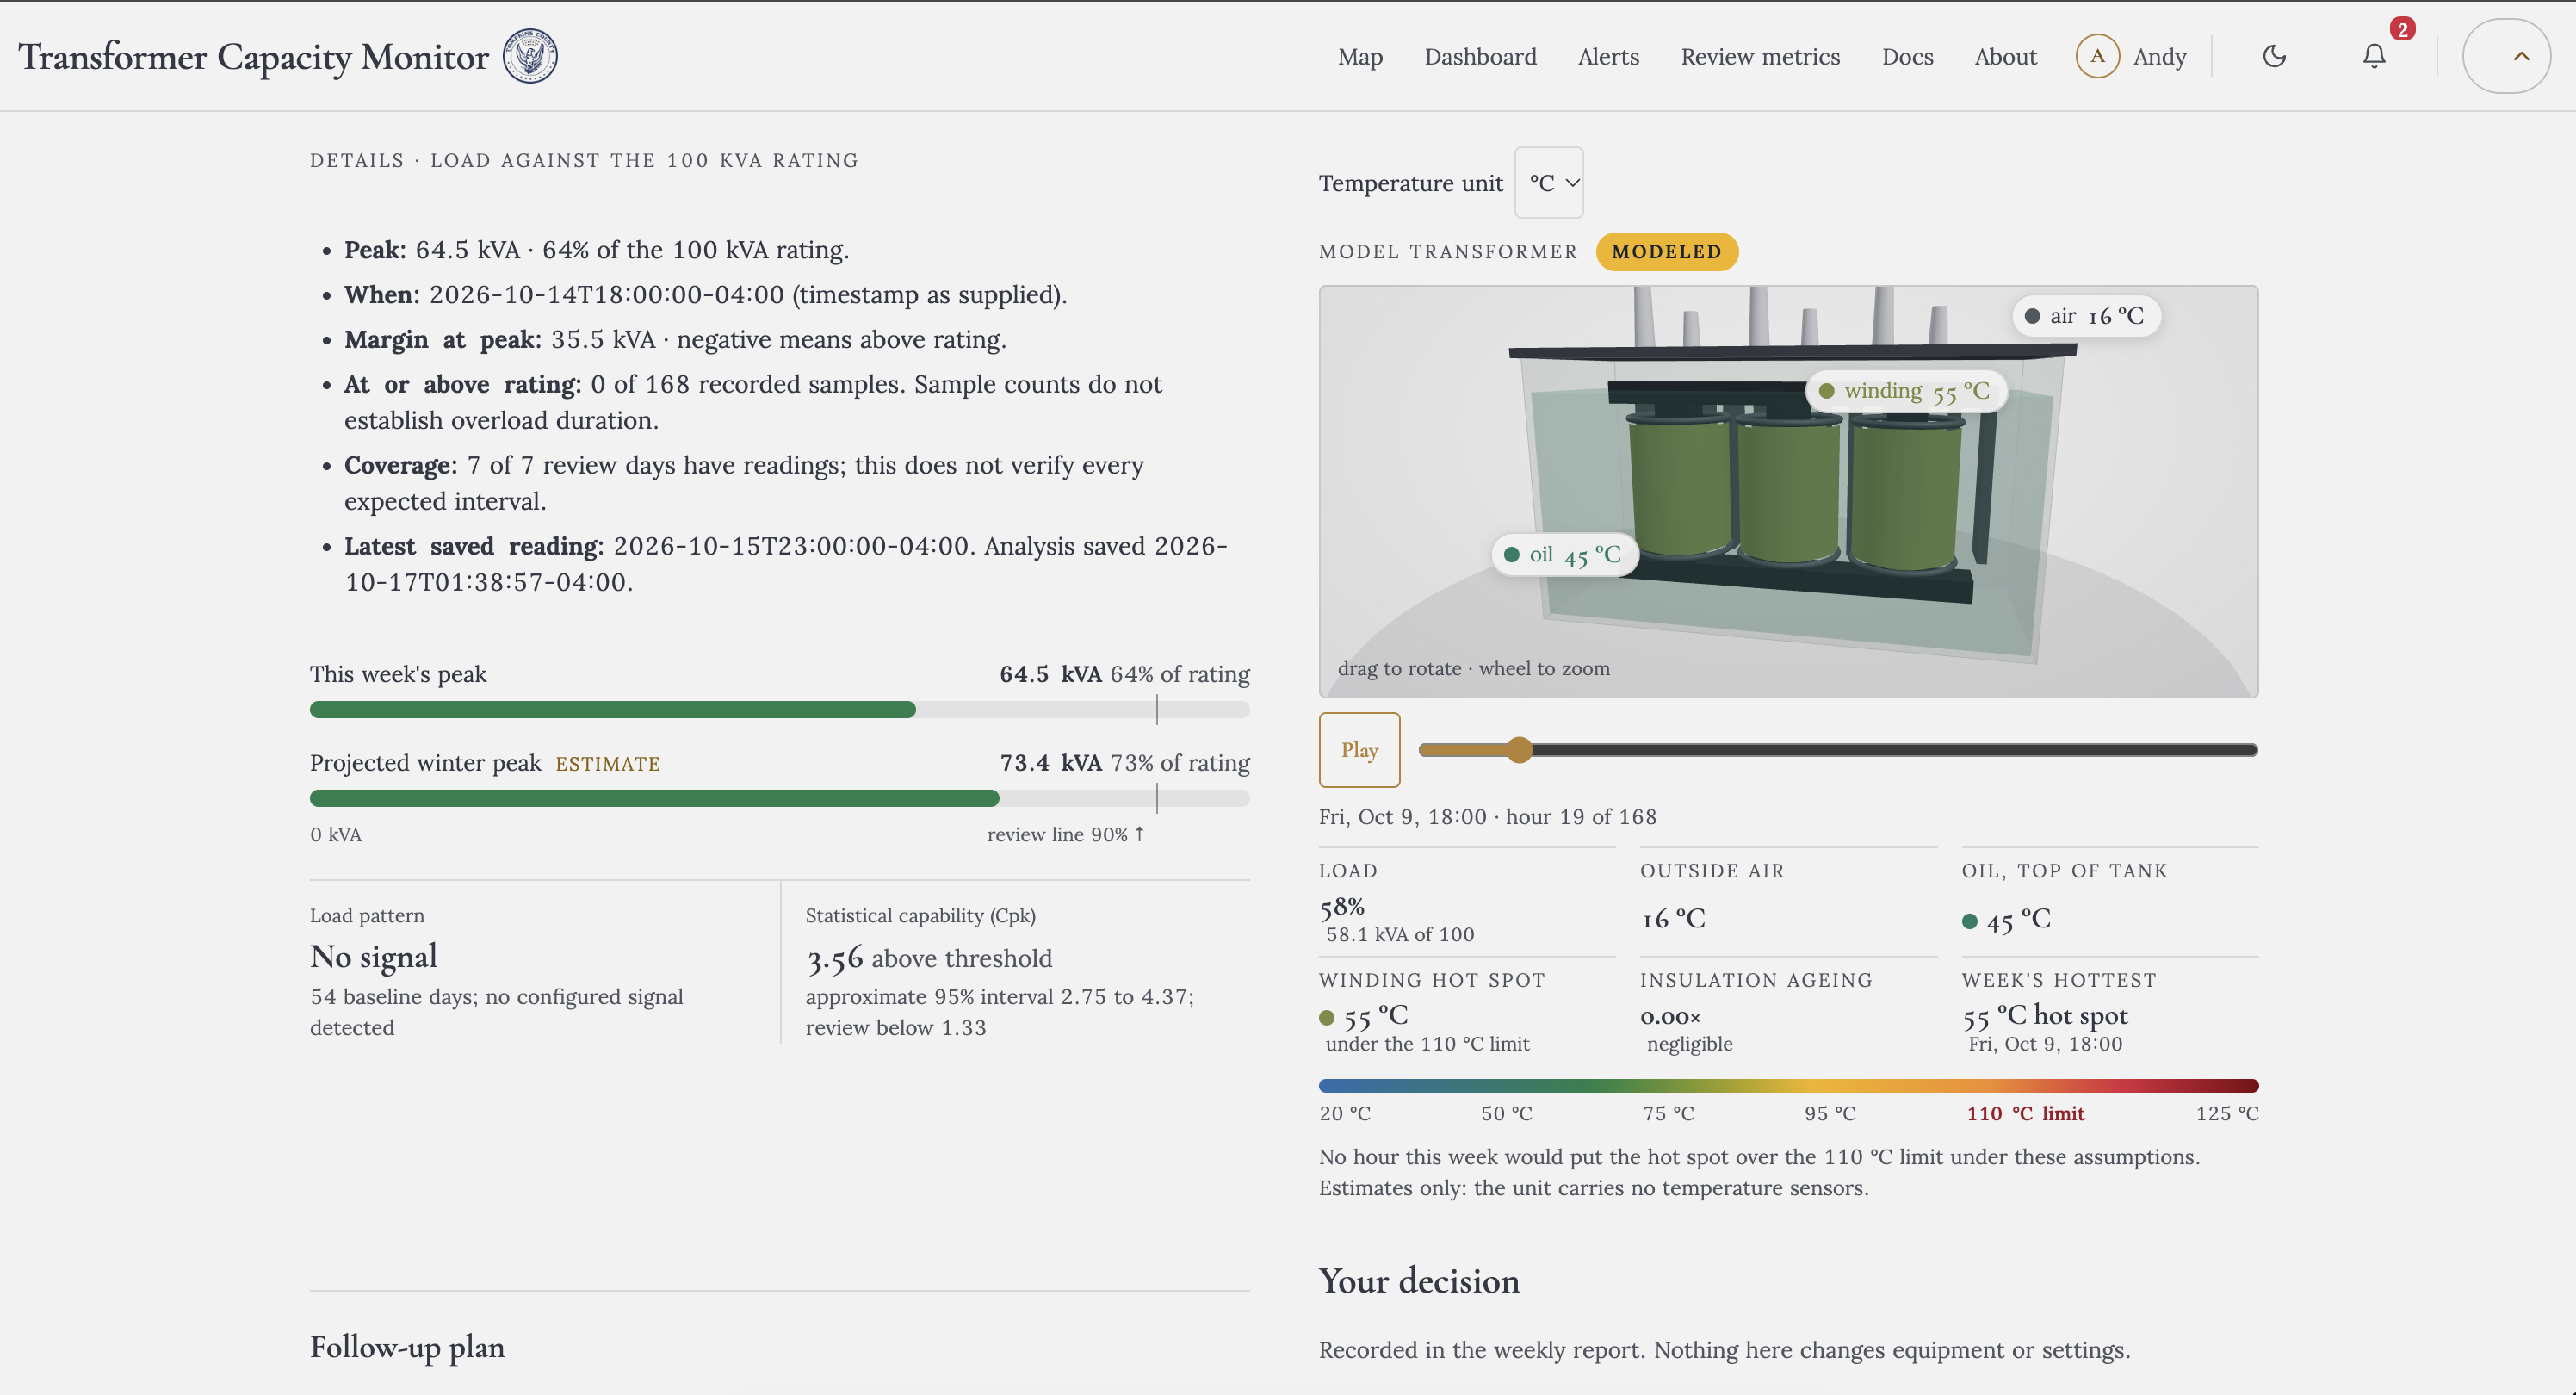
The Transformer Capacity Monitor analyzes each transformer’s daily peak load against its nameplate rating. It uses an Individuals and Moving Range control chart to flag unusual patterns, estimates one-sided capacity headroom when the data support it, and applies an area-level heat-pump growth scenario.
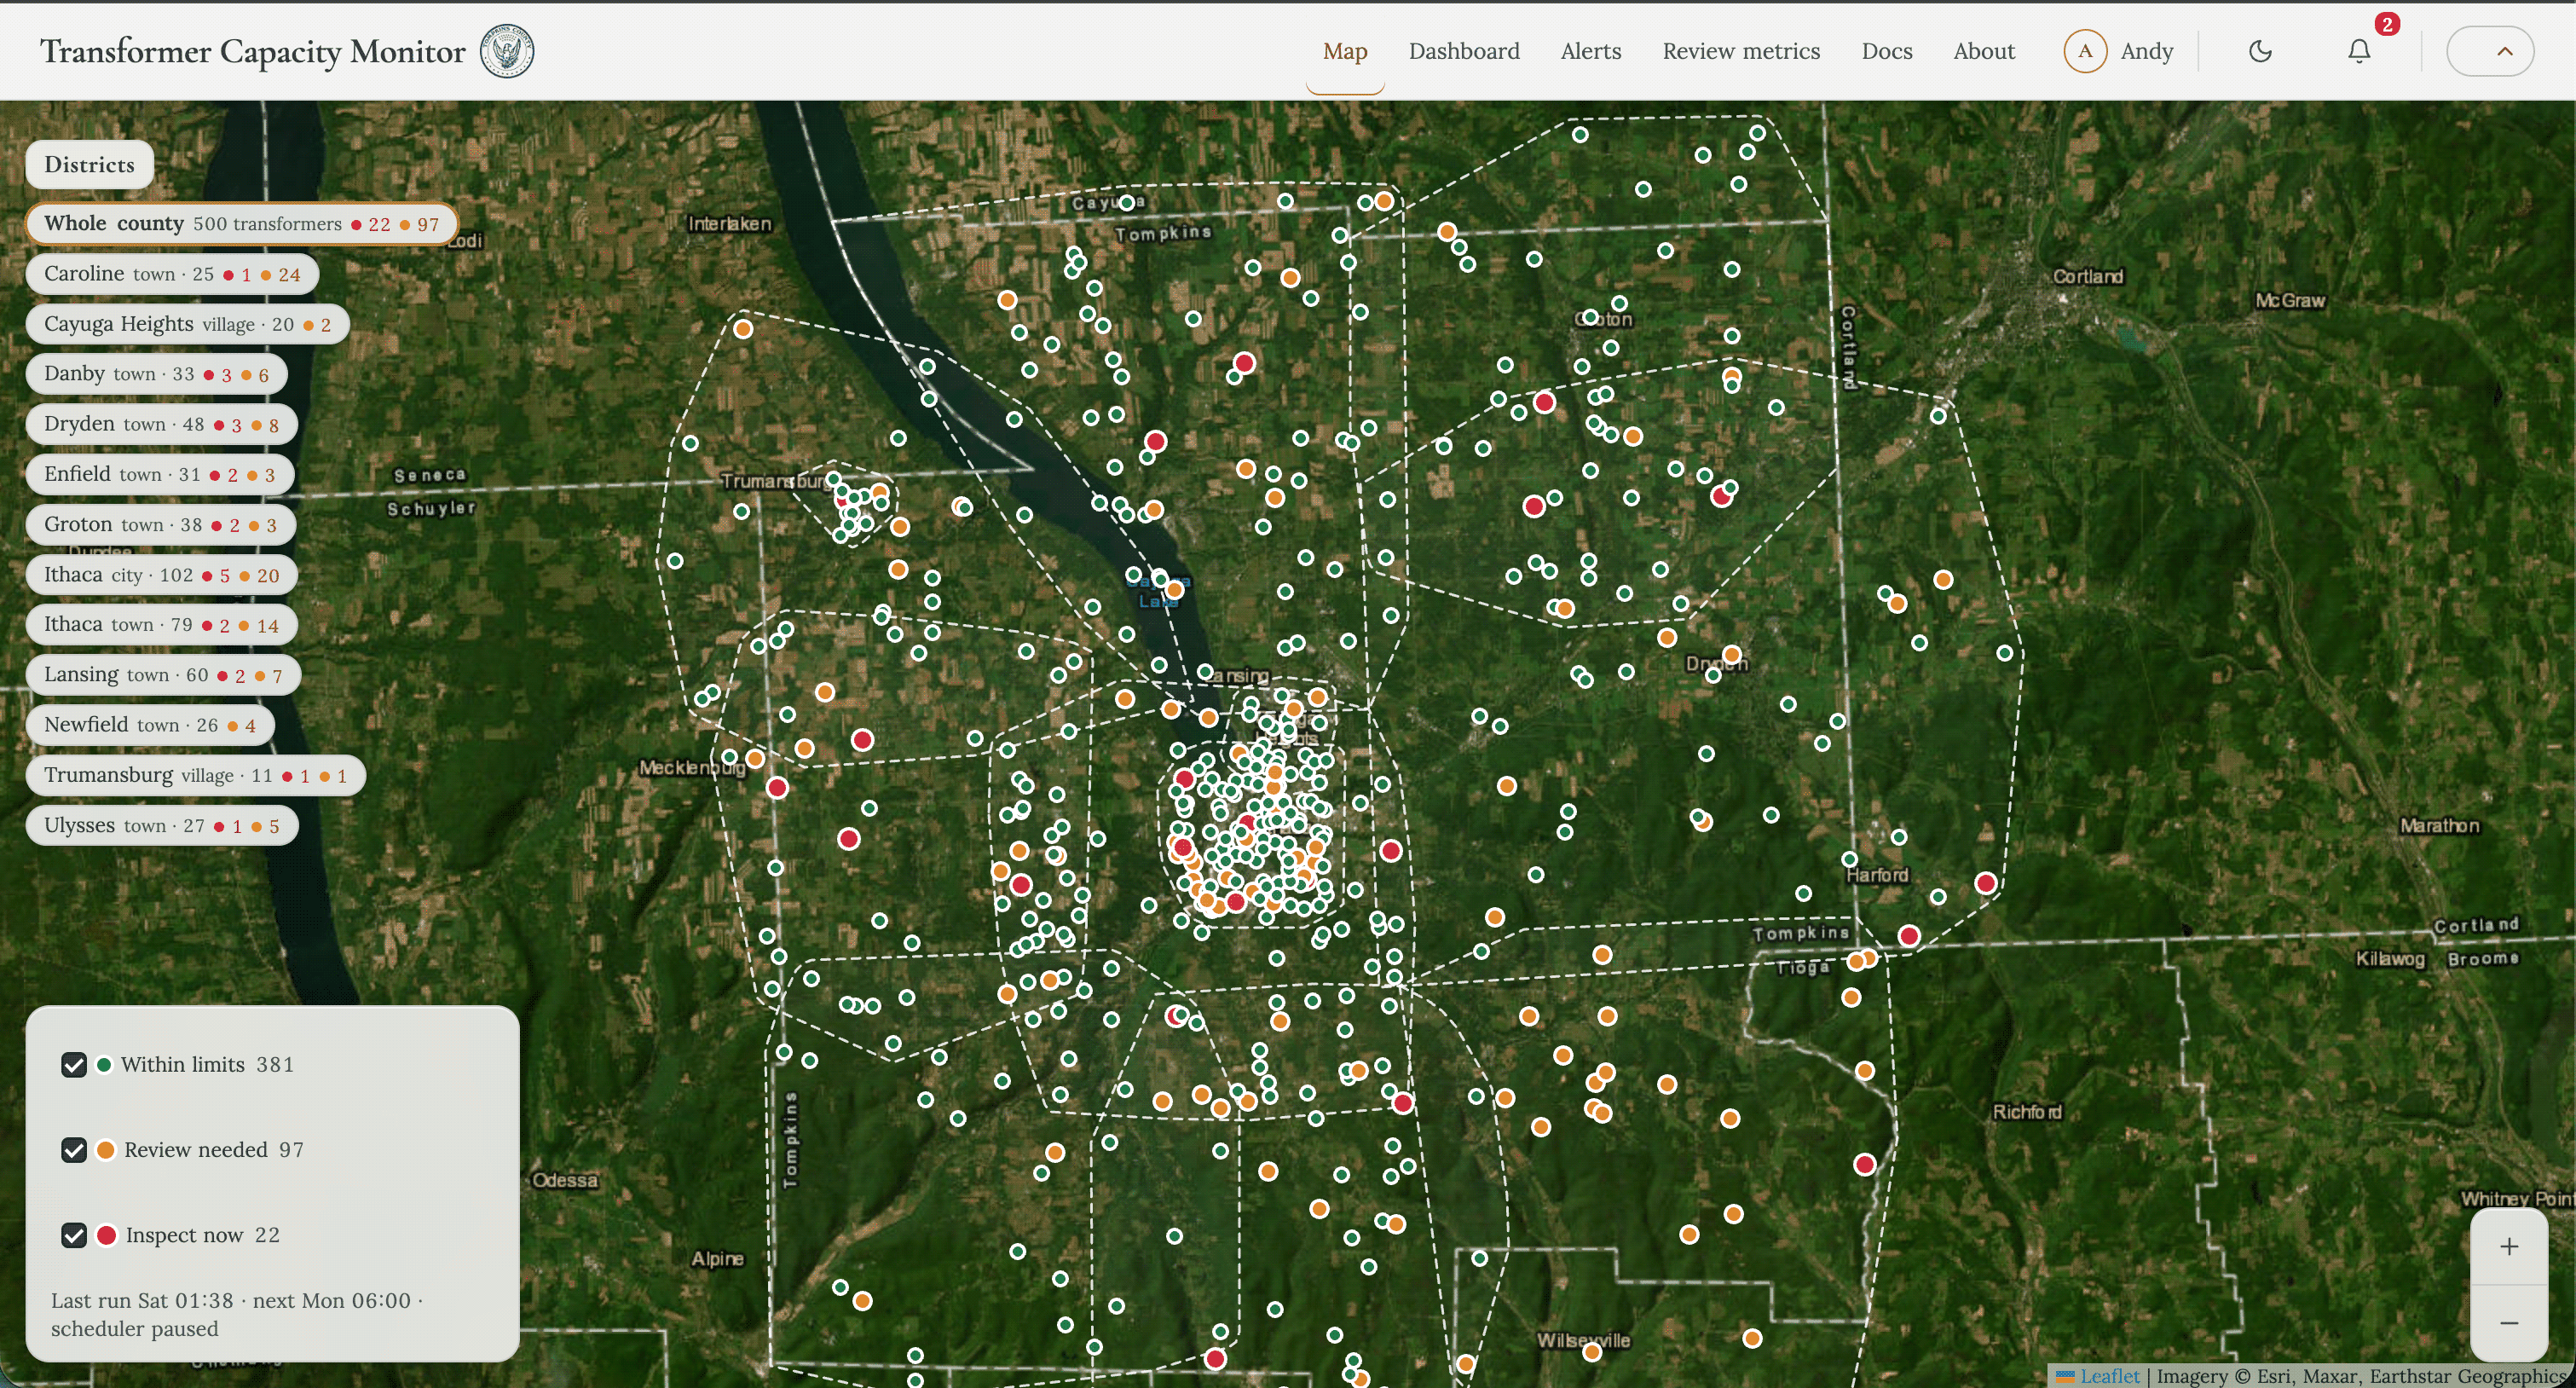
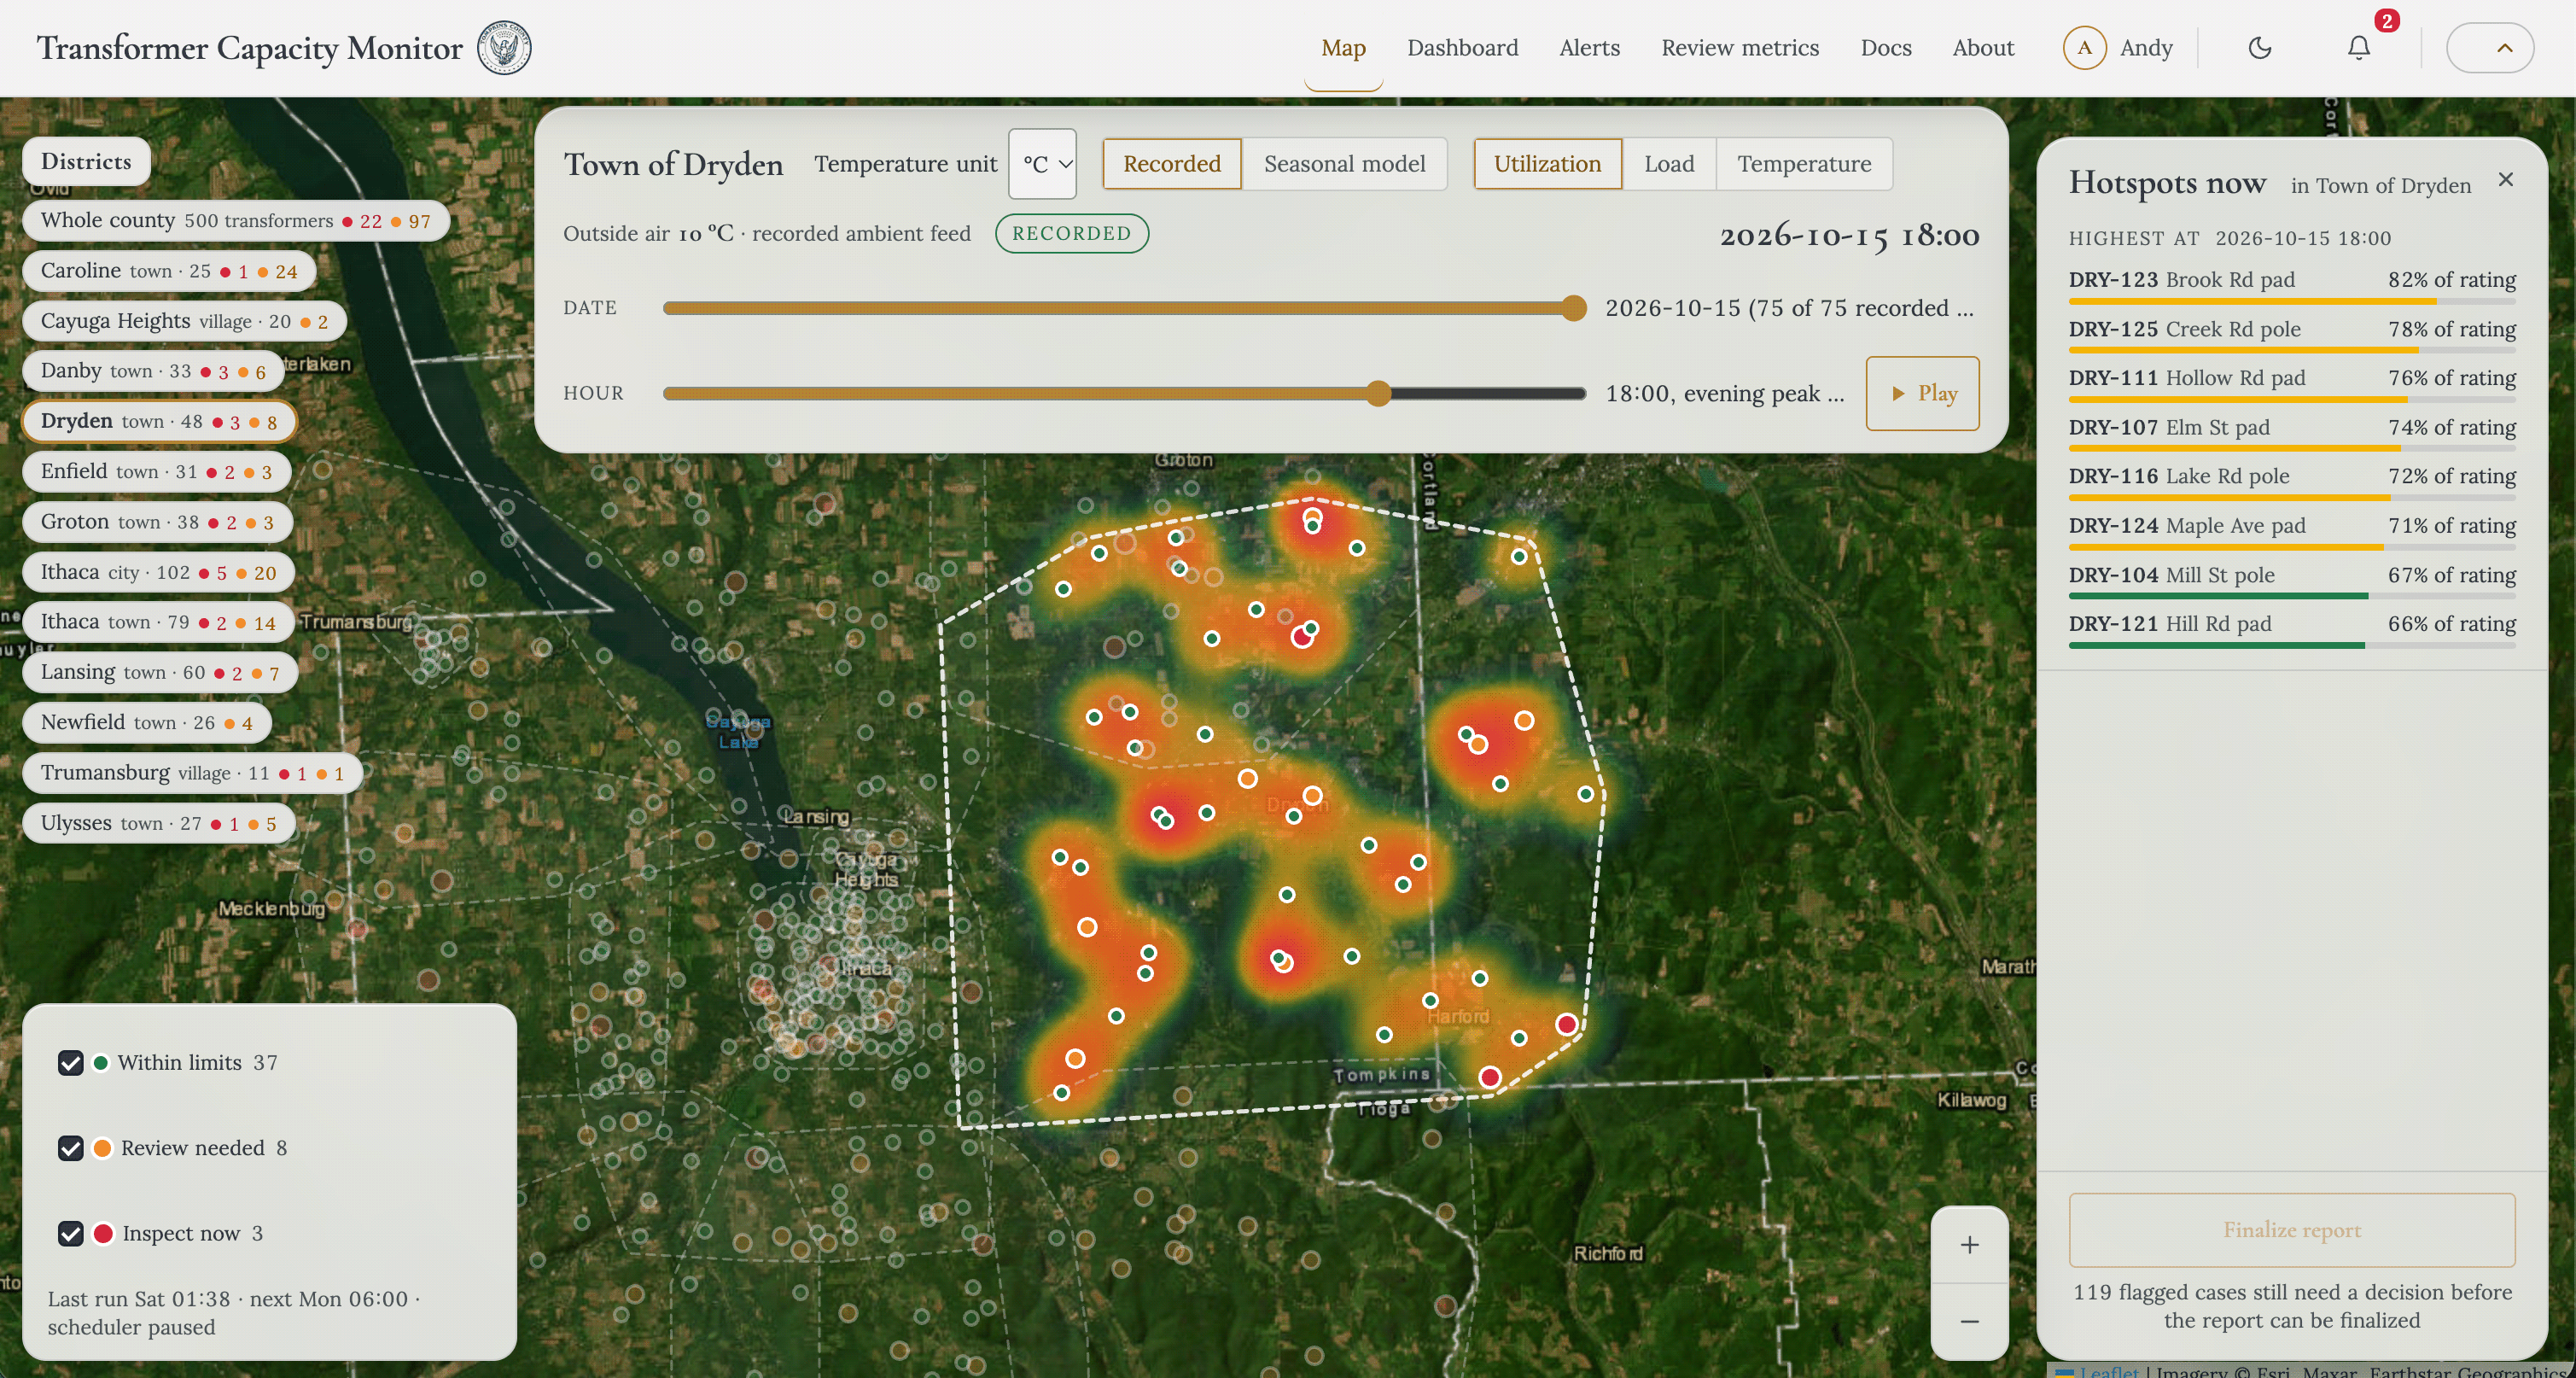
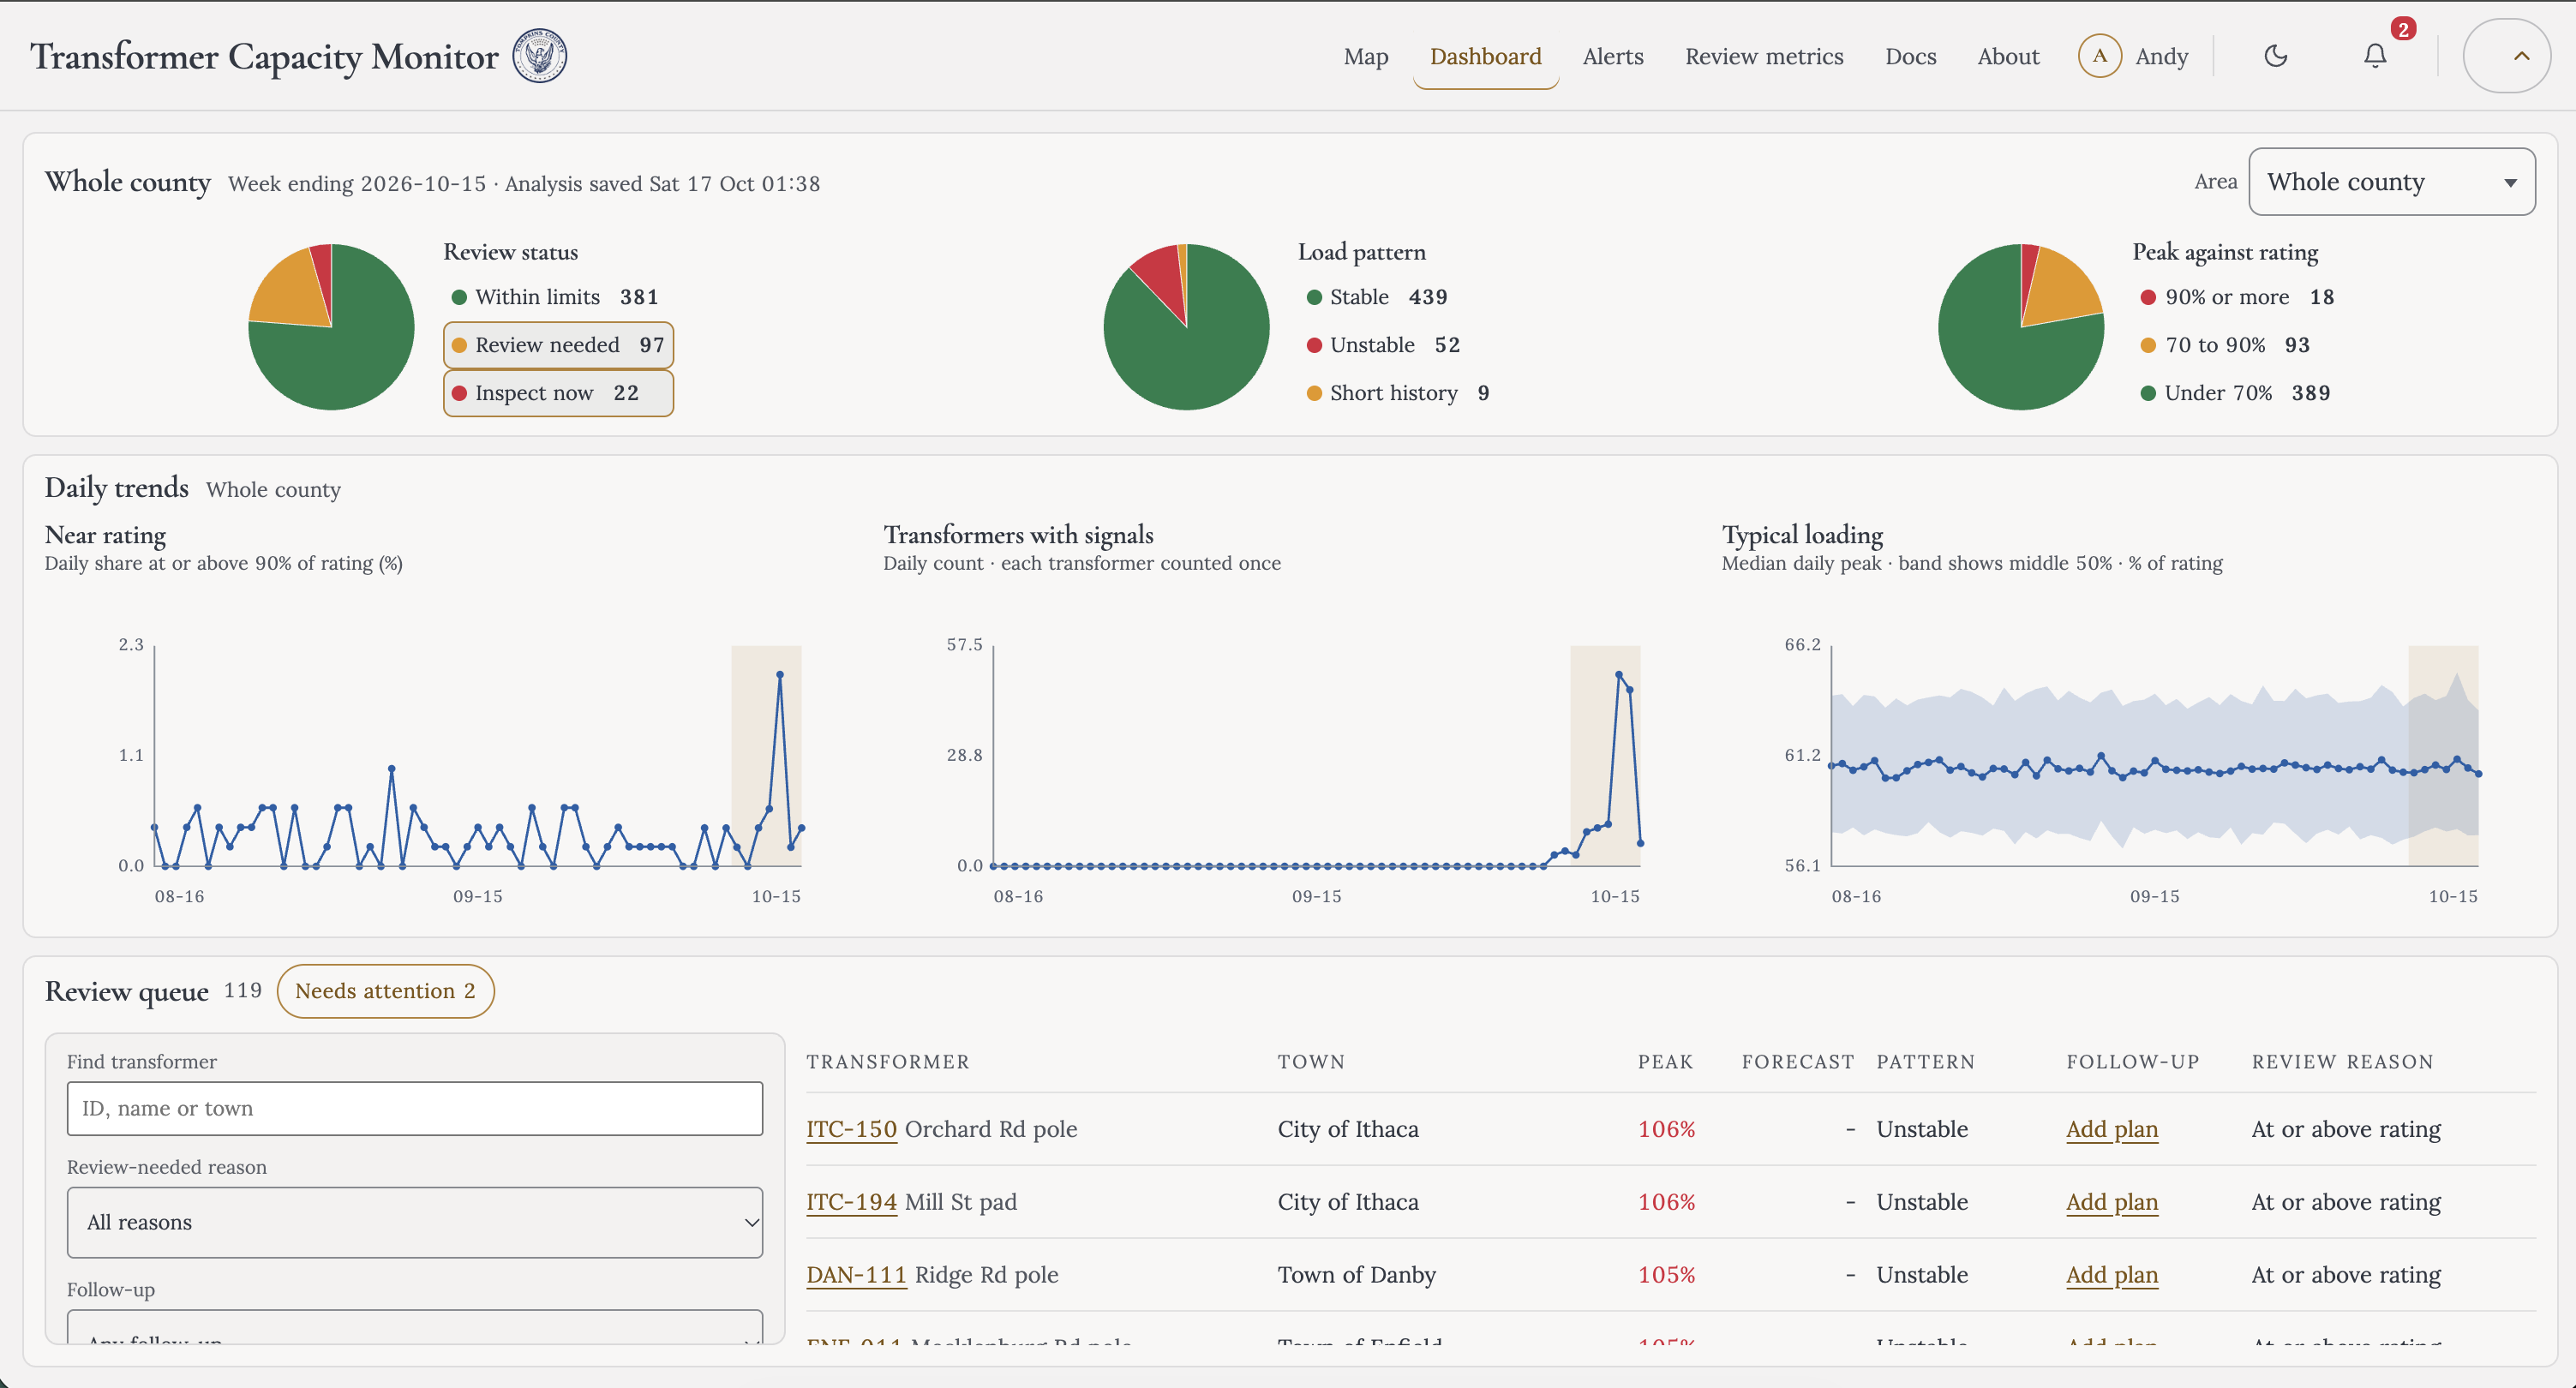
A map and dashboard help planners find cases to review. Each transformer page presents the evidence and supports a human decision. The tool prioritizes engineering review; it does not predict equipment failure or issue operating commands. All transformer readings, asset records, and forecasts in the demo are synthetic.
How we built it
We wrote the statistical calculations as Python functions, separate from the Flask interface, so they could be tested independently. We connected those results to the map, dashboard, transformer review pages, and reporting workflow.
We also documented the required inputs, units, assumptions, formulas, and synthetic datasets. Tests include hand-checkable calculations, edge cases, and generated scenarios.
Challenges we ran into
A central challenge was making statistical results useful without implying more certainty than the data support. Daily peaks can vary with weather and time patterns, readings can be incomplete, and capability estimates depend on assumptions about process stability and observations.
We also had to decide which information belongs in a county-wide dashboard and which belongs on an individual transformer page. We kept county summaries descriptive and reserved control-chart signals for individual transformers.
Accomplishments that we're proud of
We built a working end-to-end prototype: it processes input feeds, identifies cases for review, presents evidence on a map and dashboard, and supports a documented review workflow.
We’re also proud that the analysis is testable outside the web app and that the demo clearly labels its data as synthetic. The interface distinguishes a nameplate-rating exceedance from a prediction of failure.
What we learned
A polished chart is not enough: its assumptions, data coverage, and intended interpretation need to be clear. We learned to keep the statistical calculations independent of the interface, test them with known-answer examples, and describe where the methods need further validation.
We also learned that a useful planning tool should help a person decide what to investigate, rather than hide uncertainty behind a single score.
What's next for Transformer Capacity Monitor for Tomkins County
Next, we want to review the analysis and workflow with utility engineers, validate the thresholds and input data requirements, and strengthen checks for missing meter intervals and weather-related patterns. We’ll also verify that the app can be reproduced from a clean checkout and confirm the public deployment.
The prototype uses synthetic data and is not validated for operational utility decisions.
Built With
- apache-airflow
- built-with:-python
- css
- flask
- geojson
- github
- html
- javascript
- leaflet.js
- pandas
- posit
- pytest
- sqlite

Log in or sign up for Devpost to join the conversation.