-
-
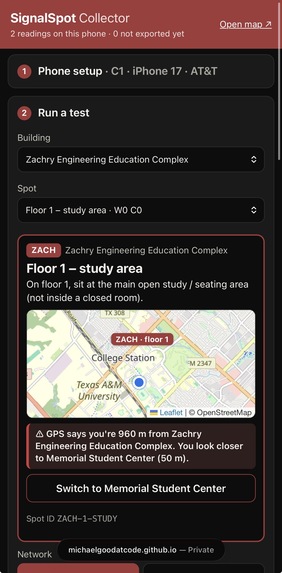
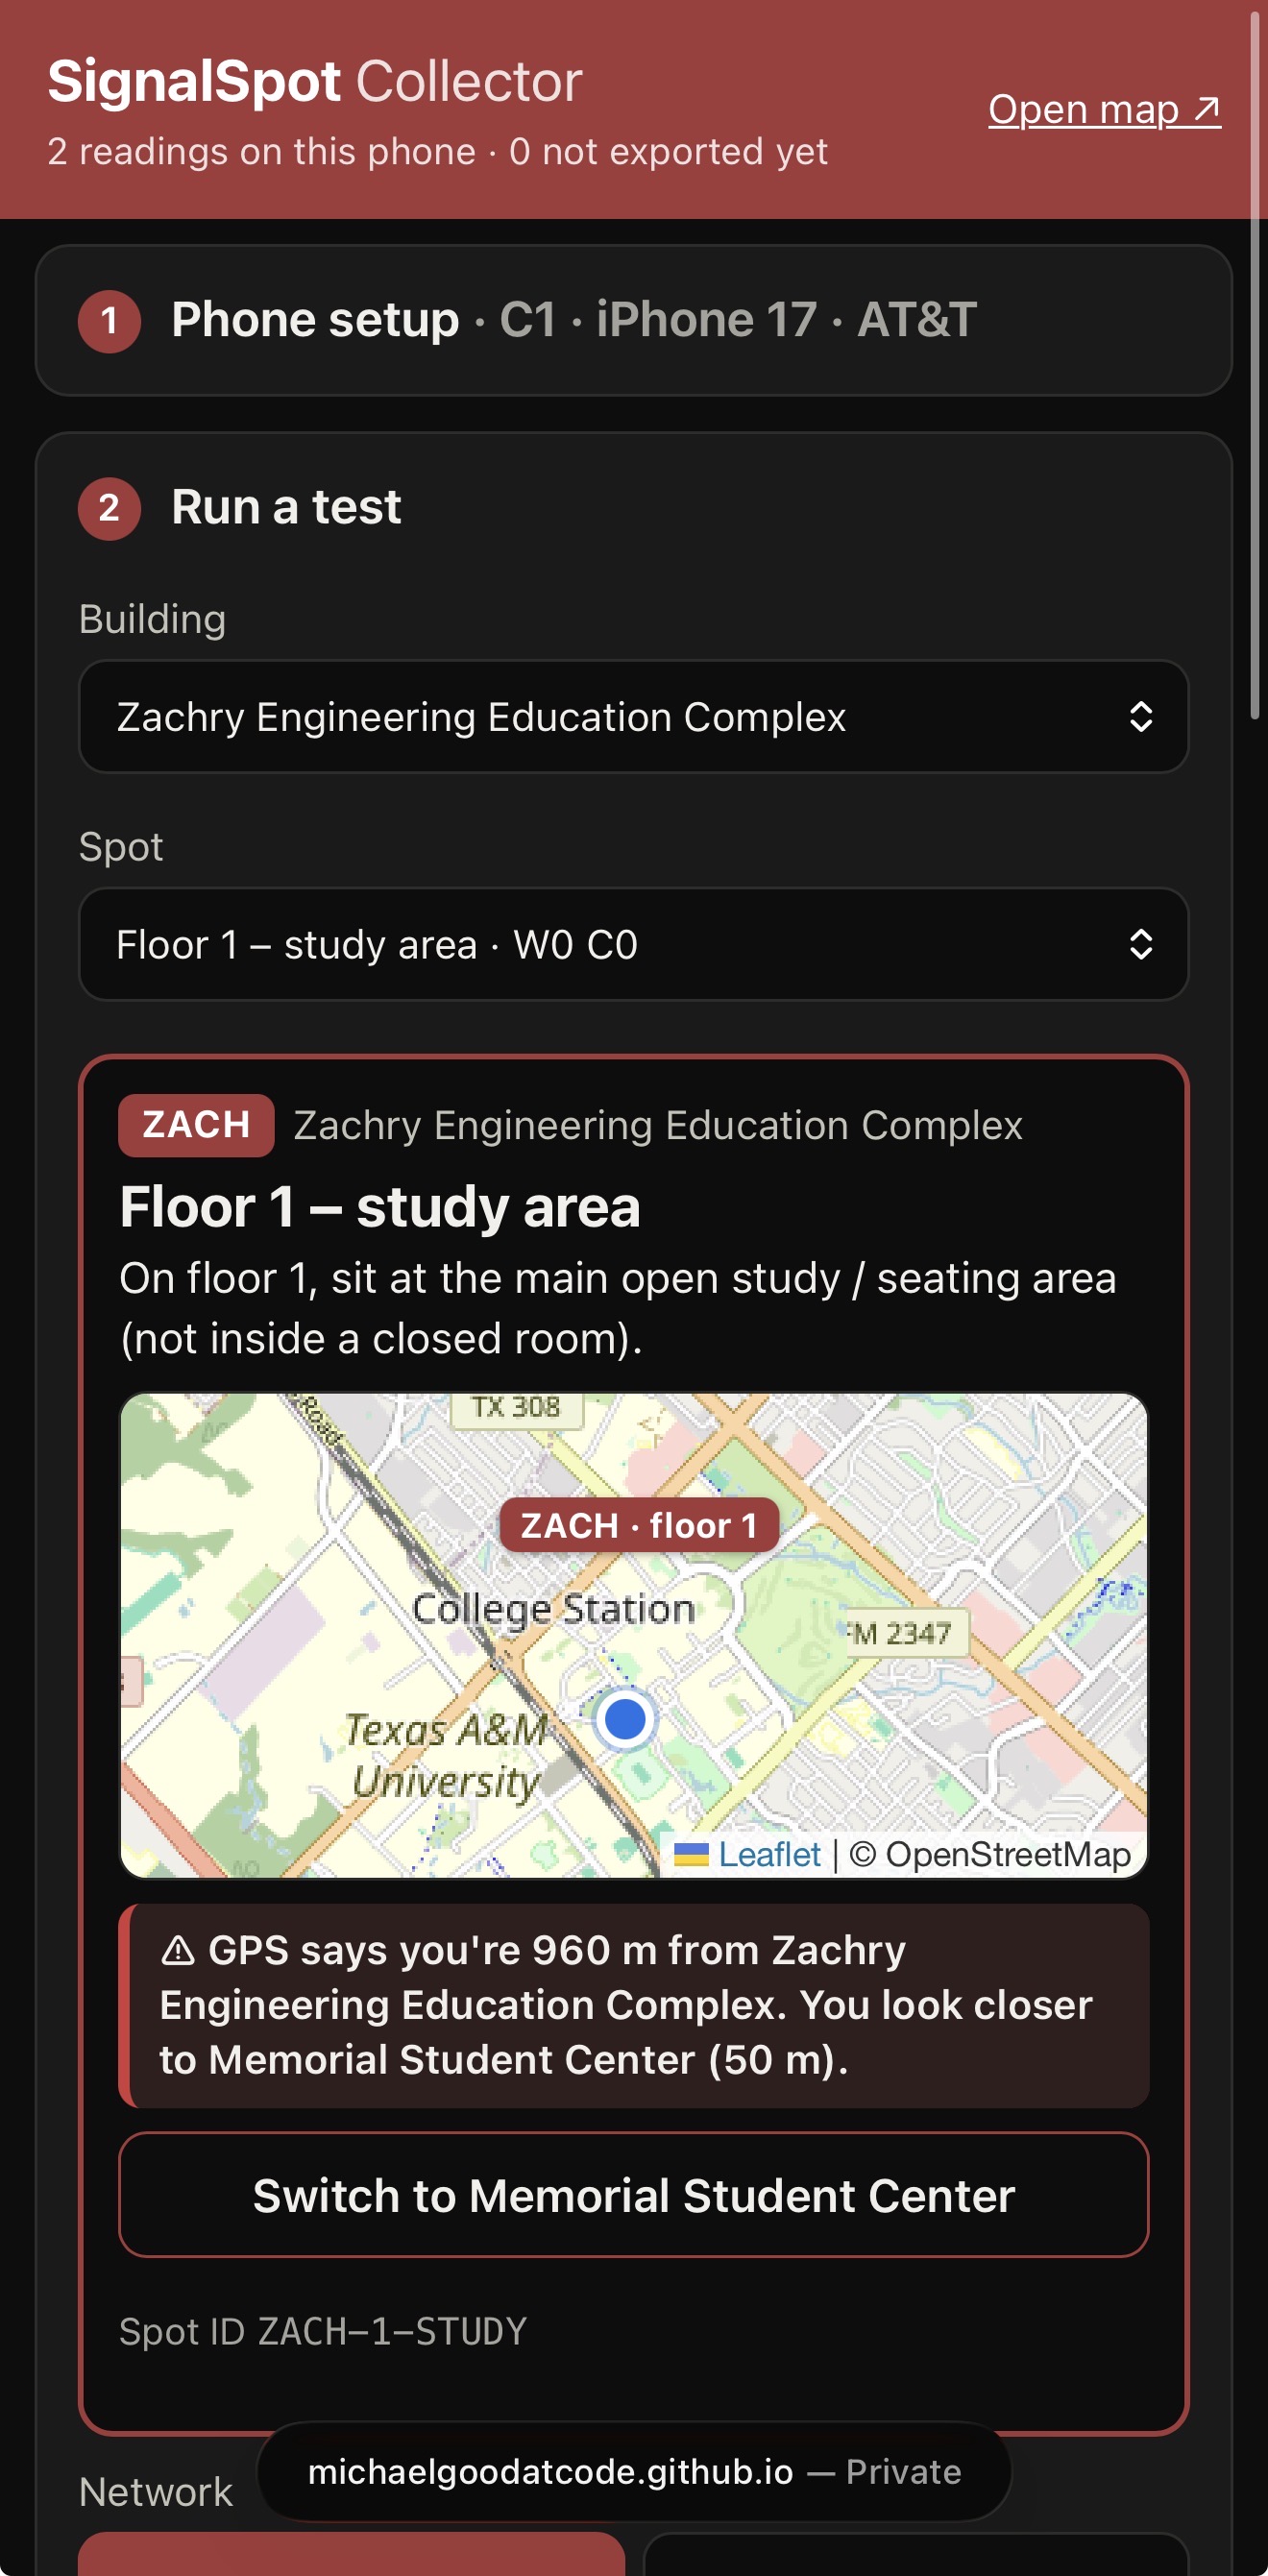
Data Collection Method - with map
-
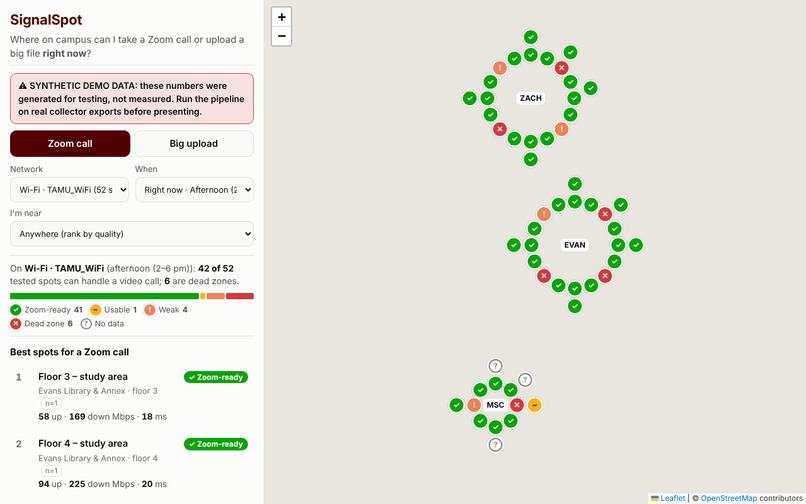
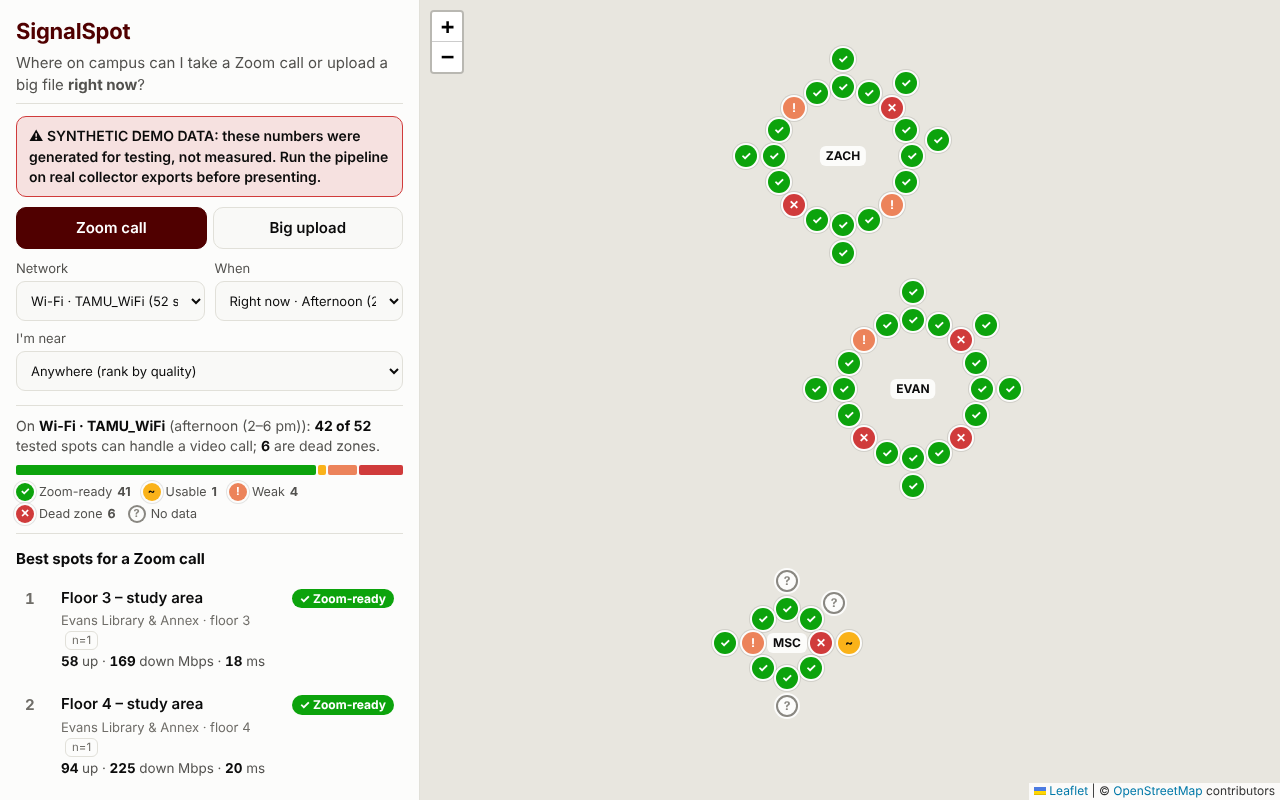
Initial Feasbility Draft Image
-
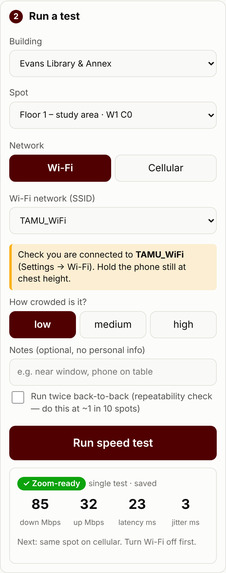
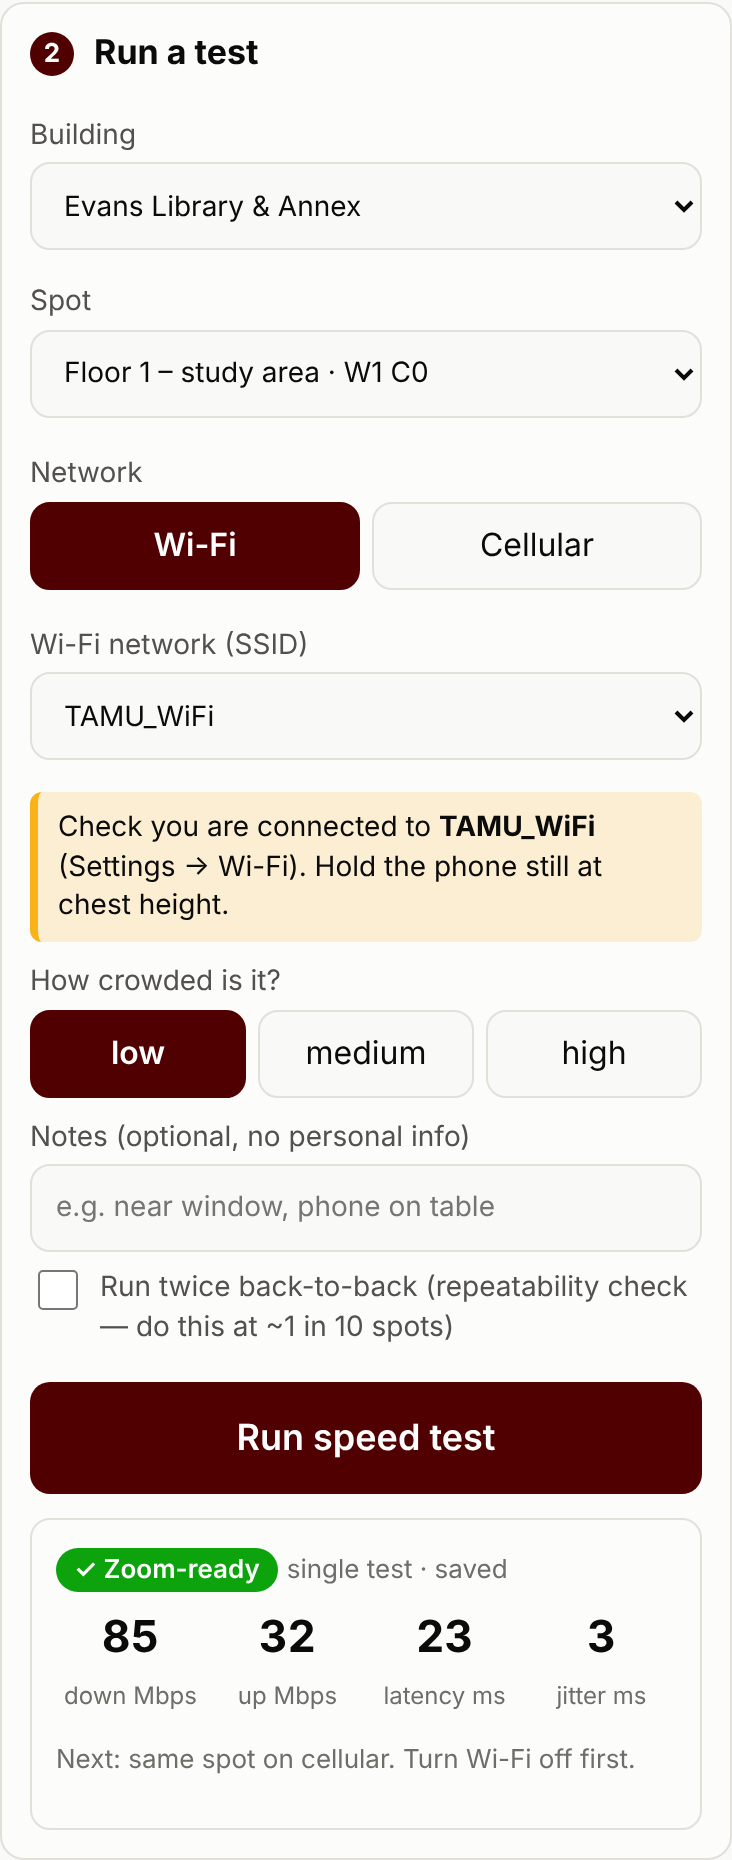
Data Collection Method - selection options
-
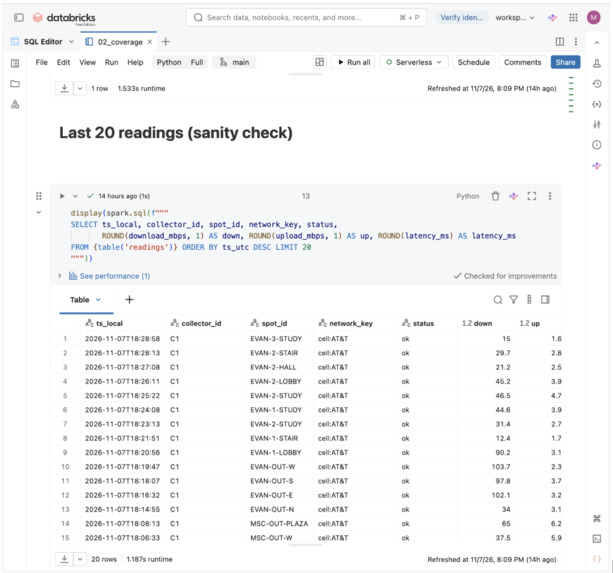
Coverage View and Results
-
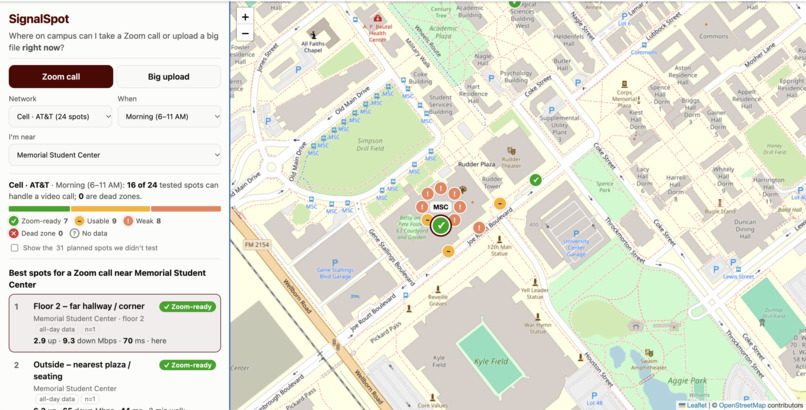
Final Dashboard view
Inspiration
Calls drop and uploads stall between classes, and nobody publishes where on campus your phone's data actually holds up. So we measured it.
What it does
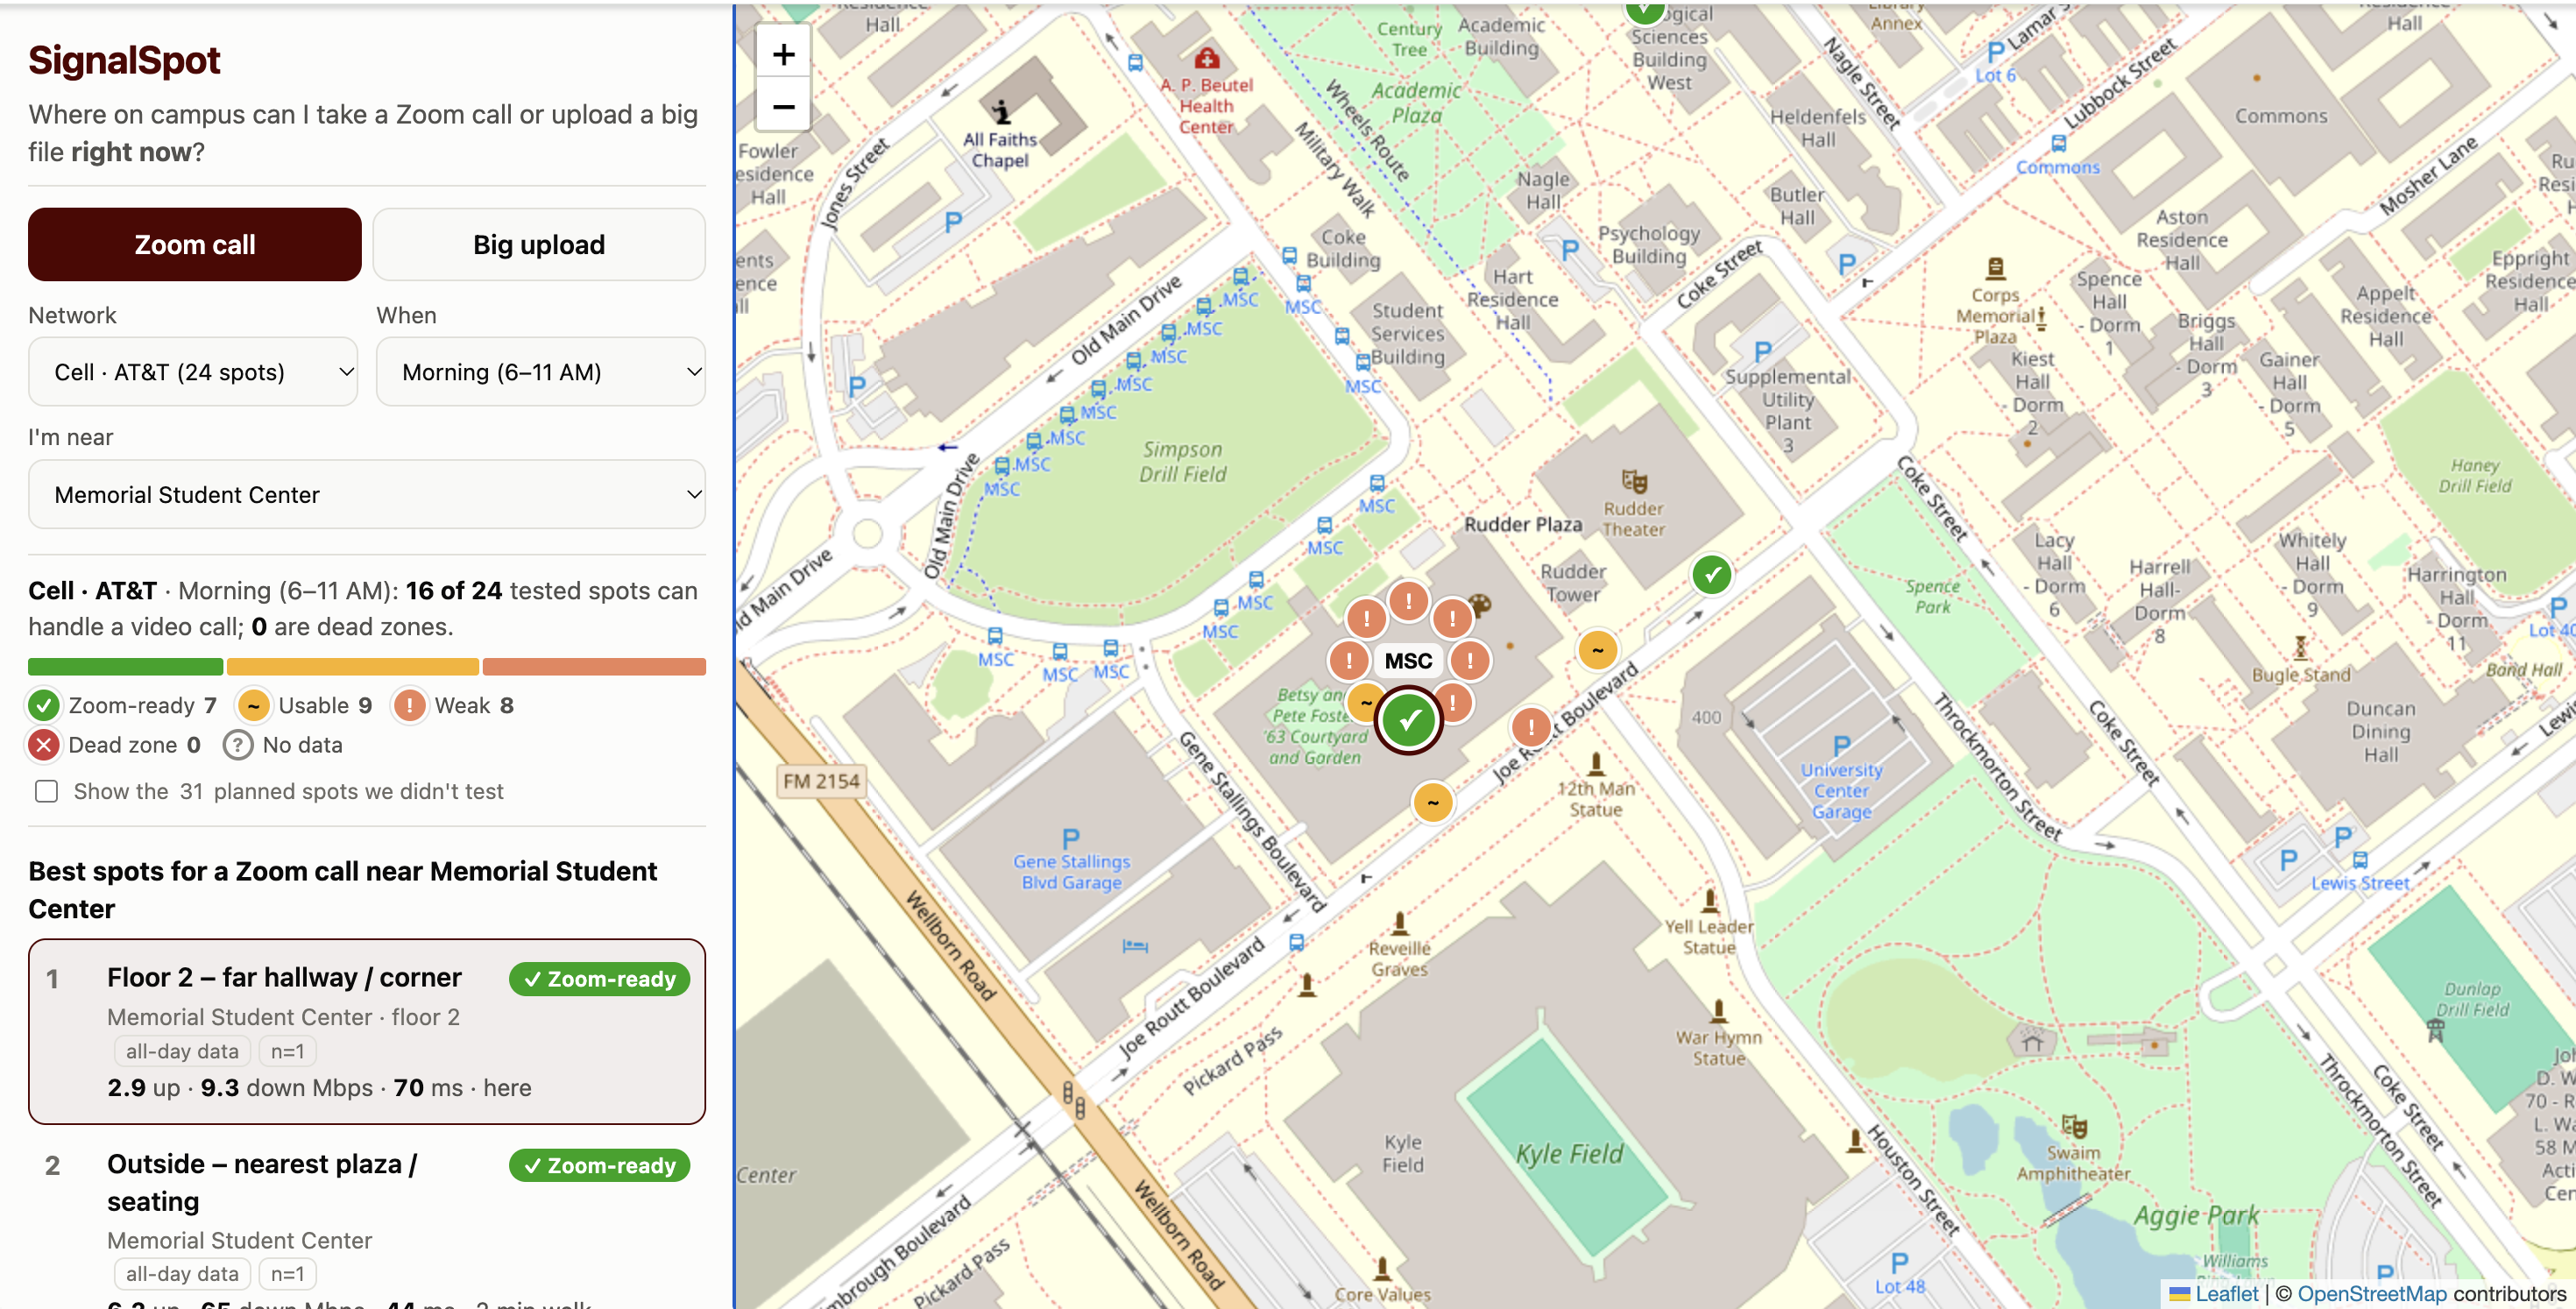
Pick Zoom call or Big upload and where you are. SignalSpot ranks spots using our own measurements, estimates how long an upload takes including the walk there, and shows the weak spots to avoid. Every number in the app comes from our dataset.
How we collected the data
We built a phone collector page that runs Cloudflare's open-source speed test and records download, upload, latency, jitter, latency under load, 5G/LTE, crowd level and GPS at each spot. A "where to stand" card shows exactly where each spot is, and a GPS check warns if the wrong building is selected. On Saturday, Nov 7 (5:36–6:28 PM) we ran 25 AT&T tests at 24 spots inside and outside the MSC and Evans Library.
How we built it
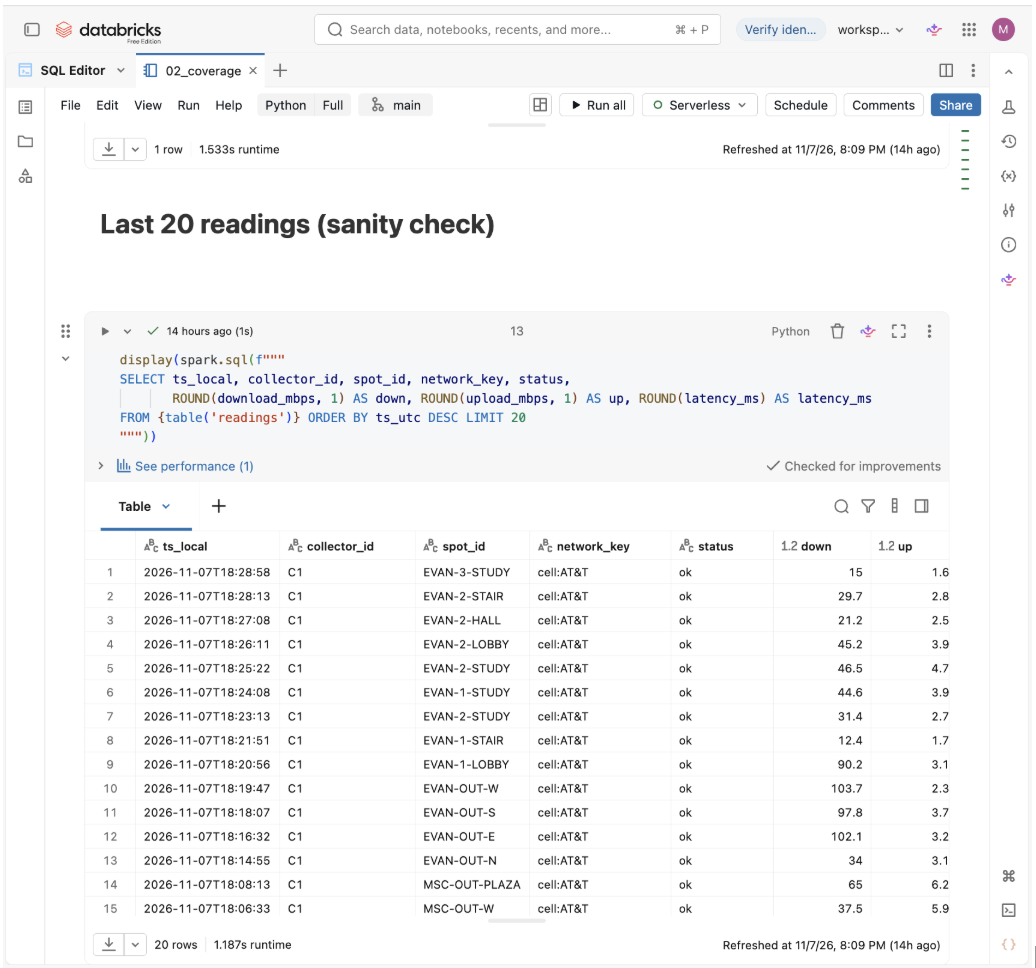
- Databricks (Free Edition): phone CSVs land in a Unity Catalog volume. A notebook pipeline removes duplicates, logs every dropped row with a reason, scores each spot against Zoom's bandwidth requirements, and writes Delta tables. SQL views tracked coverage while we collected, and a Git folder pushes the results to our repo.
- App: JavaScript + Leaflet/OpenStreetMap, hosted on GitHub Pages at signalspot.us.
- Verification: we recomputed every result with independent code and it matched. The same pipeline also runs locally without Databricks.
What we found
- Video-call readiness: 11 of 12 Evans spots (about 92%) can handle a video call, but only 5 of 12 at the MSC (about 42%).
- Upload speed: median upload inside the MSC was 0.48 Mbps; on the MSC plaza it was 6.2 Mbps, roughly 13× faster. A 2 GB upload goes from about 9 hours to about 43 minutes:
$$ t = \frac{\text{file size}}{\text{upload speed}} $$
$$ t_{\text{inside}} = \frac{2\ \text{GB} \times 8000\ \tfrac{\text{Mb}}{\text{GB}}}{0.48\ \text{Mbps}} = \frac{16{,}000\ \text{Mb}}{0.48\ \text{Mbps}} \approx 33{,}300\ \text{s} \approx 9.3\ \text{h} $$
$$ t_{\text{plaza}} = \frac{16{,}000\ \text{Mb}}{6.2\ \text{Mbps}} \approx 2{,}580\ \text{s} \approx 43\ \text{min} $$
- Latency under load: latency while uploading peaked at 2.3 s (2,300 ms) in an Evans stairwell.
Challenges
- Our first 3 readings were saved under the wrong building. That's why we added the GPS check, and the pipeline now drops readings like these automatically.
- Inside the MSC, several uploads couldn't finish within the 75-second test limit. We kept them as partial readings, because "the upload never finished" is exactly what a student needs to know.
Limitations and what's next
This is one evening, one carrier (AT&T), one phone and one test per spot, so treat it as a snapshot. The collector already supports campus Wi-Fi and other carriers; next we'd add those, repeat tests at different times, and cover Zachry.
We used Claude (an AI assistant) to help write parts of code and documentation. All data was collected by us on foot.
Built With
- cloudflare
- databricks
- delta-lake
- github
- javascript
- leaflet.js
- openstreetmap
- pandas
- python
