-
-
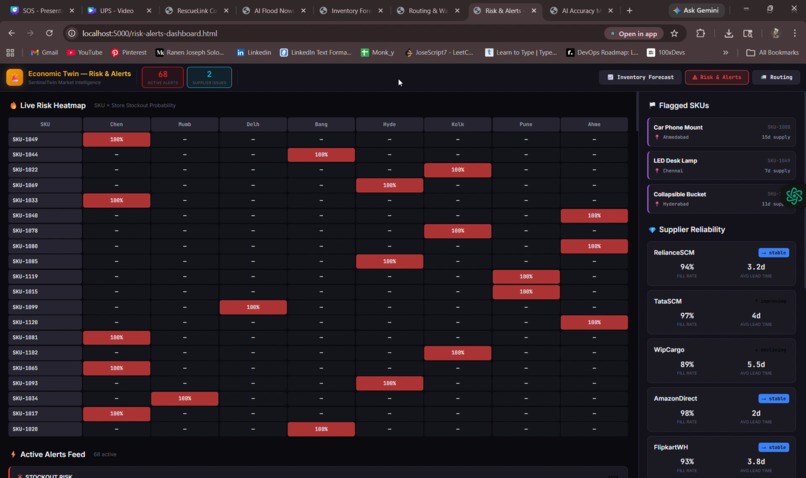
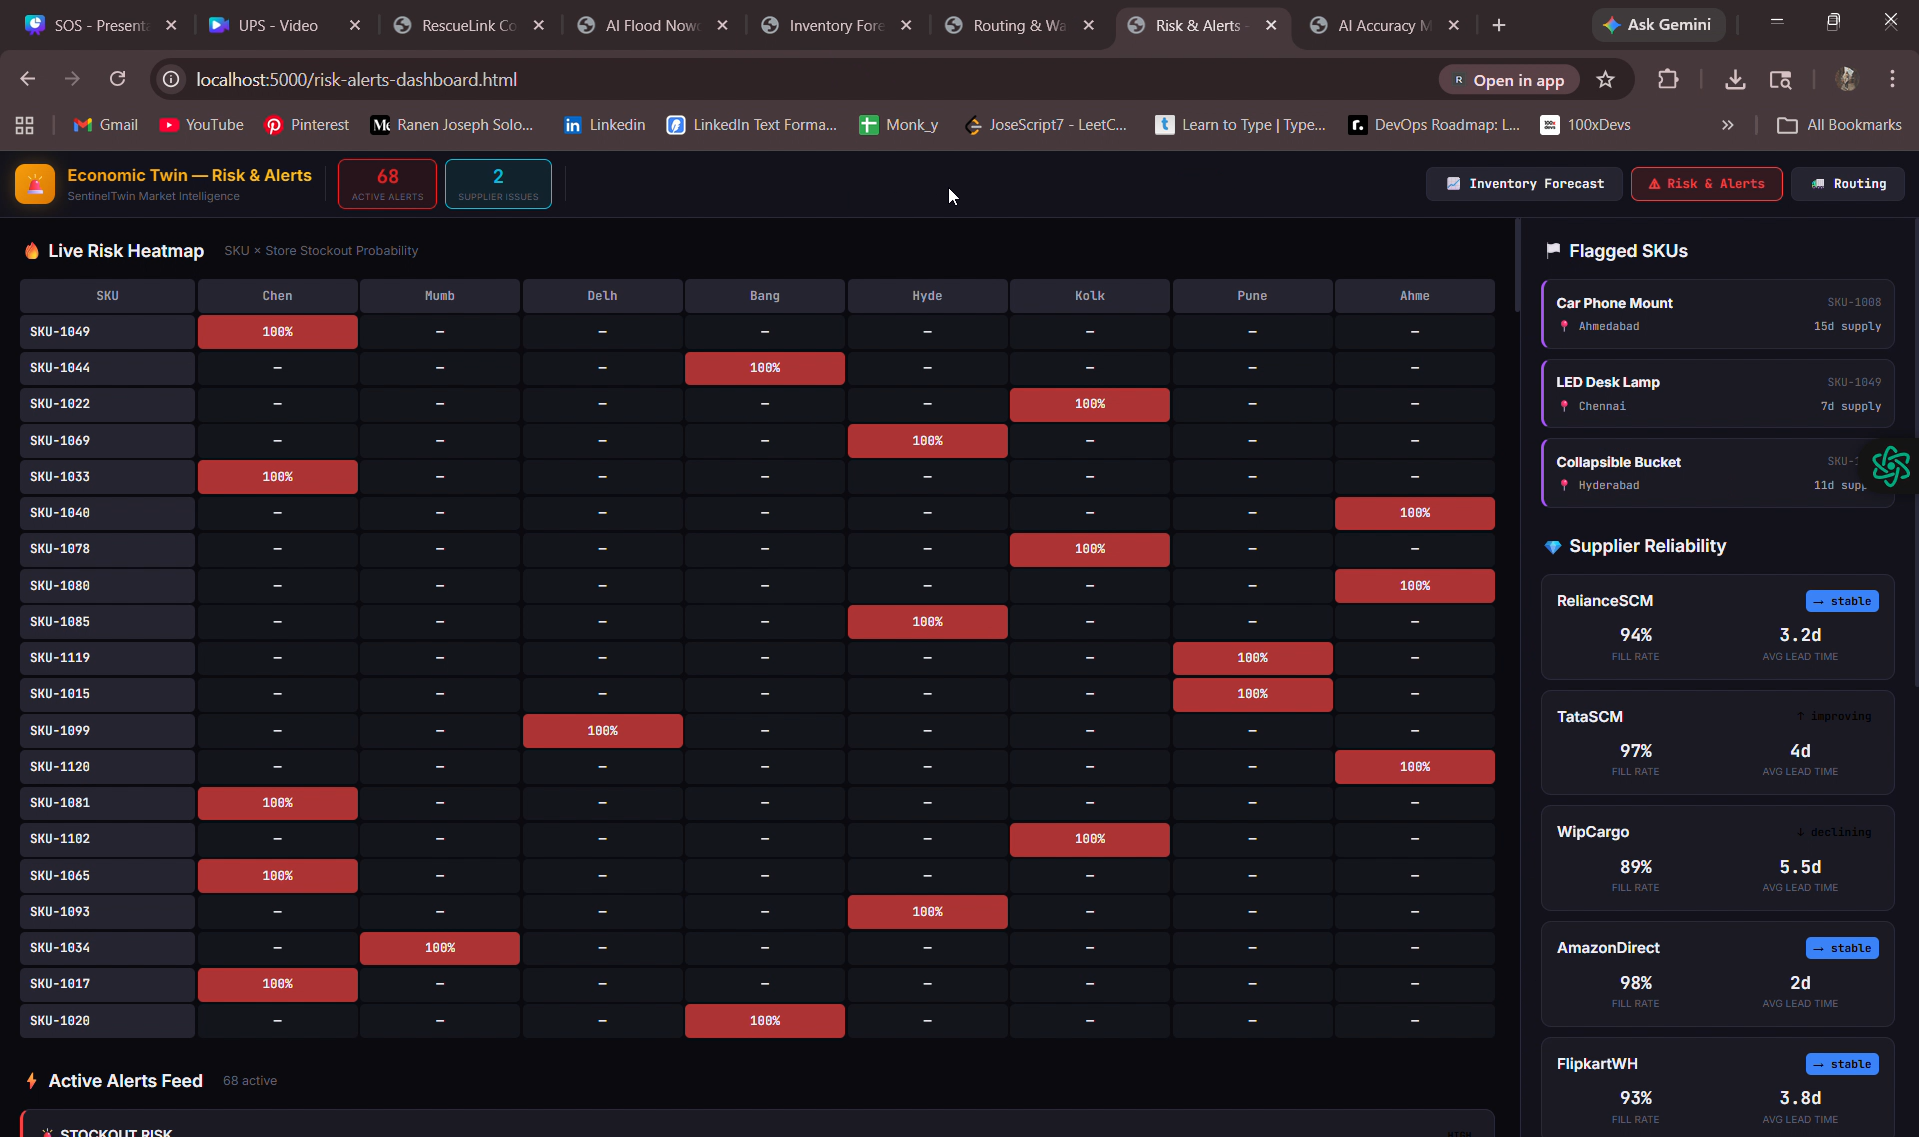
LiveHeatmapDashboard
-
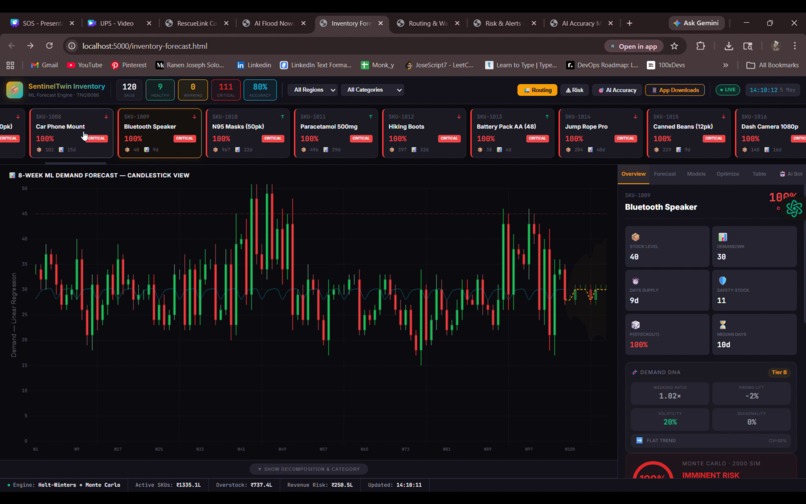
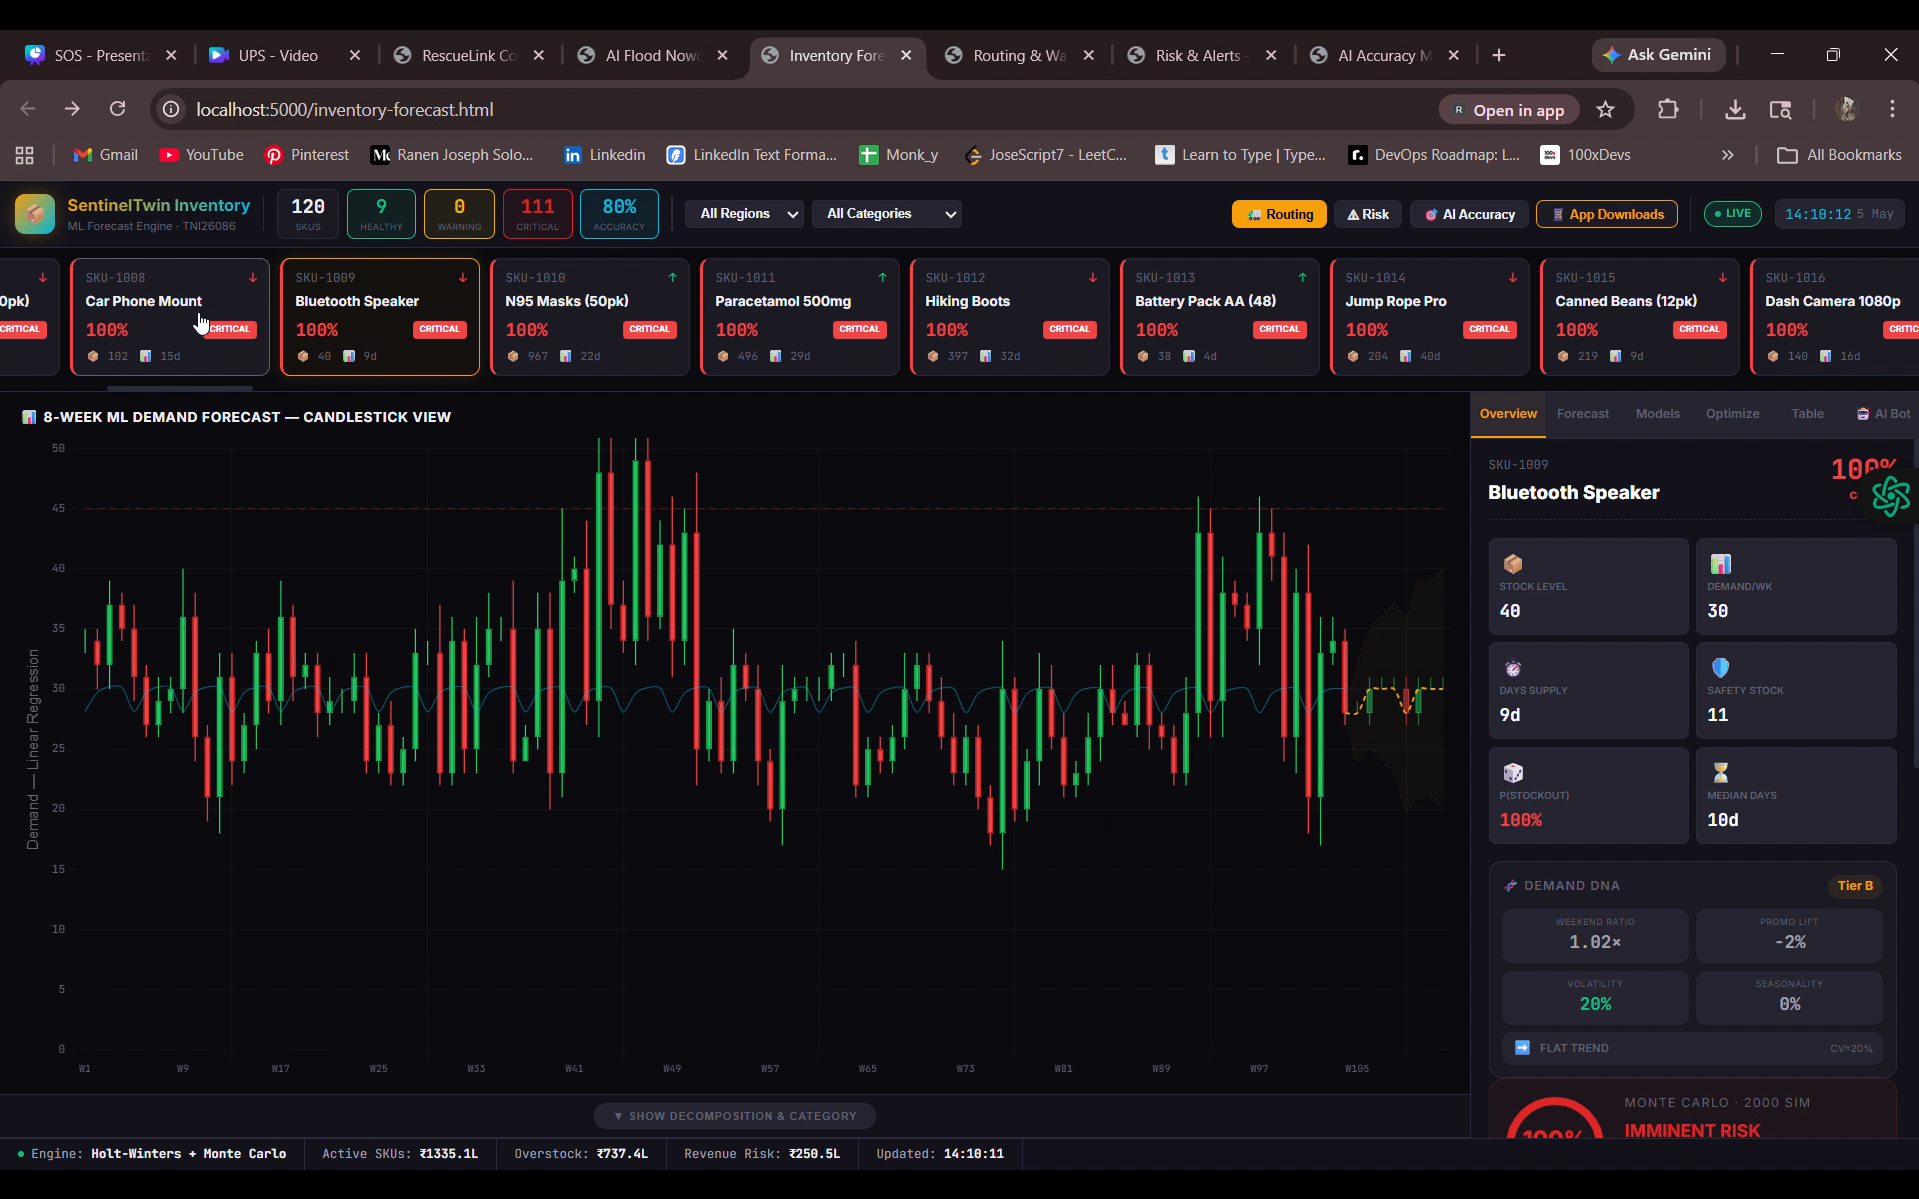
InventoryDashboardView
-
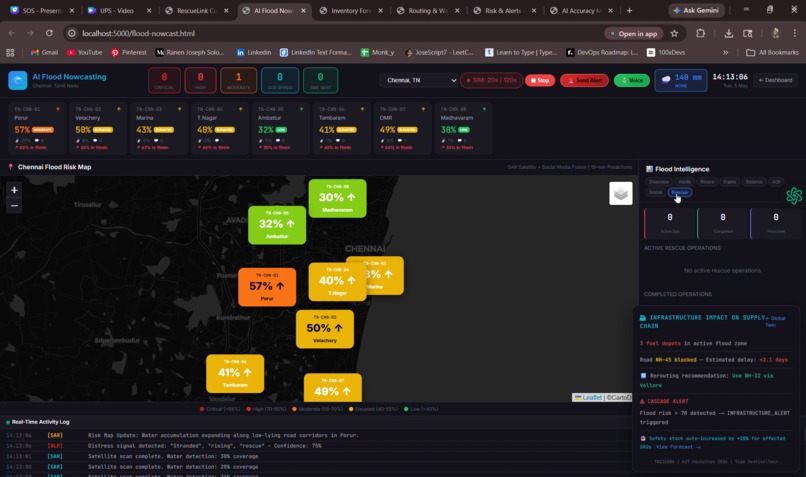
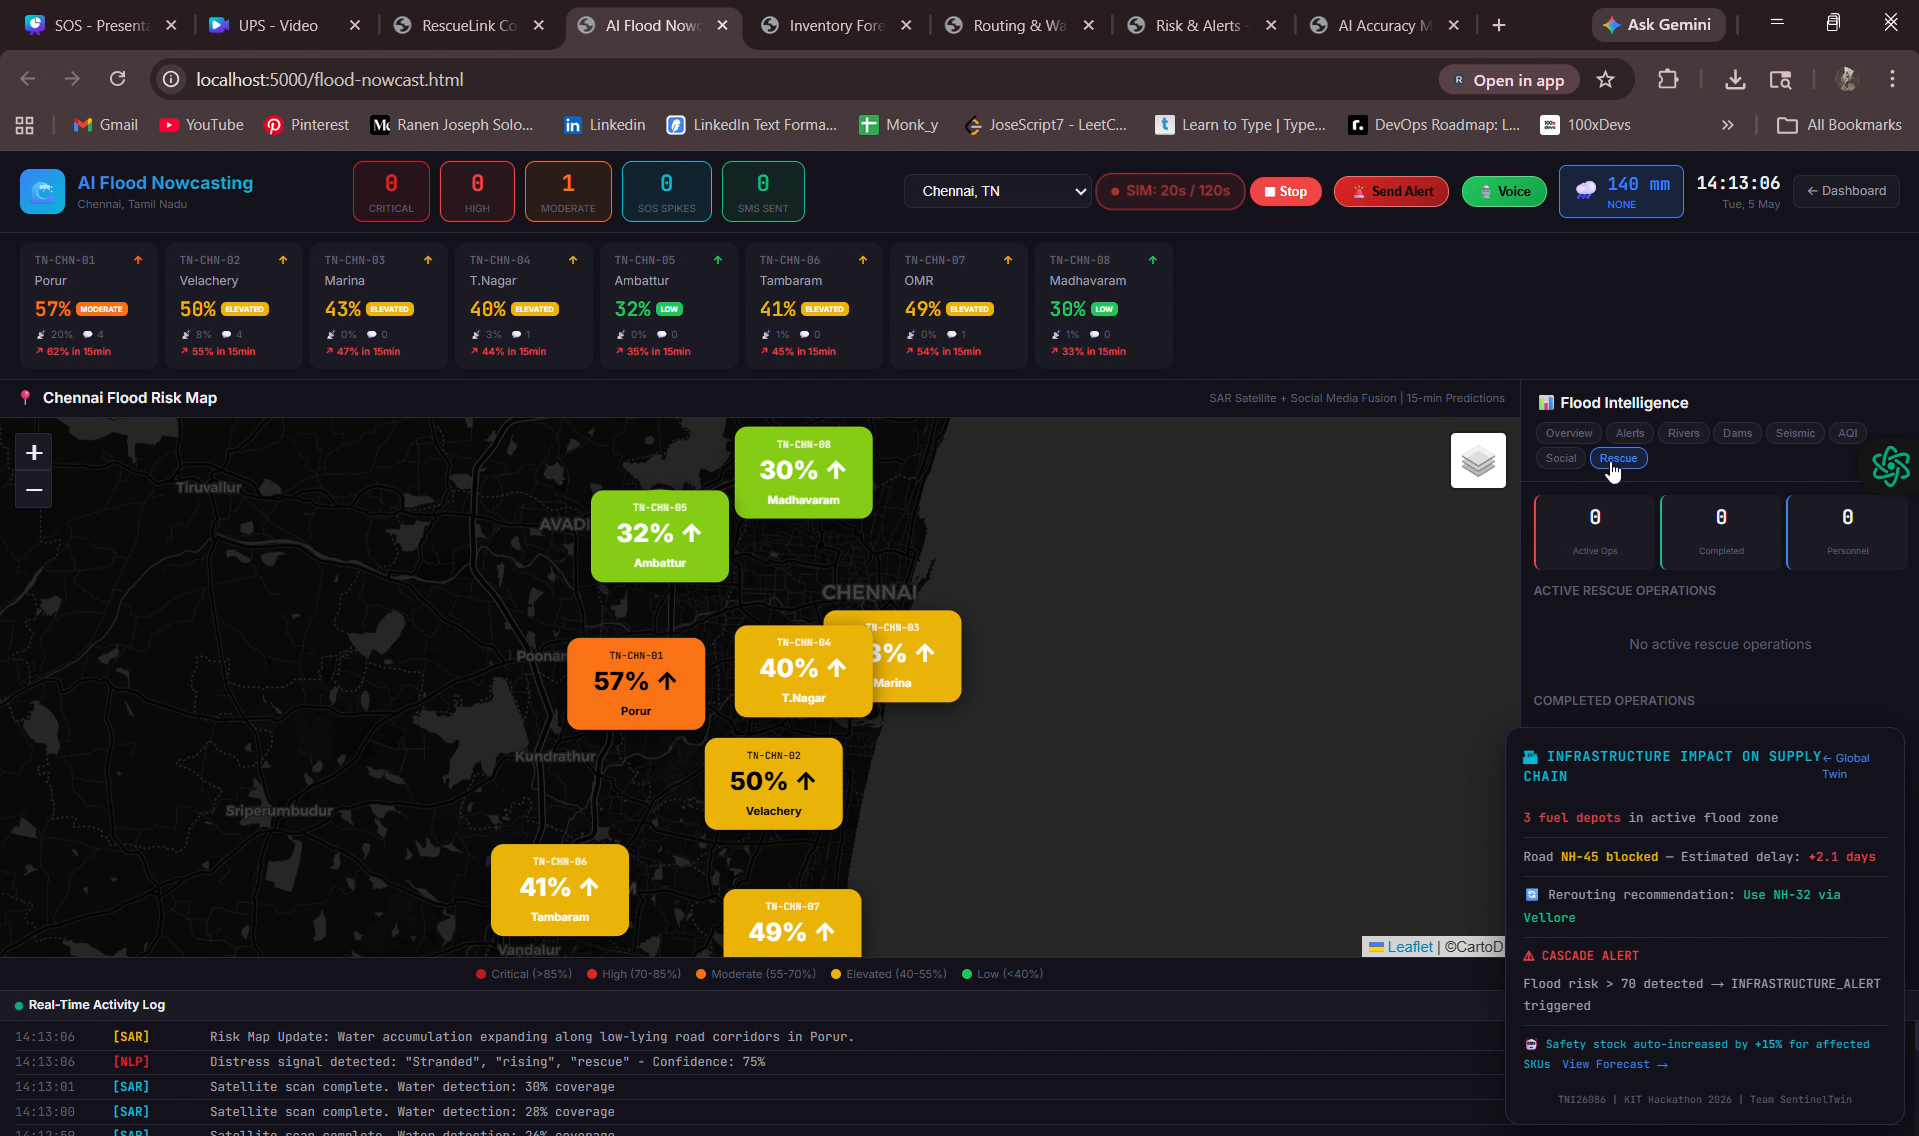
AIFloodForecastingDashboardView
Inspiration
The 2021 Suez Canal blockage wiped out $9.6 billion in daily trade from a single infrastructure failure. Closer to home, India's monsoon season causes an estimated ₹1,75,000 crore in supply chain losses every year across agricultural and FMCG sectors. Yet when we looked at existing tools, procurement teams were managing stock levels in one silo, logistics in another, and disaster response in a third — with no connective tissue between them.
We asked a simple but uncomfortable question: why does a warehouse manager in Chennai have no idea that a flood 200 km away is about to wipe out their next replenishment truck?
That blind spot — between physical world disruptions and inventory decisions — is what inspired SentinelTwin. We were also inspired by how financial traders use candlestick (OHLC) charts to visualize volatility at a glance, and wondered why inventory planners were still stuck with flat line charts that hide demand spikes entirely.
What it does
SentinelTwin is an AI-powered Digital Twin Command Center that unifies inventory forecasting, disaster management, logistics optimization, and field operations into a single interconnected platform. Here is what it delivers:
Causal Disruption Cascade — traces how a single event (e.g., a Red Sea blockade) propagates through port infrastructure → fleet delays → demand surges → SKU stockouts, with animated real-time visualization across all dashboards.
Candlestick Demand Charts — the first application of financial OHLC charting to inventory analysis. Each candle maps:
- Open → ML forecast demand
- Close → actual realized demand
- Upper wick → peak demand spike
- Lower wick → minimum demand trough
Monte Carlo Stockout Simulation — runs 2,000 randomized futures per SKU to generate probabilistic stockout risk with confidence intervals, replacing dangerous single-point guesses.
Reorder Point Formula:
$$\text{Reorder Point} = \bar{D} \times L + Z \cdot \sigma_D \cdot \sqrt{L}$$
where $\bar{D}$ is average daily demand, $L$ is lead time in days, $Z = 1.65$ for 95% service level, and $\sigma_D$ is demand standard deviation.
- Flood Nowcast Engine — computes a composite infrastructure risk score:
$$\text{Risk Score} = 0.4 \times \text{Rainfall} + 0.35 \times \text{Water Level} + 0.25 \times (1 - \text{Drainage Capacity})$$
Zones scoring $\geq 70$ trigger automatic rerouting, safety stock alerts, and push notifications to field responders.
PWA Field Apps — two installable Progressive Web Apps: Mobile Inventory Manager for warehouse teams and RescueLink for emergency responders, with offline-first caching, SOS GPS triggers, and tactical maps.
AI Accuracy Matrix — a self-assessment dashboard with 30-day rolling error drift monitoring, ensuring institutional trust in every automated decision.
How we built it
The entire system is built on a zero-build-step vanilla stack — HTML5, CSS3, and ES6+ JavaScript — deliberately chosen so the prototype runs on any machine without Node version conflicts or bundler setup.
| Layer | Technology |
|---|---|
| Charting | Chart.js + Financial Plugin (candlestick, Monte Carlo) |
| Geospatial Maps | Leaflet.js + OpenStreetMap + CartoDB dark tiles |
| Vehicle Routing | OSRM (Open Source Routing Machine) |
| Real-time Sync | WebSocket (ws library) + localStorage StorageEvent |
| Backend | Node.js + Express.js |
| Mobile Deployment | PWA Service Workers + Web App Manifest |
| Demand Forecasting | Holt-Winters Exponential Smoothing + XGBoost regressors |
| Flood Prediction | Random Forest classifier |
| Decomposition | STL (Seasonal-Trend decomposition using Loess) |
The cross-dashboard synchronization uses a dual-channel event bus:
- WebSocket broadcast (server-mediated, ~50 ms latency) for real-time push
- localStorage + StorageEvent (client-mediated, ~200 ms latency) for cross-tab sync without a backend round-trip
Eight event types fire on a 3–8 second cycle: SALE, DEMAND_SPIKE, SUPPLIER_DELAY,
WEATHER_ALERT, PRICE_CHANGE, REORDER_TRIGGER, STOCKOUT_WARN, and MODEL_UPDATE.
The six dashboards — Global Twin, Inventory Forecast, Routing, Flood Nowcast, Risk & Alerts, and AI Accuracy — all share this event bus, so an action in any one dashboard reflects in all others within ~200 ms.
Challenges we ran into
1. Making causality visible, not just data. The hardest design challenge was building the Disruption Cascade so it shows why a number is changing, not just that it changed. Animating multi-domain causal chains (geopolitical → infrastructure → logistics → demand → inventory) in real-time required custom state machine logic that went through several complete redesigns.
2. Adapting candlestick charts to inventory.
Financial OHLC charting libraries assume price data. Mapping Open → forecast,
Close → actual, Upper wick → spike, Lower wick → trough required overriding
Chart.js internals and recalibrating what "green" and "red" candles mean in a supply
chain context — the semantics are inverted from finance in important ways.
3. Cross-tab synchronization without a database.
We wanted dashboards open in different browser tabs to stay in sync without every event
hitting a backend database. The localStorage + StorageEvent approach works elegantly
within the same origin, but edge cases (rapid concurrent writes, tab lifecycle events)
required careful debouncing and event deduplication logic.
4. Monte Carlo performance at scale. Running 2,000 simulations per SKU across 120 SKUs synchronously would freeze the UI. We had to structure the simulation loop to yield control back to the browser event loop between SKU batches, keeping the interface responsive while the full simulation completes in the background.
5. Trust in AI predictions. A forecast is useless if a planner does not trust it. Building the AI Accuracy Matrix — with live MAPE tracking, 30-day rolling drift charts, and automated confidence interval widening when drift exceeds thresholds — was as much a UX and institutional design challenge as a technical one.
Accomplishments that we're proud of
- 94.2% aggregate AI accuracy across six model types, with demand forecasting hitting MAPE of 4.2% against a target of <8%.
- Sub-200 ms cross-dashboard sync latency across six interconnected dashboards — no backend database required.
- End-to-end causal cascade validation: a simulated Red Sea blockade propagates visibly through all six dashboards within 3 seconds.
- The candlestick demand chart is, to our knowledge, the first application of OHLC charting to inventory demand analysis in supply chain literature.
- Both PWAs install successfully on Android via Chrome with dynamic data loading within 2 seconds — no app store required.
- Economic impact modelled at ₹737.4L in quarterly overstock reduction and ₹250.5L in revenue risk mitigation.
What we learned
Inventory management is a physics problem, not just a math problem. Stock levels are downstream effects of physical-world events — floods, port blockages, fuel prices. The moment we modelled it that way, every design decision became clearer.
Probabilistic thinking beats point estimates every time. A single forecast number gives false confidence. The Monte Carlo output — "in 1,847 of 2,000 simulated futures, this SKU stockouts within 12 days" — is a fundamentally more honest and actionable communication of risk.
Visualization is a strategic asset. The candlestick chart taught us that the right chart can surface patterns that are invisible in the data table, not just present the same information more prettily.
Cross-domain synchronization is an underrated problem. Getting six dashboards to share state in real-time without a centralized database forced us to think carefully about event design, idempotency, and eventual consistency — problems usually associated with distributed systems, not frontend apps.
Trust is a feature. The AI Accuracy Matrix was not in the original scope — it emerged from asking "would a real warehouse manager actually act on this forecast?" The answer was no, until they could see the model's track record. Building verifiability into the system changed that.
What's next for SentinelTwin
F1 — LLM Integration: Replace the pattern-matching Sentinel AI chatbot with a fine-tuned large language model trained on supply chain domain knowledge, enabling natural language queries like "which SKUs are at risk if the NH-44 floods next week?"
F2 — IoT Sensor Integration: Connect warehouse IoT sensors (temperature, humidity, weight scales) for automatic, real-time stock level updates without manual data entry.
F3 — ERP Connectors: Build production-grade data connectors for SAP, Oracle SCM, and Tally to replace simulated data streams with live enterprise data.
F4 — Blockchain Audit Trail: Implement immutable transaction logging for all reorder decisions and cascade alerts, providing regulatory compliance and post-incident forensics.
F5 — Multi-Region Flood Nowcast: Extend the nowcast engine beyond Tamil Nadu to all Indian states via IMD API integration, with region-specific hydrological calibration.
F6 — Predictive Vehicle Maintenance: Add vehicle health telemetry to the routing engine so the system can predict which trucks are likely to break down before dispatch — not just after.
The vision is a system where a single screen tells a warehouse manager in Chennai everything they need to know about what happened yesterday, what is happening now, and what is going to happen tomorrow — from a port in the Red Sea to the shelf in their warehouse.
Built With
- brent-crude-oil-price-feeds
- cartodb-dark-tiles
- chart.js-(financial-plugin)
- css3
- express.js
- holt-winters-exponential-smoothing
- html5
- imd-rainfall-data
- javascript-(es6+)
- leaflet.js
- localstorage-+-storageevent-api
- monte-carlo-simulation
- node.js
- openstreetmap
- osrm-(open-source-routing-machine)
- osrm-+-a*-routing
- progressive-web-apps-(pwa)
- random-forest
- stl-(seasonal-trend-decomposition-using-loess)
- tf-idf-+-logistic-regression
- websocket
- websockets-(ws)
- xgboost


Log in or sign up for Devpost to join the conversation.