-
-
exploded CAD view
-
dual model system
-
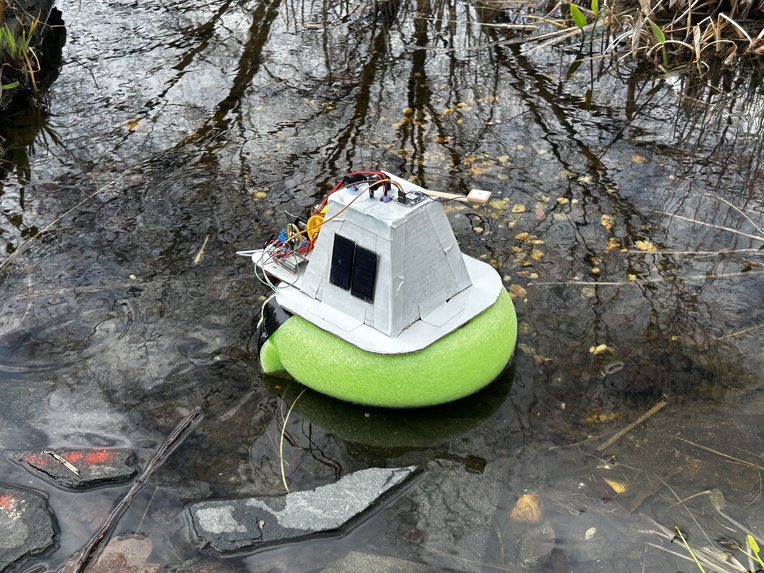
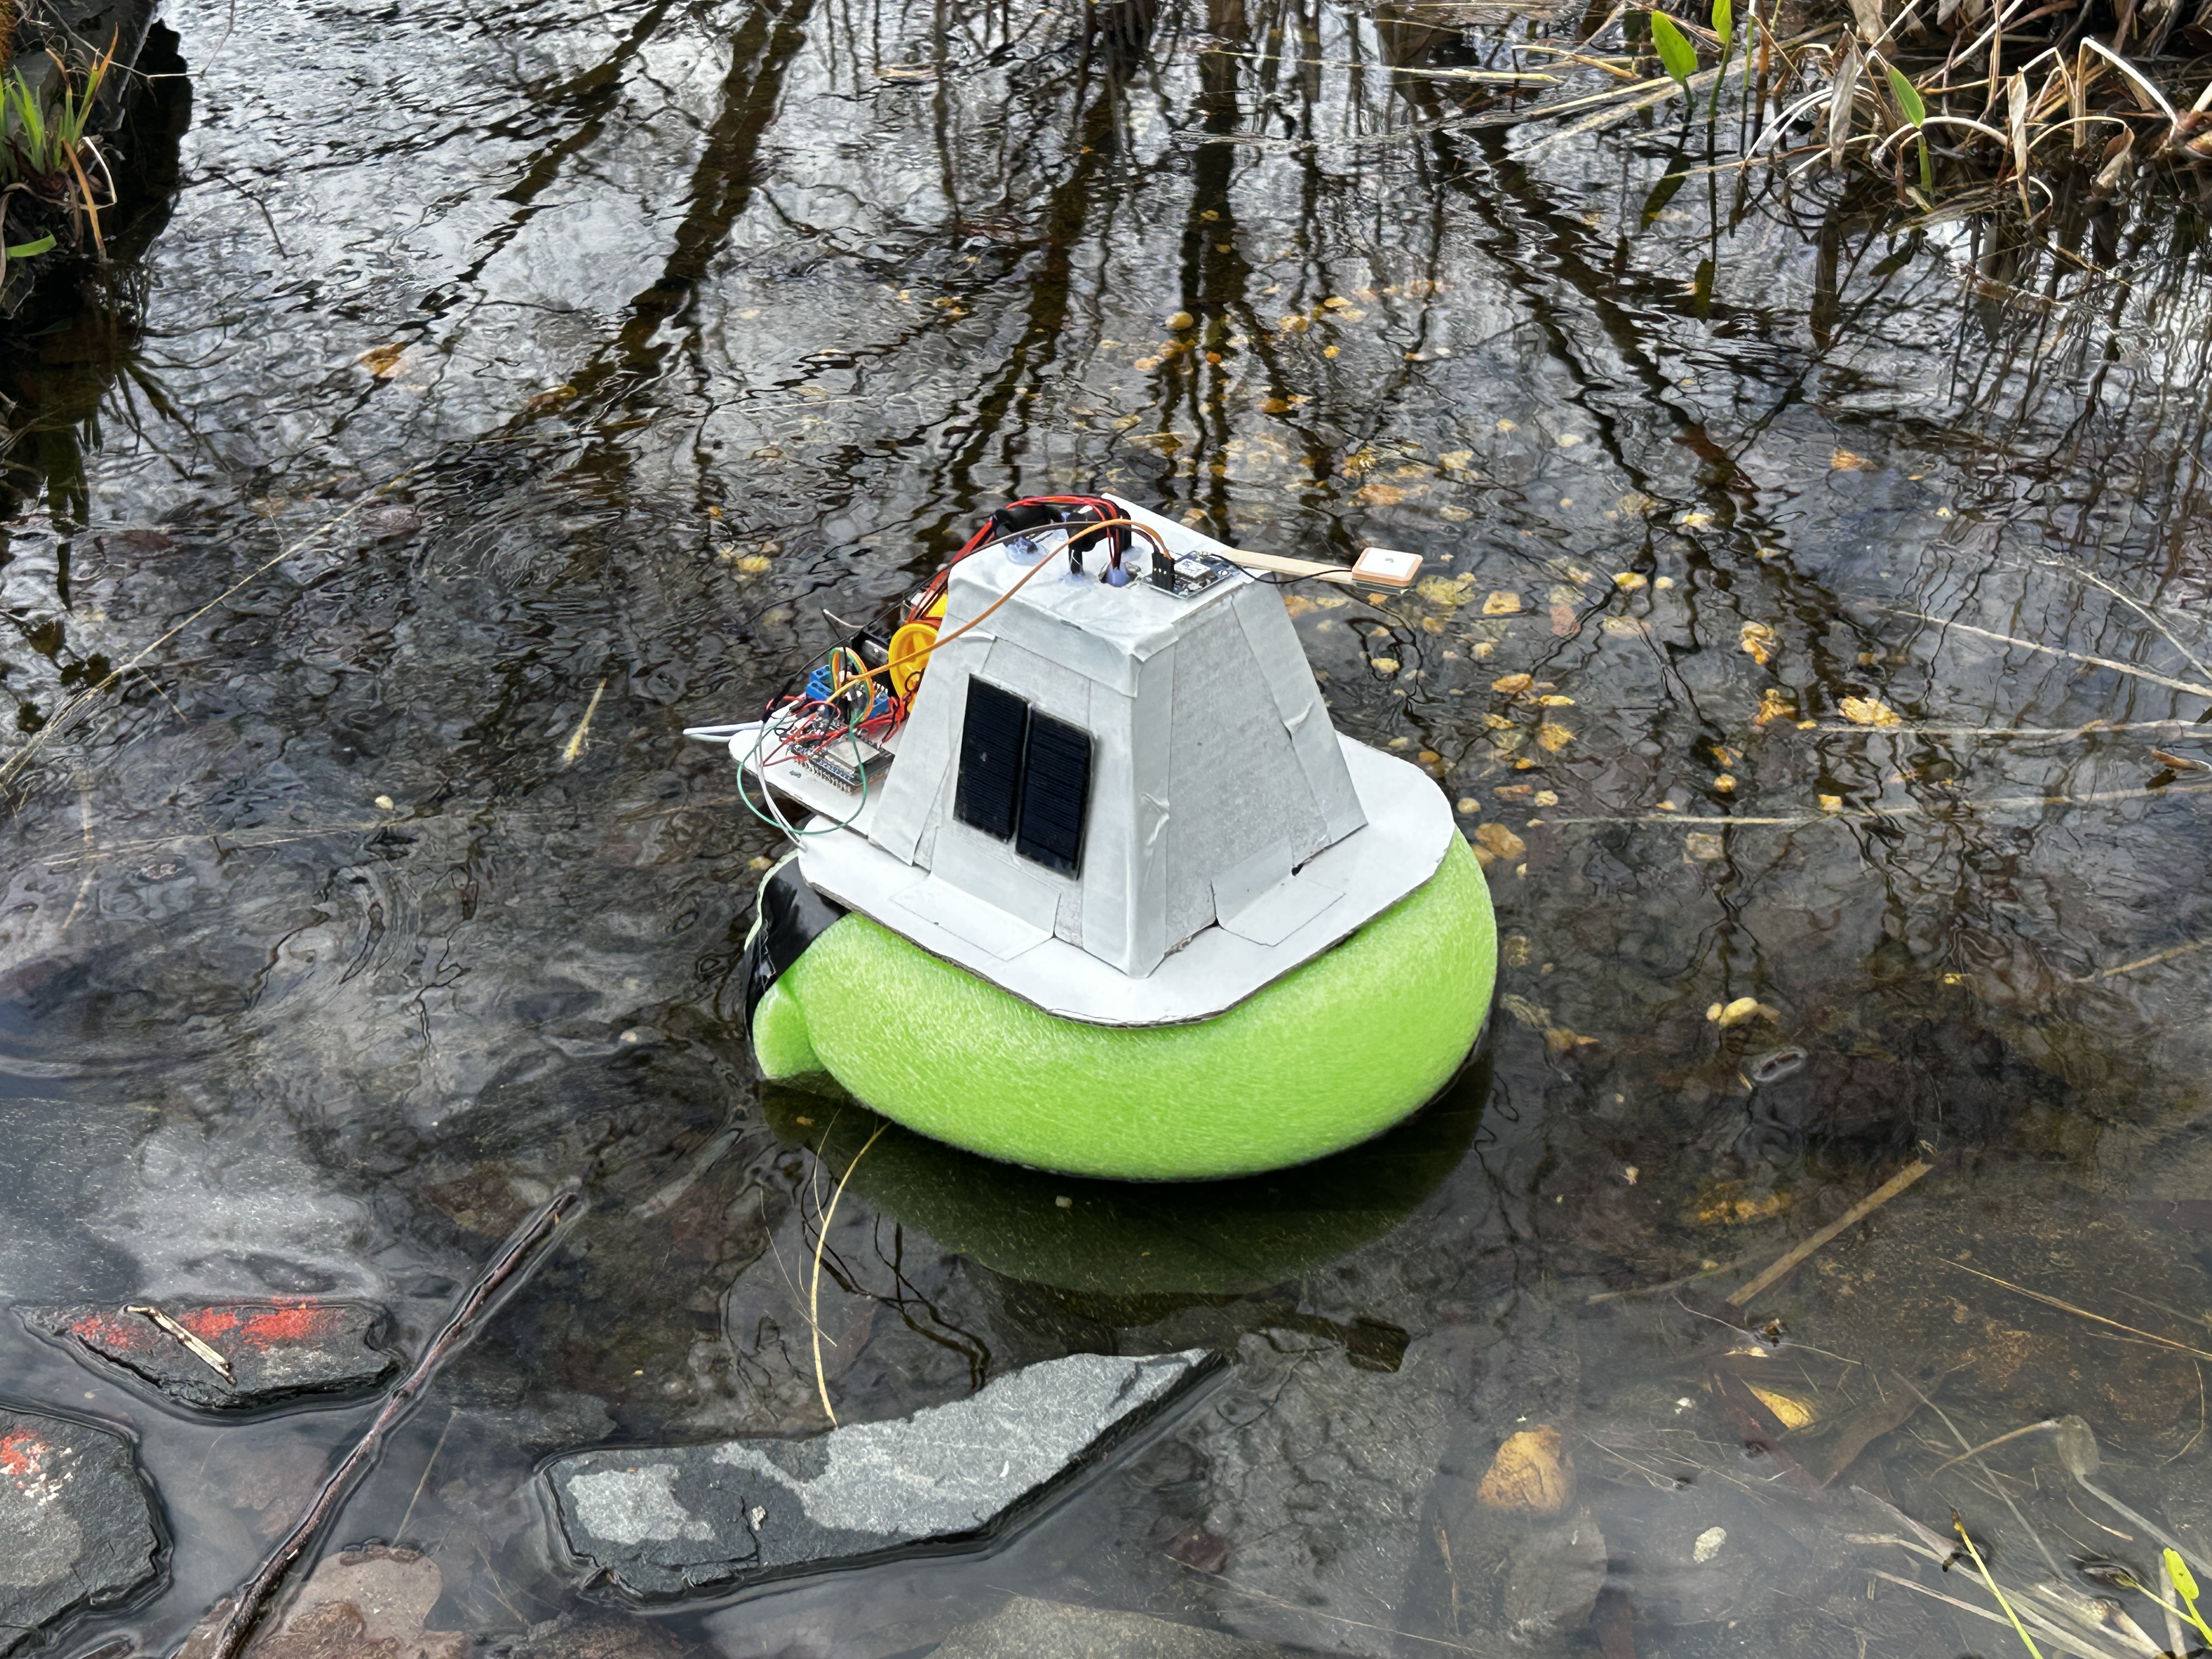
SENS Pod on water
-
Sensors integration
-
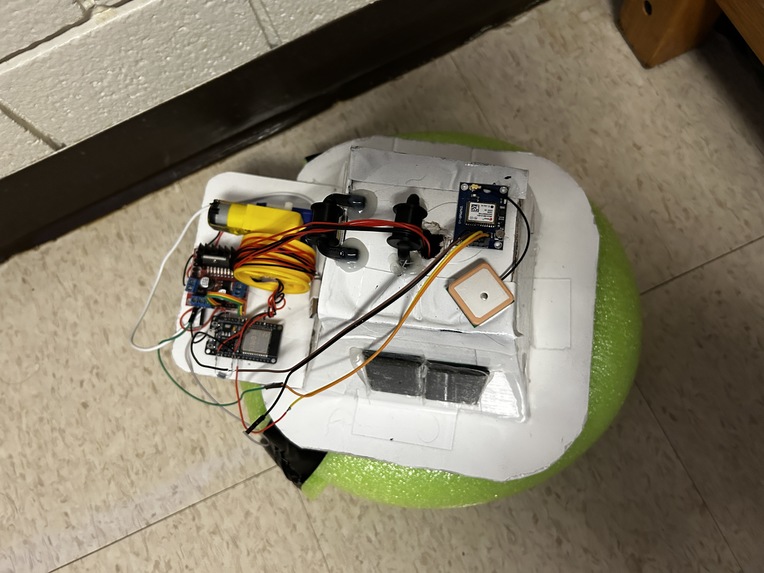
Top down view of exterior shell
-
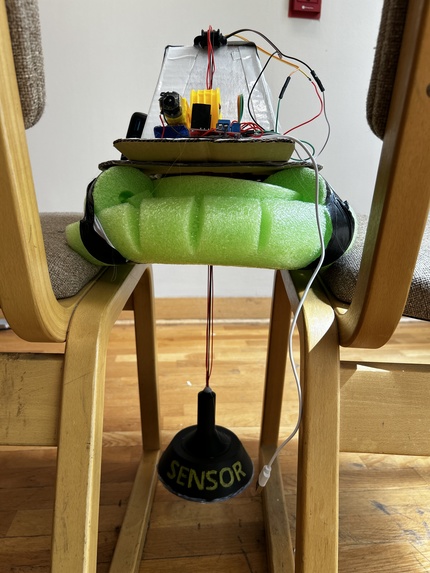
depth based sensor payload
-
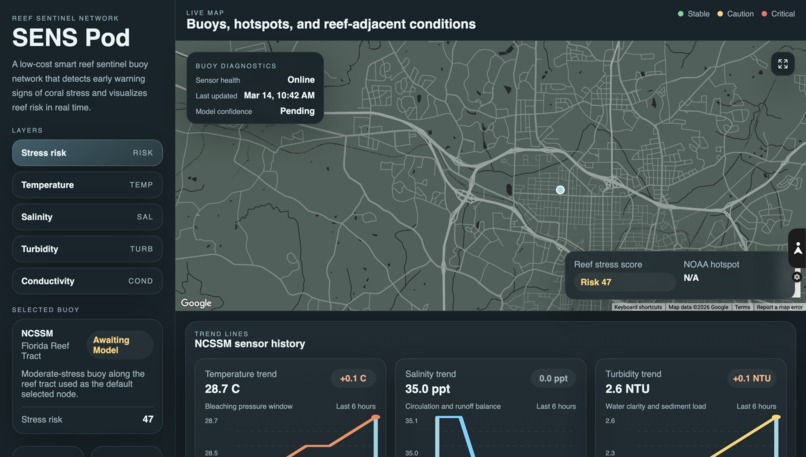
SENS Pod Dashboard


SENS Pod: Submersible Environmental Network Sensor
Technical Documentation
This page includes documentation for SENS Pod: Submersible Environmental Network Sensor, submitted for the Hardware track at SMathHacks 2026. Our team members include Aaditya Sah and Pranav Mahesh. The SENS Pod is an autonomous buoy network for coral reef ecosystems, monitoring temperature, salinity, pH, turbidity, and dissolved oxygen in real time: using machine learning to predict reef health and guide ocean conservation. SMathHacks 2026 was hosted 3/14/2026 to 3/15/2026.

SENS Pod is an integrated hardware-software solution featuring a network of buoys that float on the ocean surface and deploy a sensor array to multiple depths via a winch mechanism, capturing a full vertical profile of the water column above a coral reef. The nature of SENS Pod's scalable mesh network enables real-time environmental data acquisition across a distributed array of buoys spanning large reef ecosystems simultaneously. A interactive interface allows users to access and analyze live telemetry, visualize sensor readings across a geographic map, and view machine learning-driven predictions of reef health scores across monitored zones.
For a quick overview, our project video, final product, and key images are available in the media gallery. Navigate using the arrows on either side of the video above. Note that the video serves as a high-level summary of our work, and this technical documentation provides a far more thorough and complete account of the project.
Judge and User Guide
Although SENS Pod is at its core a hardware project, we recognize that it is difficult to judge hardware projects remotely and asynchronously, without access to the physical device. Thus, we developed a fully integrated frontend which is publicly accessible here.

The interface opens to a live map displaying all active SENS Pod buoy locations, color-coded by reef stress status: Stable (green), Caution (yellow), and Critical (red). Clicking any buoy on the map opens a detailed panel on the left side of the screen, showing the following information:
| Layer | Displayed Information |
|---|---|
| Stress Risk | ML-predicted coral reef stress score (0–100) for the selected buoy zone |
| Temperature | Live temperature trend and bleaching pressure window over the last 6 hours |
| Salinity | Live salinity trend and circulation/runoff balance over the last 6 hours |
| Turbidity | Live turbidity trend and water clarity/sediment load over the last 6 hours |
| Conductivity | Live conductivity readings and anomaly detection |
The bottom of the interface displays a critical anomaly feed, flagging any sensor readings that exceed healthy thresholds in real time, as well as a zone watchlist that highlights the highest-priority buoy zones currently at risk.
During the hackathon, we had time to develop one functional SENS Pod prototype. If the pod is currently active, the NCSSM buoy (Station 1) will be updated in live time. More realistically, the pod may not be running during judging, in which case Station 1 will display data from its most recent session. All remaining stations are displaying simulated data to demonstrate our mesh network proof-of-concept for peer-to-peer data transfer between SENS Pod buoys.
Intended Usage
SENS Pod is designed to be deployed as a network of buoys along coastal reef zones, stationed in shallow near-shore waters close enough to coral reefs for accurate environmental readings and close enough to shore for easy researcher access and maintenance. Each pod is fully self-sustained via an onboard solar panel and equipped with a GPS module for precise real-time location tracking, making long-term unattended deployment practical. Pods communicate with one another through a peer-to-peer mesh network, relaying data across the array to a shore-side gateway that uploads everything to the cloud. This means even the furthest pods stay connected, and the network remains resilient if any single pod goes offline. The intended users are marine biologists, reef conservationists, and environmental researchers who need continuous, high-resolution water quality data across a reef system without costly and infrequent manual dive surveys.
Inspiration
Coral reefs cover less than 1% of the ocean floor yet support an estimated 25% of all marine species, and serve as a critical buffer protecting coastlines from storm surge and erosion. Despite their outsized importance, coral reefs are in crisis. Over 50% of the world's coral reefs have been lost since the 1950s, and scientists project that up to 90% could disappear by 2050 if current warming trends continue. The leading drivers of reef degradation are rising ocean temperatures, ocean acidification, and declining water quality, all of which are measurable through environmental sensors. Yet the tools currently available to researchers are inadequate. Manual dive surveys are expensive, infrequent, and cover only a tiny fraction of a reef at any given time. Existing static buoy systems capture data at a single point and lack the spatial resolution needed to understand how conditions vary across an entire reef ecosystem. By the time degradation is detected through these methods, bleaching events have already begun and the window for intervention has passed.

SENS Pod was built around a simple but urgent idea: reef conservation needs to shift from reactive to predictive. Rather than waiting for a bleaching event to be observed and reported, SENS Pod continuously monitors the environmental conditions that precede coral stress, feeding that data into a machine learning model that generates real-time reef health predictions across an entire monitored zone. By deploying a mesh network of buoys that collectively capture temperature, salinity, pH, turbidity, and dissolved oxygen across a reef system simultaneously, SENS Pod provides the kind of high-resolution, continuous, and geolocation rich data that has never before been accessible at this scale or cost. Our goal is to give researchers and conservationists an early warning system for reef health, so that intervention can happen before it is too late.
Ideation
Our initial vision for SENS Pod centered on a fully submersible underwater drone that could autonomously navigate reef ecosystems and collect environmental data at various depths. While compelling on paper, we quickly ran into a fundamental problem: underwater wireless communication is extraordinarily difficult. Standard 2.4GHz WiFi and Bluetooth signals attenuate almost immediately in water, and acoustic modems capable of underwater data transmission are expensive and complex for a hackathon timeline. A fully submersible solution would also introduce significant engineering challenges around waterproofing, pressure resistance, and battery life that would be impossible to address meaningfully in two days. We needed a design that was practical, low-cost, and easy to maintain in the field.
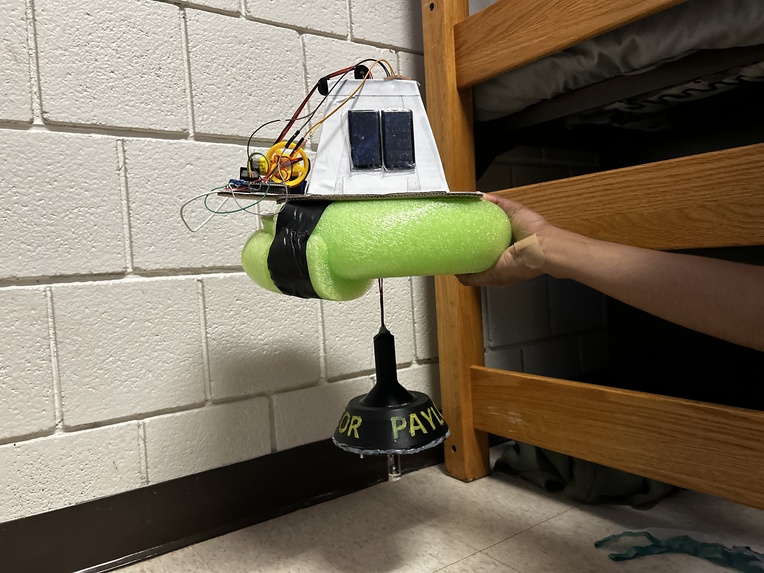
This led us to the buoy form factor, which solved nearly every constraint we had identified. By floating on the surface, each SENS Pod maintains a clear line of sight for 2.4GHz mesh communication between pods and to the shore-side gateway, eliminating the underwater communication problem entirely. To preserve our ability to capture depth-resolved water column data, we designed a winch mechanism that lowers the sensor array to programmable depths below the buoy, allowing us to profile temperature, salinity, turbidity, and other parameters at multiple depths without the pod ever needing to submerge itself. The buoy form factor also makes the system far more practical in the real world: pods are solar powered, easily retrievable for maintenance, and deployable without any specialized equipment. What began as a constraint ended up shaping a more robust, scalable, and cost-effective solution than our original concept.
CAD
We began the design process with rough sketches to establish the overall form factor and component layout before moving into CAD. The final design was modeled to be fully 3D printable, modular, and watertight. We prioritized ease of assembly, field maintenance, and low manufacturing cost.

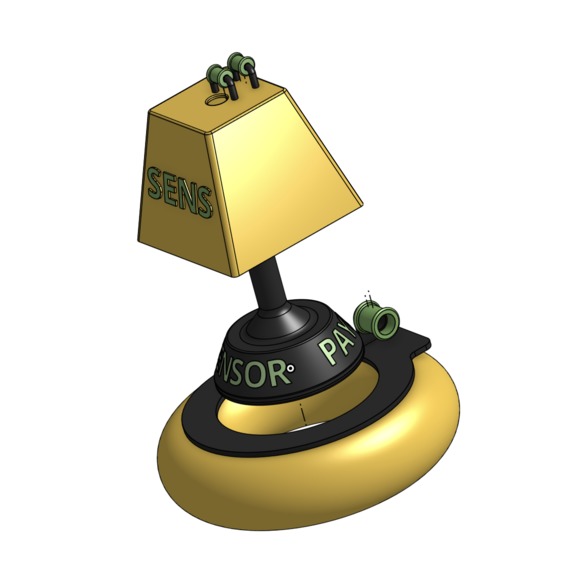
The full SENS Pod consists of a buoyant outer hull that houses all electronics and power systems above the waterline. The hull is designed to be positively buoyant at all times, ensuring the pod remains stable on the surface regardless of payload weight below.

The exploded view reveals the internal payload bay, which houses the sensor assembly and winch-driven pulley mechanism responsible for deploying the sensor array to programmable depths. Keeping all electronics inside the sealed hull above water dramatically simplifies waterproofing requirements while still enabling depth-resolved measurements.

The winch motor spools a tether connected directly to the sensor payload, lowering and raising it to target depths on a programmatic schedule. This design allows SENS Pod to capture a full vertical profile of the water column without any part of the main electronics housing ever submerging.

The sensor payload itself is composed of three parts: a base where sensors are mounted, a body that encloses and protects the sensor assembly, and a stem that extends downward into the water. The stem features raised ledges along its exterior, which dramatically increase the surface area available for silicone sealant adhesion, creating a far more robust watertight seal than a smooth surface alone would allow.

The labeled base diagram shows the precise mounting positions for each sensor on the payload, ensuring consistent sensor orientation and spacing across all manufactured units.
Sensors Analysis
SENS Pod is designed to capture a comprehensive picture of reef water quality by measuring the key environmental parameters that directly correlate with coral health and stress. Water temperature is the single most critical indicator of coral bleaching risk, while pH reflects ocean acidification levels that weaken coral skeletons over time. Salinity and conductivity provide insight into freshwater runoff and circulation patterns, turbidity measures water clarity and sediment load which can smother coral, and dissolved oxygen levels indicate the overall biological health of the water column. Together these measurements give researchers a complete environmental profile at multiple depths via the winch-deployed sensor array.
| Measurement Type | Sensor Model | Parameters Measured | Communication | Notes |
|---|---|---|---|---|
| Water Temperature | DS18B20 | Temperature (°C) | 1-Wire | Waterproof probe, industry standard for underwater temperature sensing |
| pH | PH-4502C | pH (0-14) | Analog | Measures ocean acidification levels, critical for coral skeleton formation |
| Turbidity | DFRobot Turbidity Sensor | Turbidity (NTU) | Analog | Measures water clarity and sediment load which can smother coral reefs |
| Conductivity / Salinity | Custom Conductivity Probe | Conductivity (mS/cm), Salinity (ppt) | Analog | Measures ionic concentration of seawater to derive salinity and detect freshwater intrusion |
| GPS | NEO-6M GPS Module | Latitude, Longitude | UART | Provides real-time pod location for georeferencing sensor data on the frontend map and detecting pod drift |
We ensure that all sensors selected are available and compatible with our chosen microcontroller.
| Metric | Relevant Sensor | Available |
|---|---|---|
| Water Temperature | DS18B20 | ✅ |
| pH | PH-4502C | ✅ |
| Turbidity | DFRobot Turbidity Sensor | ✅ |
| Conductivity / Salinity | Custom Conductivity Probe | ✅ |
| GPS | NEO-6M | ✅ |
Now that we know what sensors we will use, we analyze their pinouts and datasheets to ensure compatibility with our chosen microcontroller (ESP32). All analog sensors are read through the ESP32's onboard ADC, and I2C/UART sensors are assigned to their respective dedicated pins.
| Sensor Model | Communication | Pinout | Power |
|---|---|---|---|
| DS18B20 | 1-Wire | VCC, GND, Data | 3.3V / 5V |
| PH-4502C | Analog | VCC, GND, Analog Output | 5V |
| DFRobot Turbidity | Analog | VCC, GND, Analog Output | 5V |
| Custom Conductivity Probe | Analog | VCC, GND, Analog Output | 3.3V |
| NEO-6M GPS | UART | VCC, GND, TX, RX | 3.3V |
Custom Conductivity / Salinity Probe

The custom conductivity probe consists of two parallel metal electrodes mounted at a fixed distance apart on a non-conductive base. When submerged, the probe passes a small electrical current between the two electrodes through the water. The resistance of that current is directly proportional to the ionic concentration of the surrounding seawater, which can then be converted into a conductivity reading in mS/cm and further derived into a salinity value in parts per thousand (ppt). The fixed electrode spacing is critical, as any variation in the gap between electrodes would affect the cell constant and introduce measurement error, so the rigid stick mount ensures consistent and repeatable readings across all manufactured units.
Output Devices
In addition to sensors, SENS Pod includes the following output components to drive the winch mechanism responsible for deploying the sensor payload to target depths.
| Component | Model | Purpose | Communication |
|---|---|---|---|
| Motor Driver | L298N | Controls direction and speed of the winch motor | Digital (PWM) |
| DC Motor | TT Motor | Spools and unspools the tether to raise and lower the sensor payload | Driven via L298N |
The L298N motor driver receives PWM signals from the ESP32 to control both the speed and direction of the DC motor, allowing the firmware to precisely lower the sensor payload to a target depth and retrieve it on a programmatic schedule.
Electrical Engineering
We began by designing a full wiring schematic to plan out all sensor connections, power routing, and motor driver integration before assembling any physical components. The ESP32 serves as the central microcontroller, with all sensors and output devices wired through a single unified circuit.

The schematic maps every pin assignment across the DS18B20, PH-4502C, DFRobot turbidity sensor, custom conductivity probe, NEO-6M GPS, and L298N motor driver. Power rails are clearly separated between 3.3V and 5V to ensure each sensor operates within its rated voltage range.

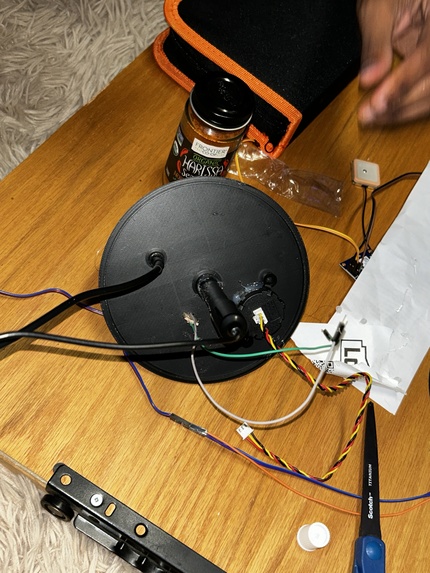
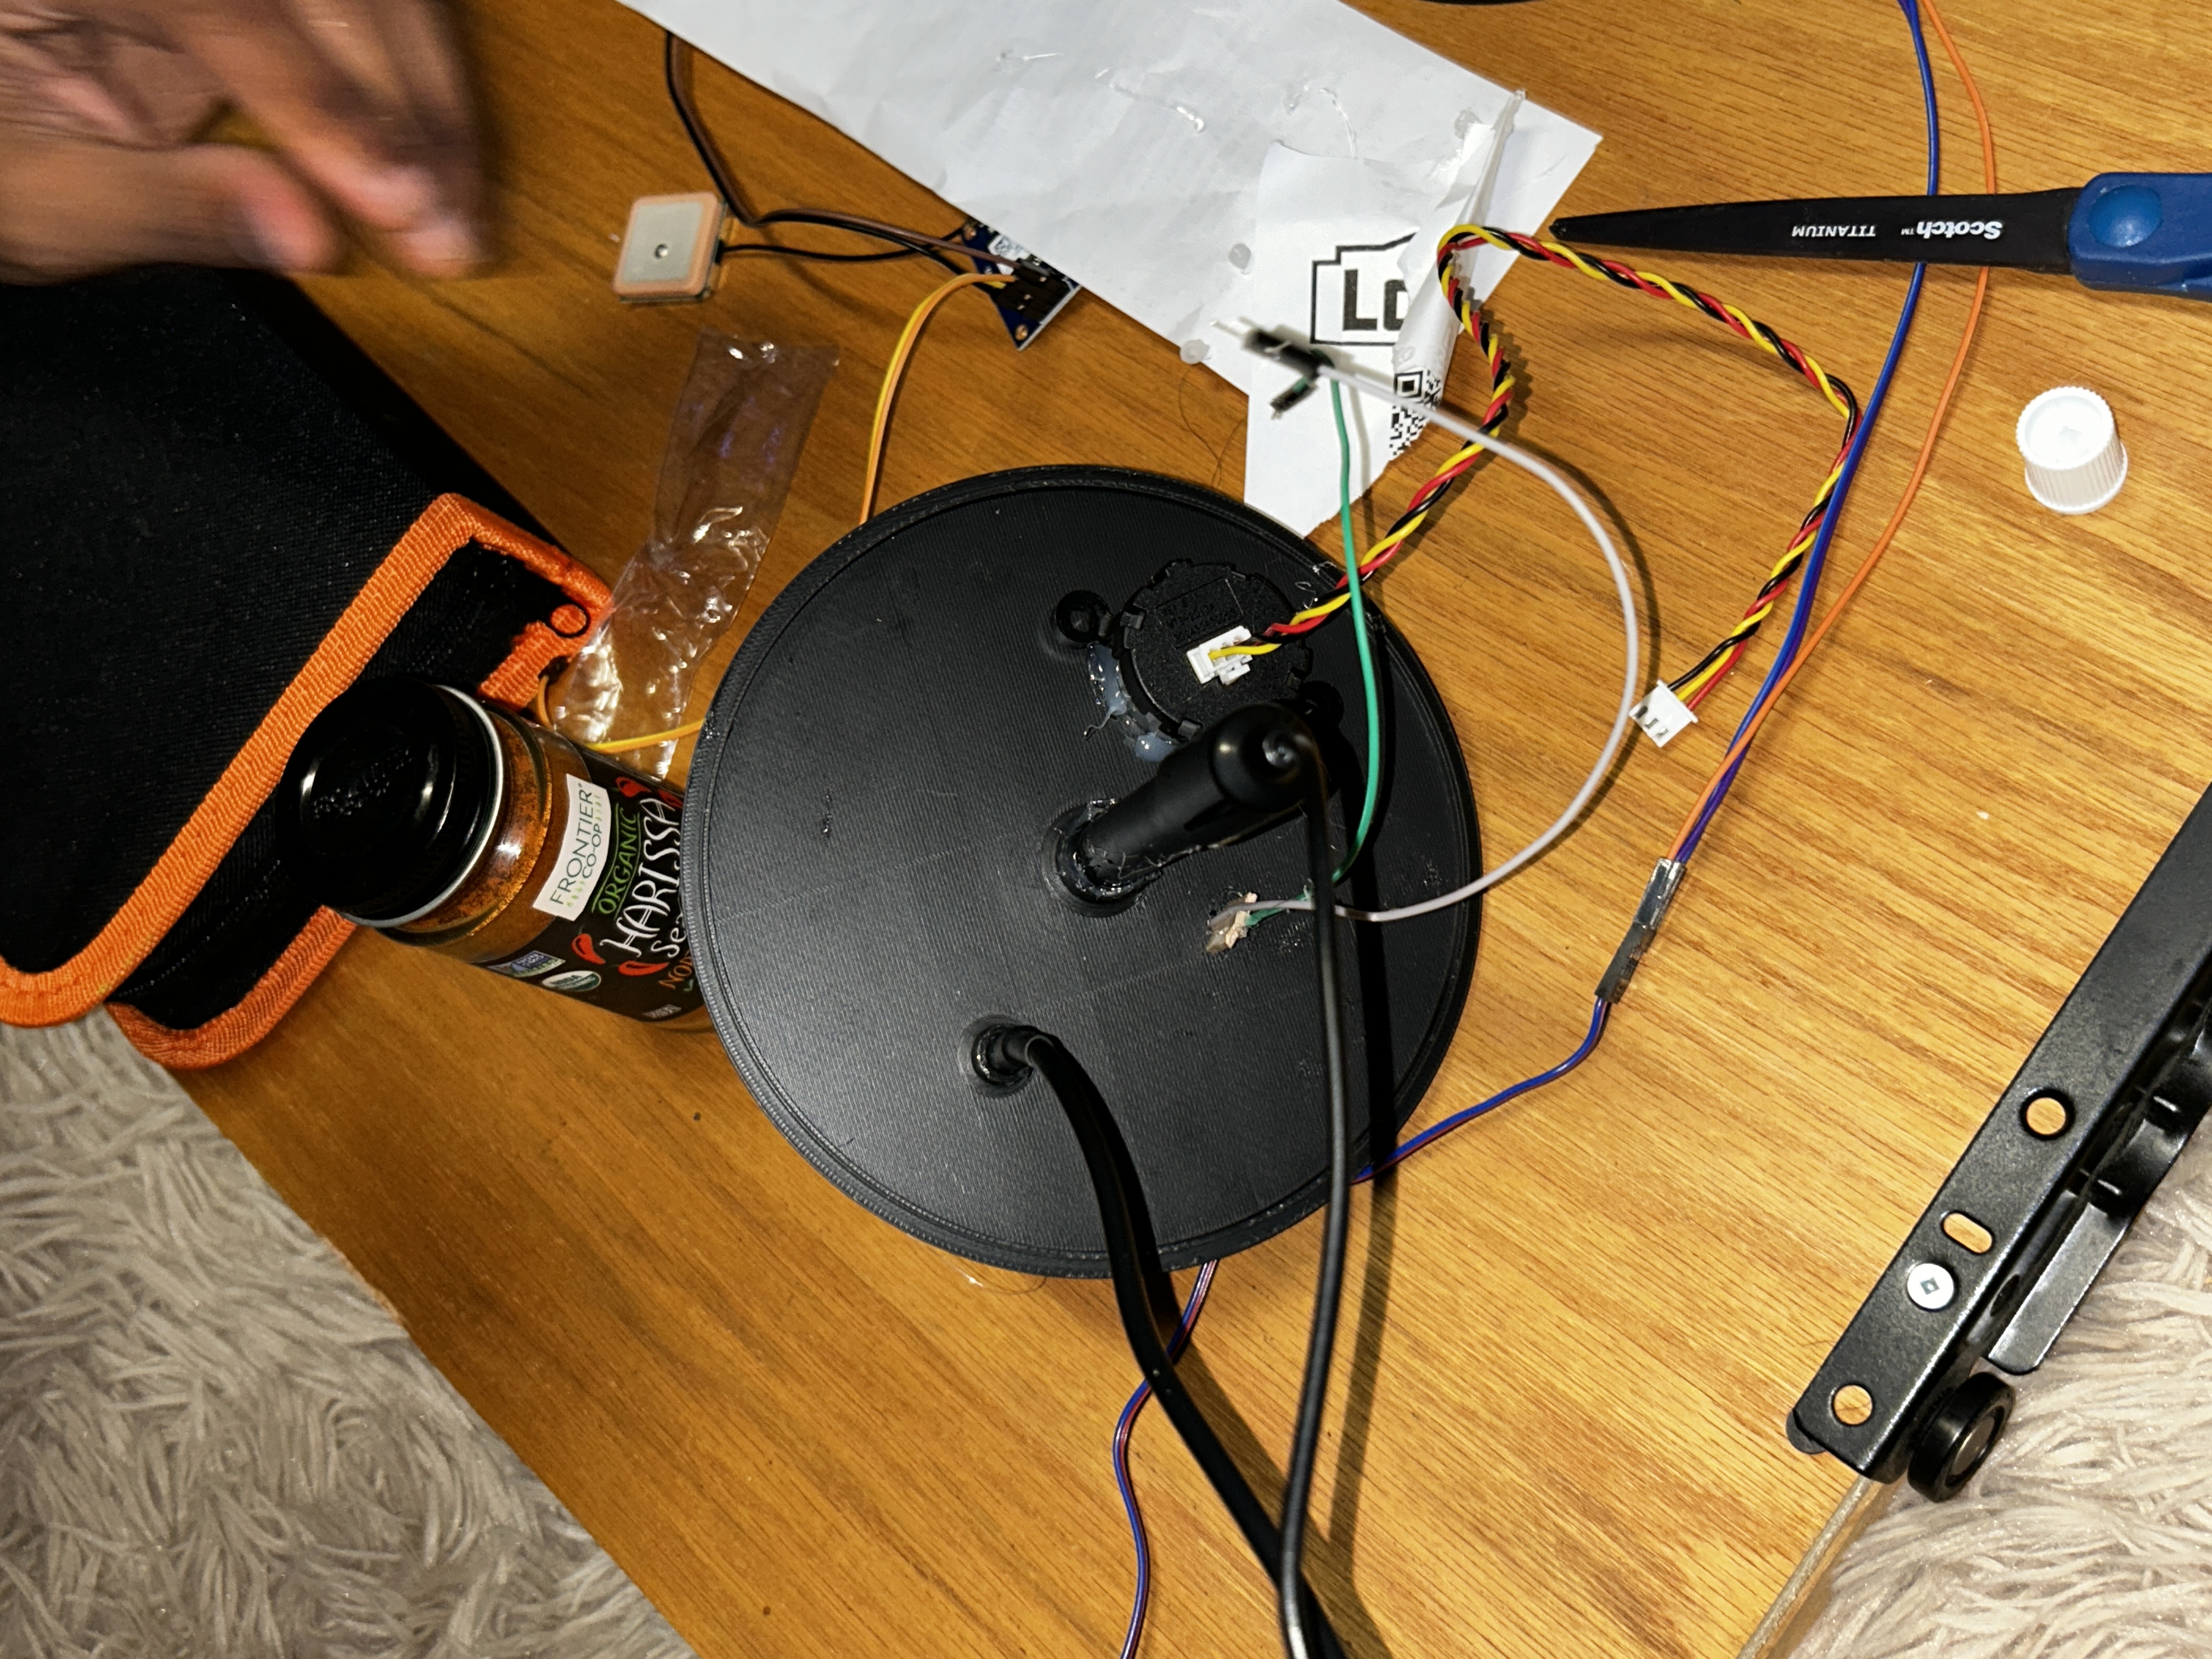
Internal payload wiring was carefully managed to keep all connections compact and organized within the tight confines of the payload body. Wire routing was planned to avoid any crossover near the silicone seal points, ensuring that wiring does not compromise the watertight integrity of the payload housing.

The payload wiring was further dressed and routed specifically to make sealing as clean as possible, with all wire exits consolidated to a single exit point on the payload stem. This single exit point design minimizes the number of penetrations through the waterproof housing, reducing potential failure points in the seal.
 |
 |
 |
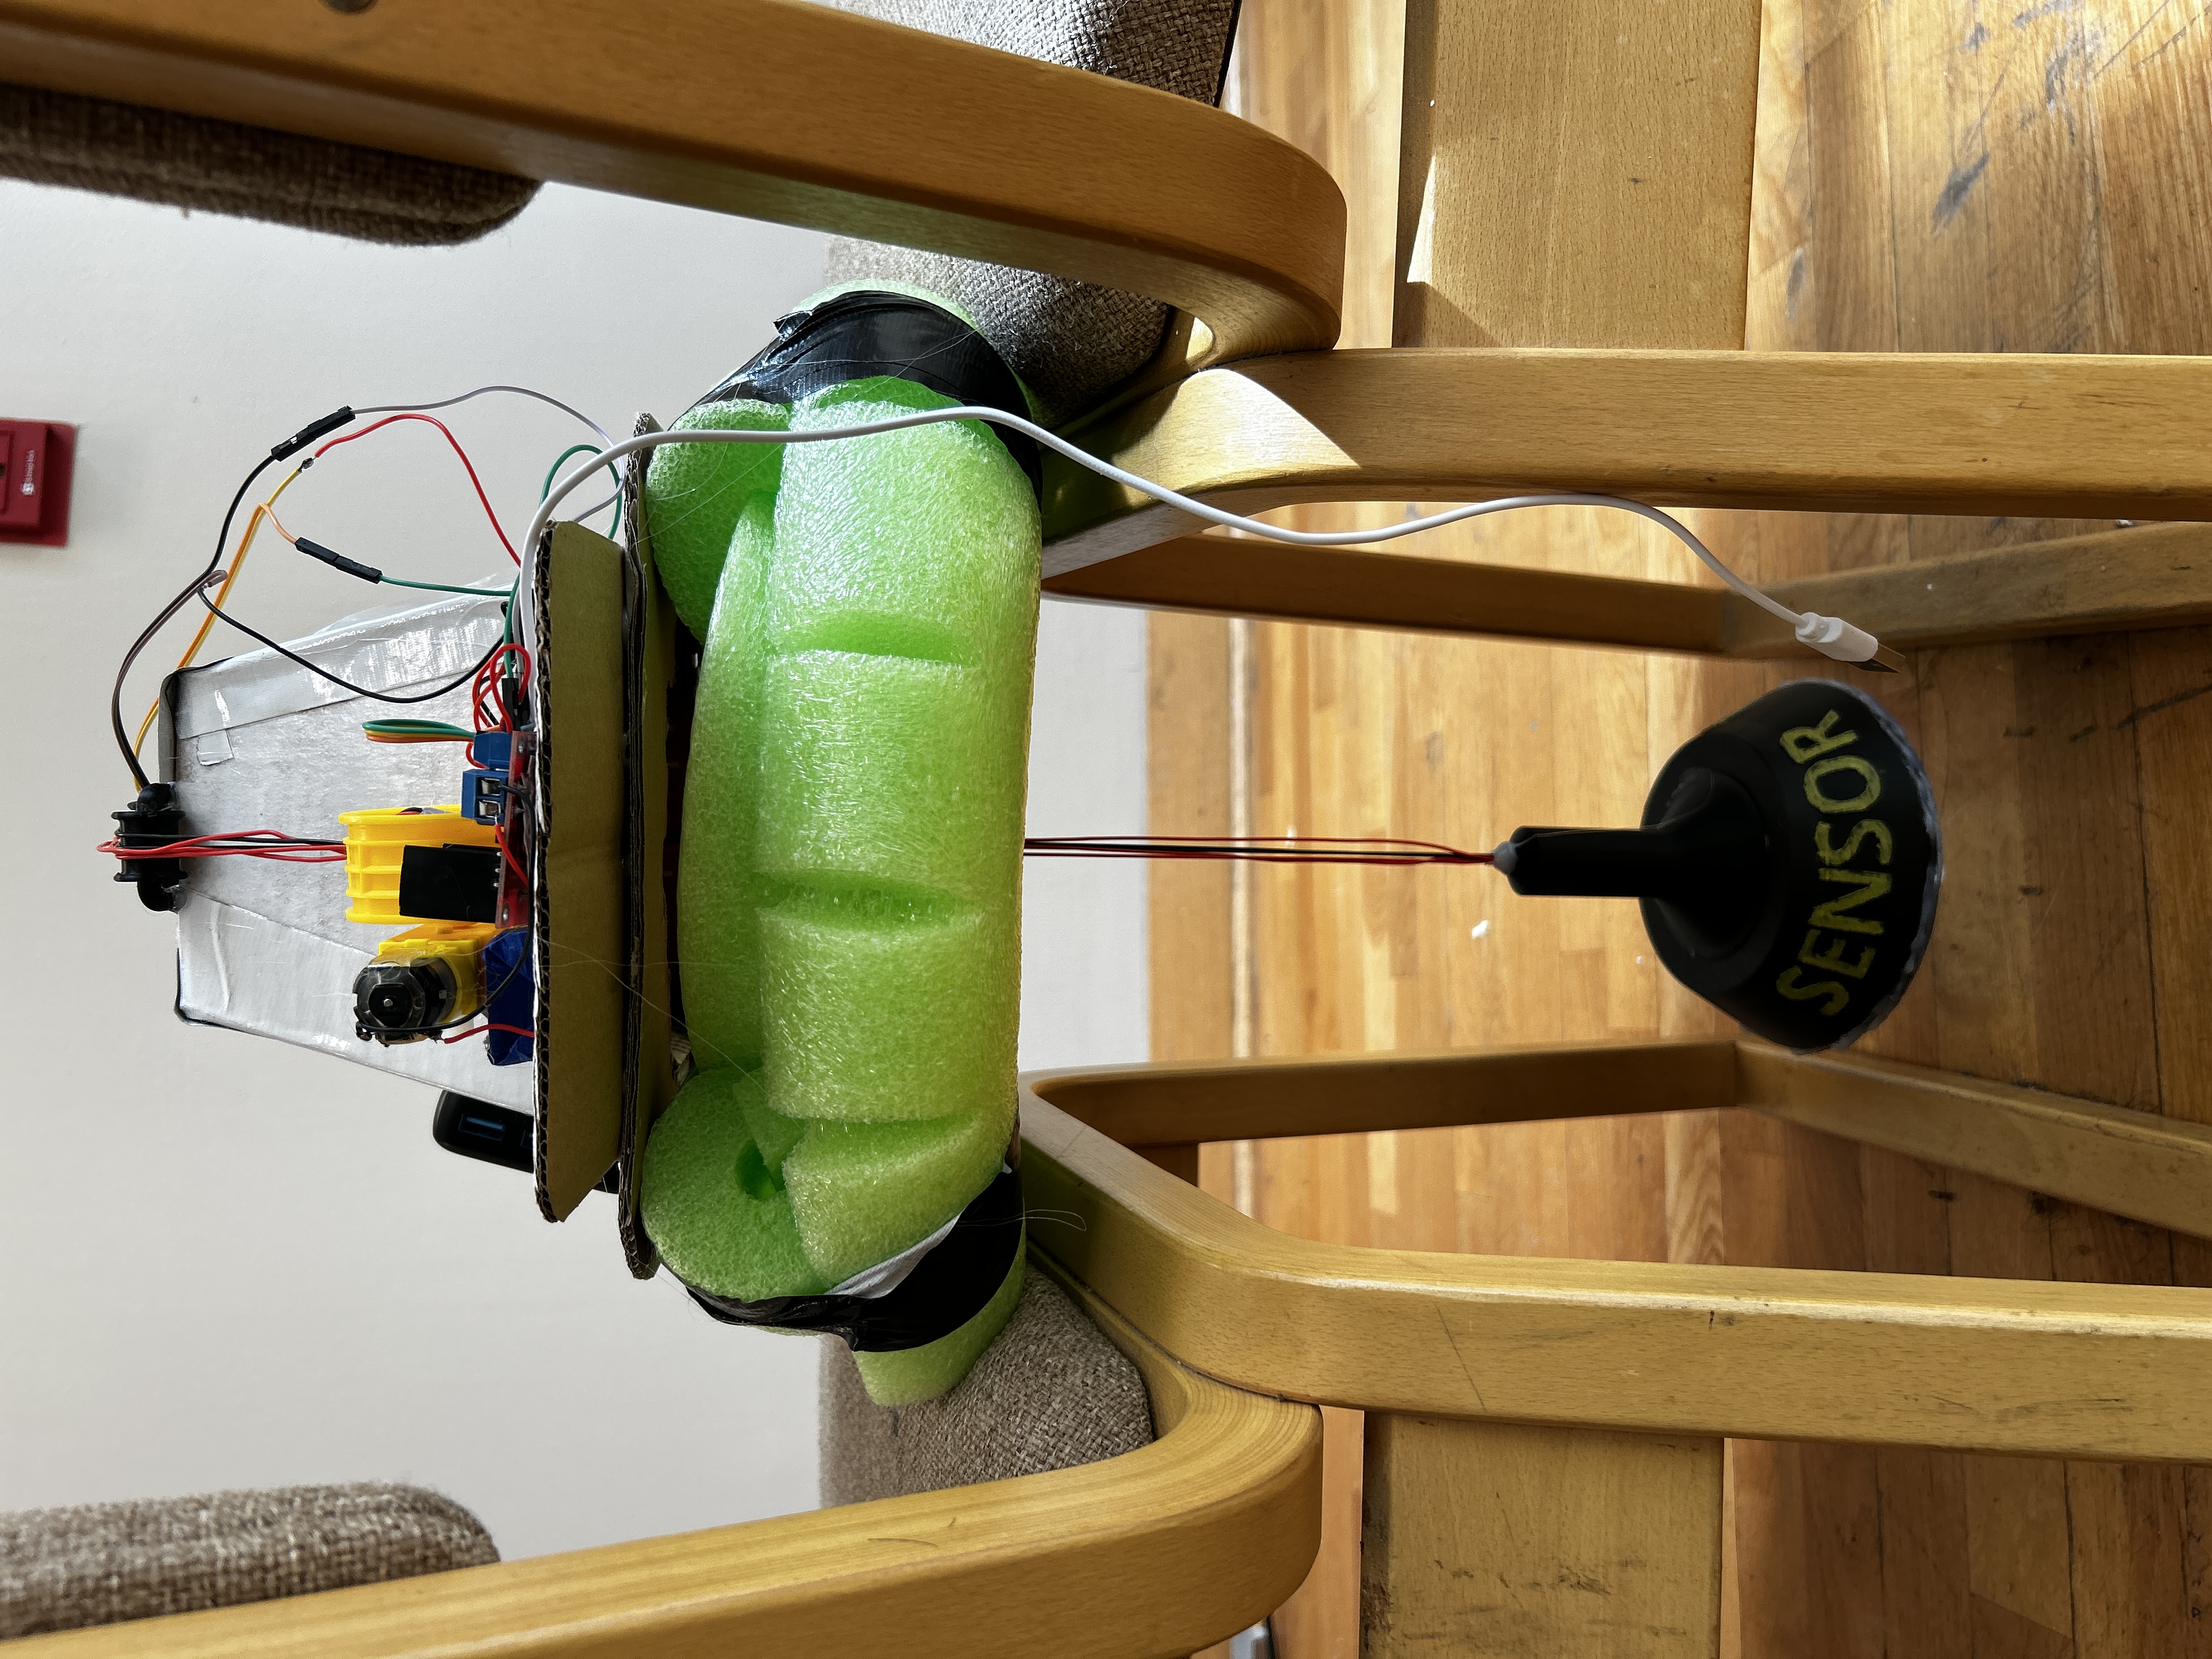
The fully wired SENS Pod shows the complete integration of all sensors, the motor driver, and the ESP32 inside the main hull.
Backend Software
The following ESP32-based embedded system script establishes a WiFi access point to facilitate real-time environmental data acquisition, processing, and transmission. It integrates multiple sensor modalities including a DS18B20 waterproof temperature probe via 1-Wire, a PH-4502C analog pH sensor, a DFRobot turbidity sensor, and a NEO-6M GPS module for real-time location tracking. An L298N motor driver is utilized to control the winch DC motor, allowing the firmware to lower and raise the sensor payload to programmable depths on command.
The system hosts a lightweight REST API web server directly on the ESP32, exposing individual endpoints for each sensor reading as well as a unified /all endpoint that returns a complete JSON snapshot of all sensor data simultaneously. Rather than pushing data to a remote server, the ESP32 broadcasts its own WiFi access point (SSID: SENSPOD) that the frontend connects to directly, eliminating the need for external internet infrastructure and making the system fully self-contained in the field. Motor control is also exposed through the API via /motor/raise, /motor/lower, and /motor/idle endpoints, allowing the frontend to command the winch remotely.
GPS data is parsed in real time from the NEO-6M module using an NMEA sentence parser, processing GPGGA sentences for position, altitude, and satellite count, and GPRMC sentences for speed and fix status. Turbidity readings are stabilized using a rolling average window of 20 samples to smooth out noise from water movement, and the raw ADC voltage is converted to NTU using a calibrated polynomial equation. All sensor readings are cached in a shared struct and refreshed every 2 seconds, ensuring the API always serves up-to-date data without blocking the GPS feed or web server. A sample JSON payload from the /all endpoint looks like the following:
{
  "ph": 7.42,
  "turbidity_ntu": 3.1,
  "temp_c": 26.80,
  "temp_f": 80.24,
  "gps": {
    "valid": true,
    "lat": 25.761681,
    "lng": -80.191788,
    "alt_m": 1.2,
    "speed_kt": 0.02,
    "satellites": 7
  }
}
Frontend Interface
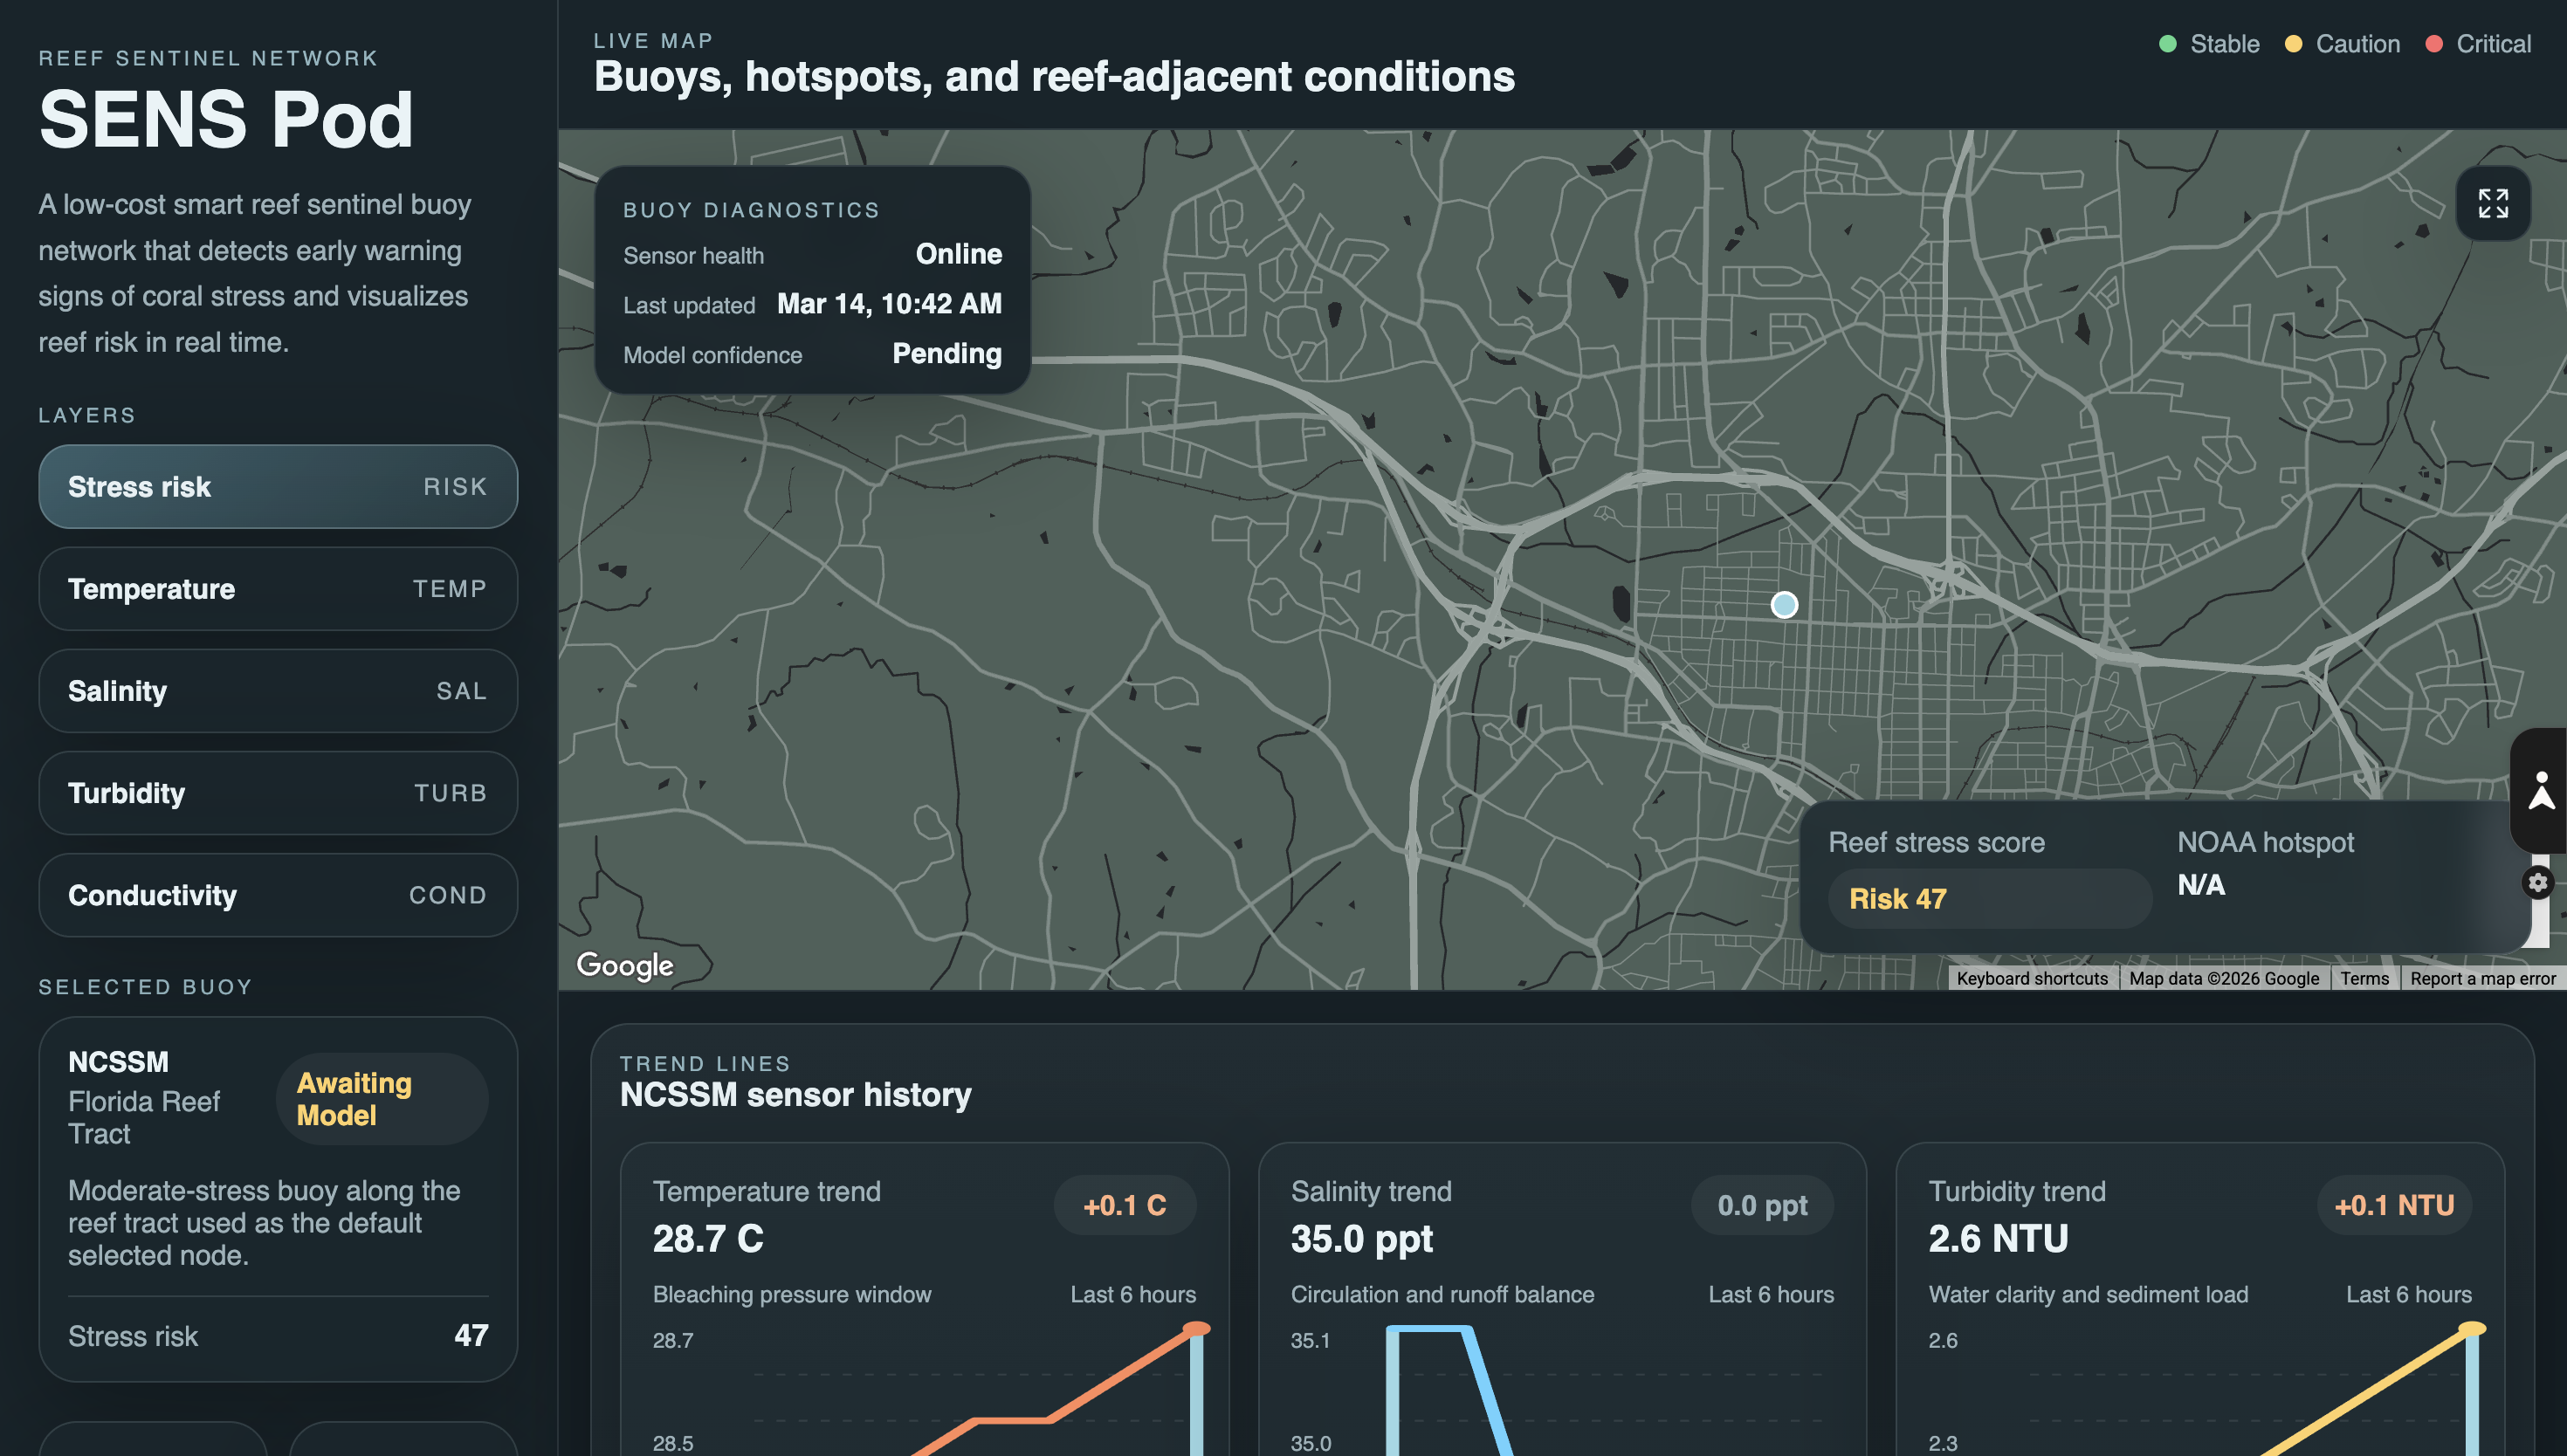
The SENS Pod frontend was designed as a map-first monitoring dashboard that turns raw buoy telemetry into a clear, actionable view of reef conditions. Rather than presenting isolated sensor numbers, the interface centers all active buoy nodes on an interactive geographic map, where each station is visualized with a color-coded marker representing overall reef stress status.
- Green indicates stable conditions
- Yellow indicates caution
- Red indicates elevated reef stress
This allows a judge, researcher, or conservationist to immediately understand where attention is needed most.
The main layout follows a two-panel structure. A navigation panel on the left allows the user to switch between environmental layers including reef stress risk, temperature, salinity, turbidity, and conductivity. The main map occupies the majority of the screen and uses Google Maps with a custom dark ocean-themed style to emphasize marine monitoring regions. Selecting a buoy automatically centers that station on the map and updates the rest of the dashboard to reflect the selected location.
Each buoy is backed by either live or simulated sensor-feed data and displays a detailed diagnostic view when selected. This includes:
- buoy name
- reef stress score
- predicted health label
- NOAA-derived hotspot context
- live environmental metrics
The dashboard also includes trend visualizations for the most important time-series measurements, allowing the user to see how temperature, salinity, and turbidity have changed over the previous several hours rather than relying on a single static reading.
To help surface urgent conditions, the frontend includes hotspot visualization overlays and an anomaly system. High-risk buoys generate colored hotspot circles on the map, making reef stress regions visible spatially instead of only numerically. A critical alert feed highlights threshold-breaking conditions in real time, and a zone watchlist identifies the highest-priority monitoring areas. Fullscreen map mode is also supported so that users can focus entirely on spatial reef conditions during presentations or live demonstrations.
The frontend is implemented in React and connected to a backend inference pipeline that enriches buoy coordinates with nearest-grid NOAA coral stress data and feeds the combined feature set into a trained random forest model. The result is a live interface that does not simply display sensor telemetry, but translates it into interpretable reef-health intelligence for decision-making.
Impact
SENS Pod addresses a critical gap in coral reef monitoring by providing continuous, high-resolution, multi-point environmental data that simply does not exist at this scale today. Current reef monitoring relies on infrequent manual dive surveys and isolated static sensors that capture a single point in space. SENS Pod replaces this with a distributed mesh network of buoys that collectively monitor an entire reef zone in real time, giving researchers and conservationists the kind of spatial and temporal coverage needed to actually understand how reef health is changing.
The machine learning layer transforms raw sensor data into actionable reef health predictions, shifting conservation efforts from reactive to predictive. Rather than responding to a bleaching event after it has already begun, SENS Pod flags rising thermal stress, declining pH, and abnormal turbidity before visible damage occurs, giving teams a window to intervene. The critical anomaly feed and zone watchlist on the frontend dashboard means that a researcher does not need to manually review sensor logs to know when something is wrong: the system surfaces the most urgent threats automatically.
From a scalability standpoint, the modular and low-cost design of SENS Pod means that coverage can be expanded simply by deploying additional pods into the mesh network, with no changes to the existing infrastructure. Each new pod automatically joins the network and begins contributing data. This makes SENS Pod accessible not just to well-funded research institutions but to local conservation organizations and governments in reef-rich developing nations where coral reefs are most at risk and monitoring resources are most scarce.
Future Work
Future development of SENS Pod will focus on four key areas. First, integrating dissolved oxygen and chlorophyll-a sensors into the payload would significantly expand the biological picture of reef health beyond the physical and chemical parameters currently measured. Second, implementing TinyML models directly on the ESP32 would allow each pod to perform edge-level anomaly detection without needing a connection to the frontend, making the system more robust in low-connectivity deployments. Third, replacing the current WiFi access point architecture with LoRaWAN or cellular data transmission would dramatically extend the range over which pods can operate from shore, enabling deployment on more remote reef systems. Finally, developing a standardized data sharing API would allow SENS Pod data to be ingested directly by platforms like NOAA's CoralWatch or the Allen Coral Atlas, amplifying the scientific impact of every deployed network.


Log in or sign up for Devpost to join the conversation.