-
-
Schuylkill Sentinel
Inspiration
Walk along Kelly Drive at sunrise and you'll see crews on the water, kayakers launching at Bartram's Garden, and people fishing off Penn's Landing. What most of them don't know is that Philadelphia's sewers are combined: stormwater and sewage share the same pipes. After a heavy rain (sometimes only a quarter inch), those pipes overflow by design, dumping raw sewage into the Schuylkill and Delaware through about 160 outfalls.
The data to see it coming is public. USGS runs real-time gauges measuring river level, flow, and turbidity every 15 minutes, and rain forecasts are free. But it's spread across agency websites and written for hydrologists. We wanted to answer the one question a rower actually asks: "Is the water OK today?" And for this aquatic-themed OwlHacks, what better river than the one right down the road from Temple?
What it does
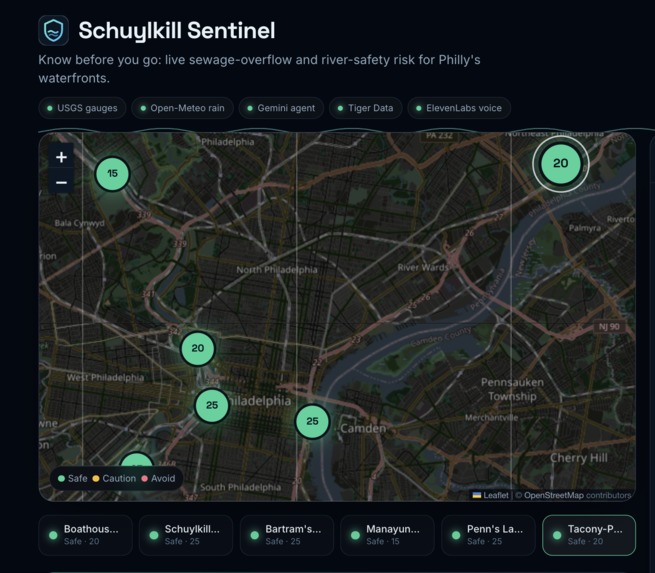
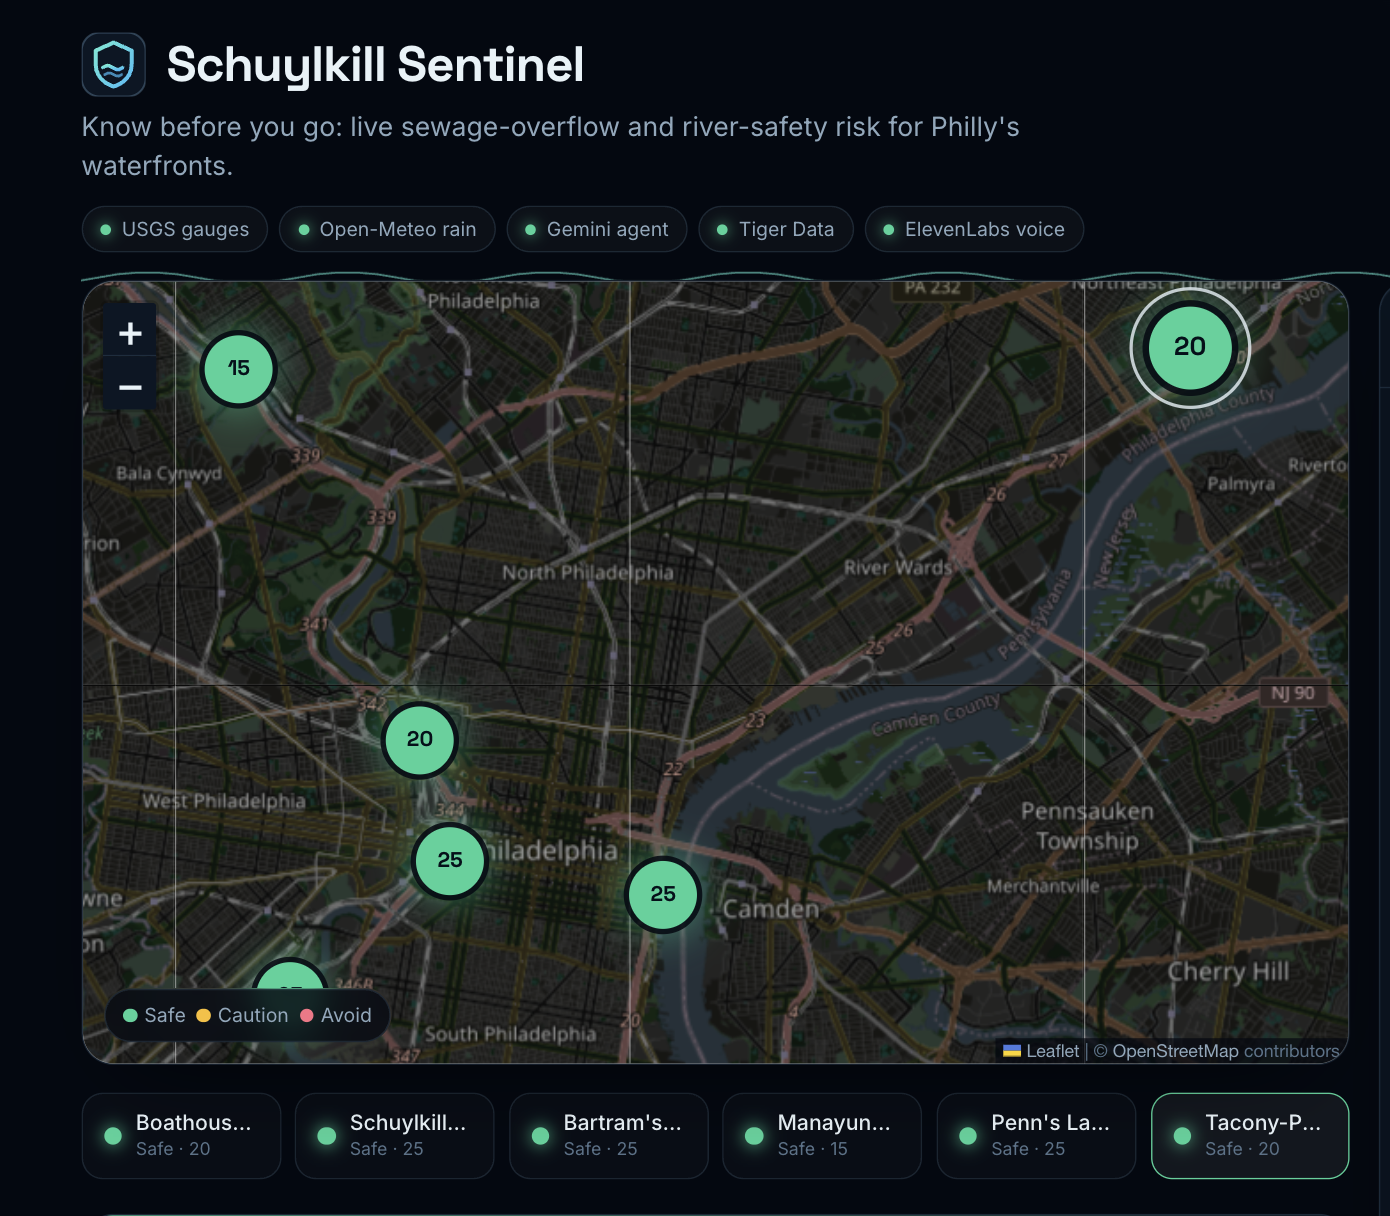
- A live map of six Philly riverfront spots, each scored 0–100 and colored green, yellow, or red.
- Spot cards explain why: rain in the last 24h, turbidity, how fast the river is rising, flow compared to normal for the month, water temperature, tide caveats. They also give a verdict for each activity. Rowing tolerates more than wading with your dog, and swimming is always a no.
- Ask the Sentinel, a Gemini agent: "Can I kayak at Bartram's Garden tomorrow morning?" It calls real tools (river gauges, rainfall, our risk model) and you watch its reasoning trace stream in live: each thought, tool call, and result, then a one-line verdict.
- Read aloud plays the verdict with an ElevenLabs voice.
- Alerts: subscribe to be told when your spot turns red.
- Demo mode replays a realistic thunderstorm so you can see the red state on a dry day.
How we built it
- Next.js 15 + TypeScript + Tailwind for the app, Leaflet with night-styled OpenStreetMap tiles for the map, and Recharts for the 72-hour rain-and-gauge chart.
- Data: the USGS Instantaneous Values API across four gauges and five parameters, plus Open-Meteo hourly precipitation for the past 72h and next 48h. Before writing any model code we hit every endpoint to see what each gauge actually reports, which caught a wrong site ID in our own plan (01474000 is Wissahickon Creek, not the Schuylkill at Norristown).
- Risk model: a transparent, rule-based score. Each factor returns points plus a plain-English reason. CSO likelihood uses 24h rain windows with a 48-hour decay, weighted by how many outfalls drain near each spot. Future questions rescore using forecast rain.
- Gemini: the
@google/genaiSDK withgemini-3.5-flash, function calling (5 tools, including parallel calls), and thought summaries. One code path runs on either a Gemini API key or Vertex AI via ADC. The server streams newline-delimited JSON events that the UI renders as a live trace. - Tiger Data: every reading we fetch goes into a TimescaleDB hypertable. A continuous aggregate (
time_bucket('1 hour')) powers the chart. A compression policy keeps history cheap, and agent traces and alert subscriptions live alongside it. - ElevenLabs text-to-speech for the verdict, falling back to the browser's speech synthesis.
- Vultr: a multi-stage Docker image (Next.js standalone) running on a Vultr Cloud Compute instance.
- Vitest: 48 tests covering each risk factor, band boundaries, decay, the parsers (on real captured responses), and the agent route in every failure mode.
Challenges we ran into
- Rivers are messier than APIs. The Penn's Landing gauge publishes an empty data block first and the real barge sensor data second. Its "discharge" is tidal flow in both directions, and its water level swings about 6 ft with the tide, so "river rising" means nothing there. We had to model tidal gauges differently rather than pretend to precision.
- Every spot looked the same. One city-wide rain number gave all six spots identical scores, which isn't true: outfalls cluster on the tidal lower Schuylkill and the central Delaware. We added an outfall-exposure weight per spot.
- Venue Wi-Fi. The demo has to work even if USGS, Open-Meteo, or Gemini is unreachable. Every source has a real cached fixture, a banner shows the cache time, and if Gemini fails an offline agent runs the same tools on the same data.
- Time zones and "tomorrow morning." The model once assumed the wrong year. We now give it an explicit ISO timestamp in Philly time, and the tool refuses to "assess" dates in the past.
Accomplishments that we're proud of
- The reasoning trace. You can see Gemini pull the gauge, check the rain, run the model, and even notice and correct its own mistake.
- Every number is explainable. The agent and the UI show the same reason strings. No black box.
- It never shows a blank screen. We tested each failure mode.
- It works on a phone at the boathouse.
What we learned
- How Philadelphia's combined sewer system works, and why a quarter inch of rain matters.
- USGS parameter codes, method blocks, and what "provisional" data means.
- Why time-series databases exist: every question we ask is about a window (last 24h, rise rate, hours since the storm), and hypertables and continuous aggregates make those queries natural.
- Designing agents for graceful degradation: tools should be deterministic and shared, and the LLM is the narrator.
What's next for Schuylkill Sentinel
- Calibrate on ground truth: fit per-spot thresholds from our stored history against PWD's CSO event records and bacteria sampling.
- Weight each spot by the actual outfalls upstream of it, and add NOAA tide predictions to model sewage pushed upstream on flood tide.
- Real alerts: a scheduled TimescaleDB job evaluates subscriptions and sends email or SMS.
- Every combined-sewer city. Roughly 700 US communities have CSOs. The model only needs gauges and rain.
Built With
- elevenlabs
- gemini
- godaddy
- google-genai
- leaflet.js
- next.js
- open-meteo
- openstreetmap
- postgresql
- react
- recharts
- tailwindcss
- tiger-data
- tigerdata
- timescaledb
- typescript
- usgs-water-services
- vertex-ai
- vultr


Log in or sign up for Devpost to join the conversation.