-
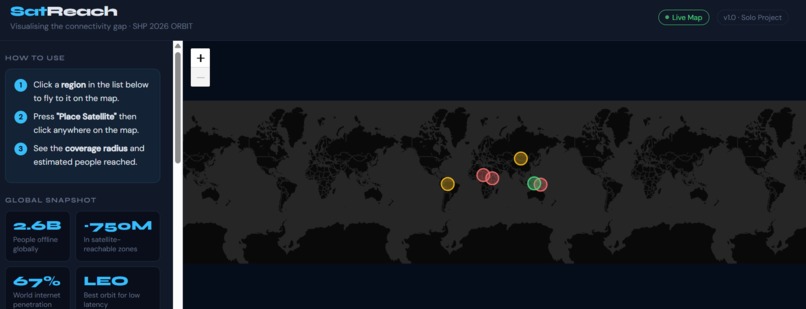
overview of website

What Inspired Me
I am Kenyan, studying in Indonesia at President University. Growing up between two countries that both have real connectivity gaps in rural and remote areas, the digital divide is not an abstract concept for me. I have family in parts of Kenya where a stable internet connection is not guaranteed. When I saw the ORBIT theme for SHP 2026, my first thought was not rockets or debris. It was the people on the ground who could benefit most from what is happening in orbit.
Satellites are often talked about in the context of scientific achievement, but the most immediate benefit for billions of people is simply internet access. I wanted to build something that made that gap visible to anyone, not just engineers or policymakers.
What I Built
SatReach is a browser-based interactive map that visualises the internet connectivity gap in underconnected regions and simulates what LEO satellite coverage could look like if a satellite were placed over those areas.
You can:
- Click any of the 6 underconnected regions in the sidebar to fly to it on the map
- Press Place Satellite and click anywhere on the map
- Instantly see the satellite's 1,200 km coverage footprint and an estimate of how many offline people it could reach
The six regions in SatReach are:
| Region | Country | Connectivity |
|---|---|---|
| Sub-Saharan Africa | Chad / Niger / Mali | 18% |
| Papua New Guinea Highlands | Papua New Guinea | 11% |
| Amazon Basin | Brazil / Peru / Colombia | 30% |
| Central Asia Steppe | Mongolia / Kyrgyzstan | 38% |
| East African Rift | Ethiopia / South Sudan | 22% |
| Indonesian Archipelago | Indonesia (Eastern islands) | 48% |
Data sourced from the ITU and World Bank 2023 datasets.
How I Built It
The project is built with vanilla HTML, CSS, and JavaScript — no frameworks, no backend. It runs entirely in the browser by opening index.html.
Key technical choices:
- Leaflet.js for the interactive map with CartoDB dark tiles
- Haversine formula to calculate real distances between GPS coordinates on a sphere
- LEO footprint radius of 1,200 km based on a realistic 550 km altitude orbit (similar to Starlink)
- Population estimates use a proximity overlap model with a 40% reachability factor to reflect terrain and access limitations
The coverage estimate works like this:
$$\text{reached} = \sum_{i} \text{pop}_i \times (1 - \frac{d_i}{r}) \times (1 - \text{connectivity}_i) \times 0.4$$
Where \( d_i \) is the distance from the satellite to region \( i \), and \( r \) is the satellite radius.
The Haversine formula used to calculate \( d_i \):
$$d = 2R \arctan\left(\sqrt{\frac{a}{1-a}}\right)$$
$$a = \sin^2!\left(\frac{\Delta\phi}{2}\right) + \cos\phi_1 \cos\phi_2 \sin^2!\left(\frac{\Delta\lambda}{2}\right)$$
Challenges I Faced
The biggest challenge was working with Leaflet.js for the first time. I had never used a map library before and the event handling for clicking on the map versus clicking on markers took a while to get right. I also had to understand the Haversine formula from scratch, which involved more math than I usually work with as someone whose focus is cybersecurity, not GIS.
Building solo meant there was no one to split the problem with. Every bug was mine to fix. That was frustrating at times but it also meant I actually understood every line of code by the end.
Another challenge was making the population estimate feel honest. I did not want to show inflated numbers, so I added the 40% reachability multiplier specifically to account for the fact that satellite coverage does not automatically mean connectivity. People still need devices, electricity, and affordable data plans.
What I Learned
- How to use Leaflet.js and bind interactive events to map layers
- How the Haversine formula works and why it matters for geospatial calculations
- How to structure a project across separate HTML, CSS, and JS files properly
- How to read and work with ITU and World Bank open datasets
- That the digital divide is even more visible once you put it on a map
AI Disclosure
I used Claude by Anthropic to help debug JavaScript event handling in Leaflet, understand the Haversine formula, and get feedback on my CSS layout. The project idea, region selection, data research, and all final decisions were my own.


Log in or sign up for Devpost to join the conversation.