Satellite Flood Mapping and Road Access
Inspiration
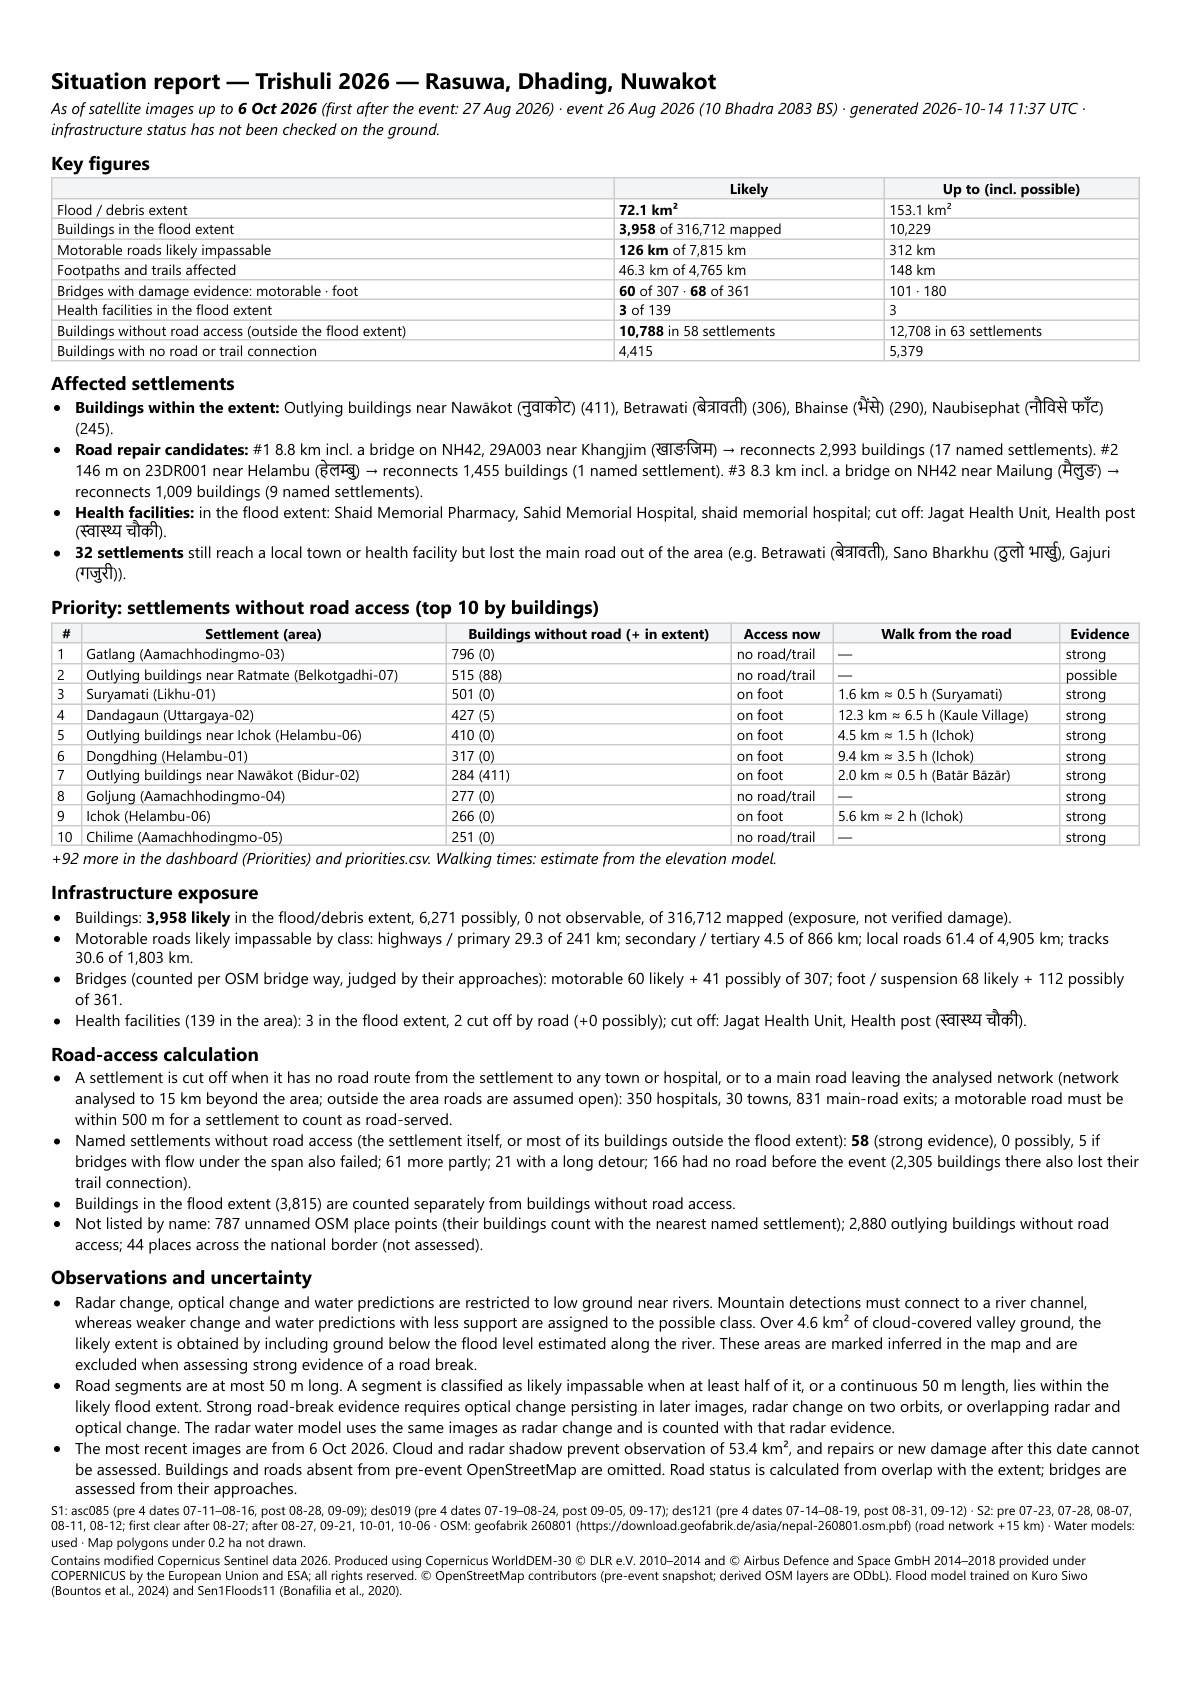
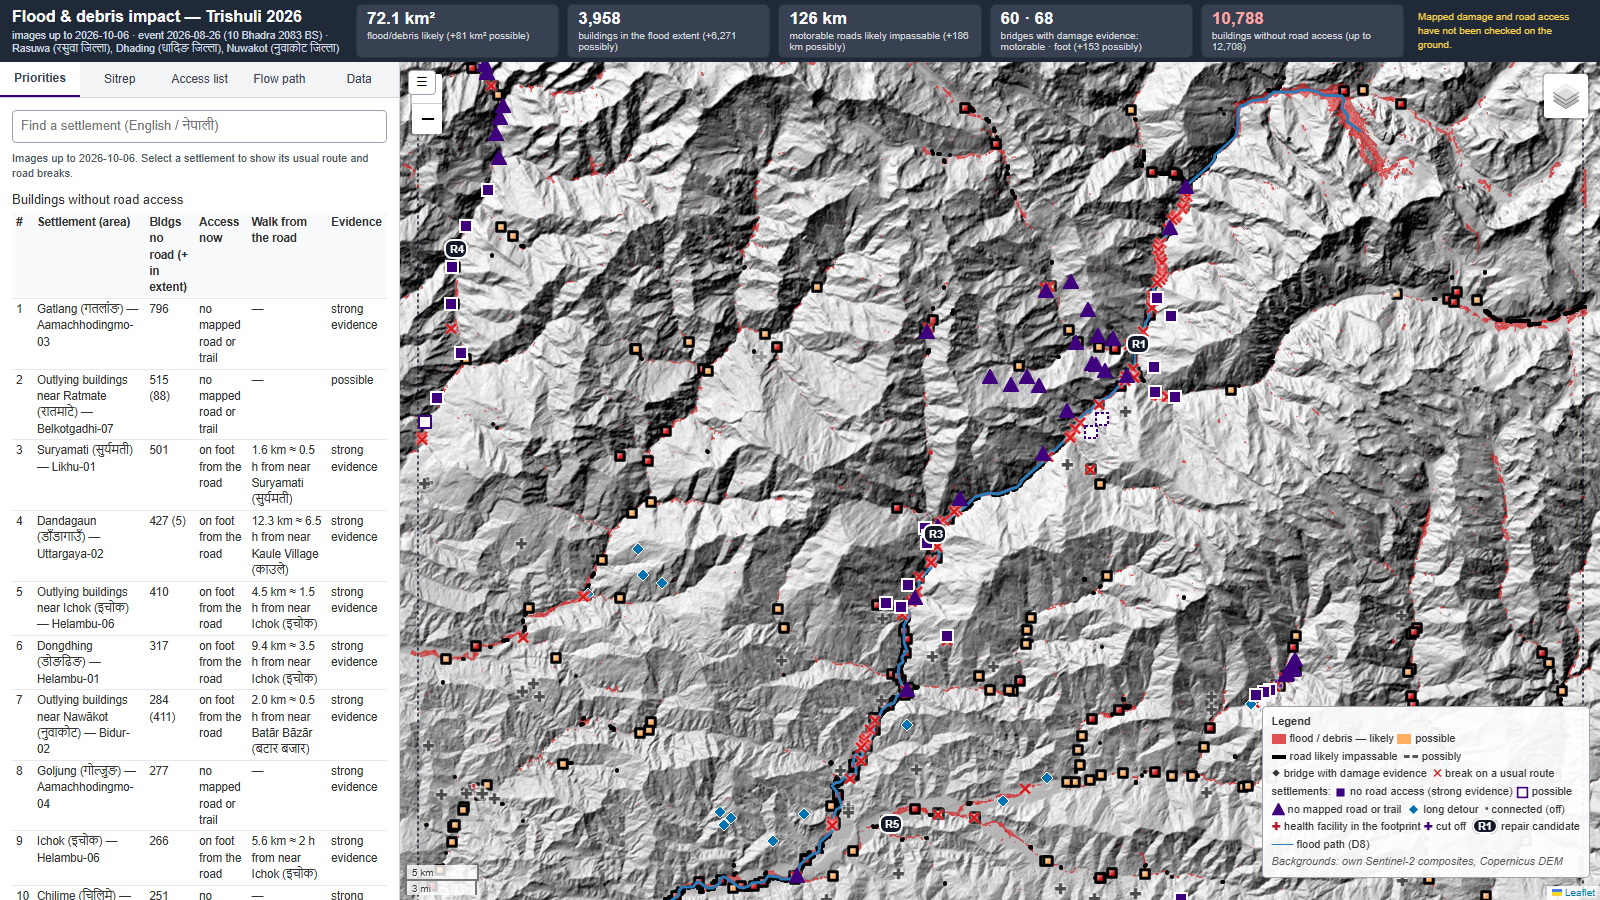
The Bhote Koshi–Trishuli flood of 26 August 2026 left water and debris along the river corridor, where damage to a road or bridge can also disconnect settlements farther up the valley. These settlements need not lie within the flood extent. Satellite change observations are compared with the pre-event road network to identify the affected roads, and routes are calculated again with these roads removed to find settlements that have lost access to a town or hospital.
What it does
For a supplied area and flood date, satellite images acquired before and after the flood are compared to map the likely and possible flood extent, with ground that cannot be observed marked separately. Buildings, roads and bridges are obtained from pre-event OpenStreetMap. Settlements without a remaining road route are listed with their usual route and the breaks on that route, while walking time is calculated where a mapped trail still connects the settlement to a road.
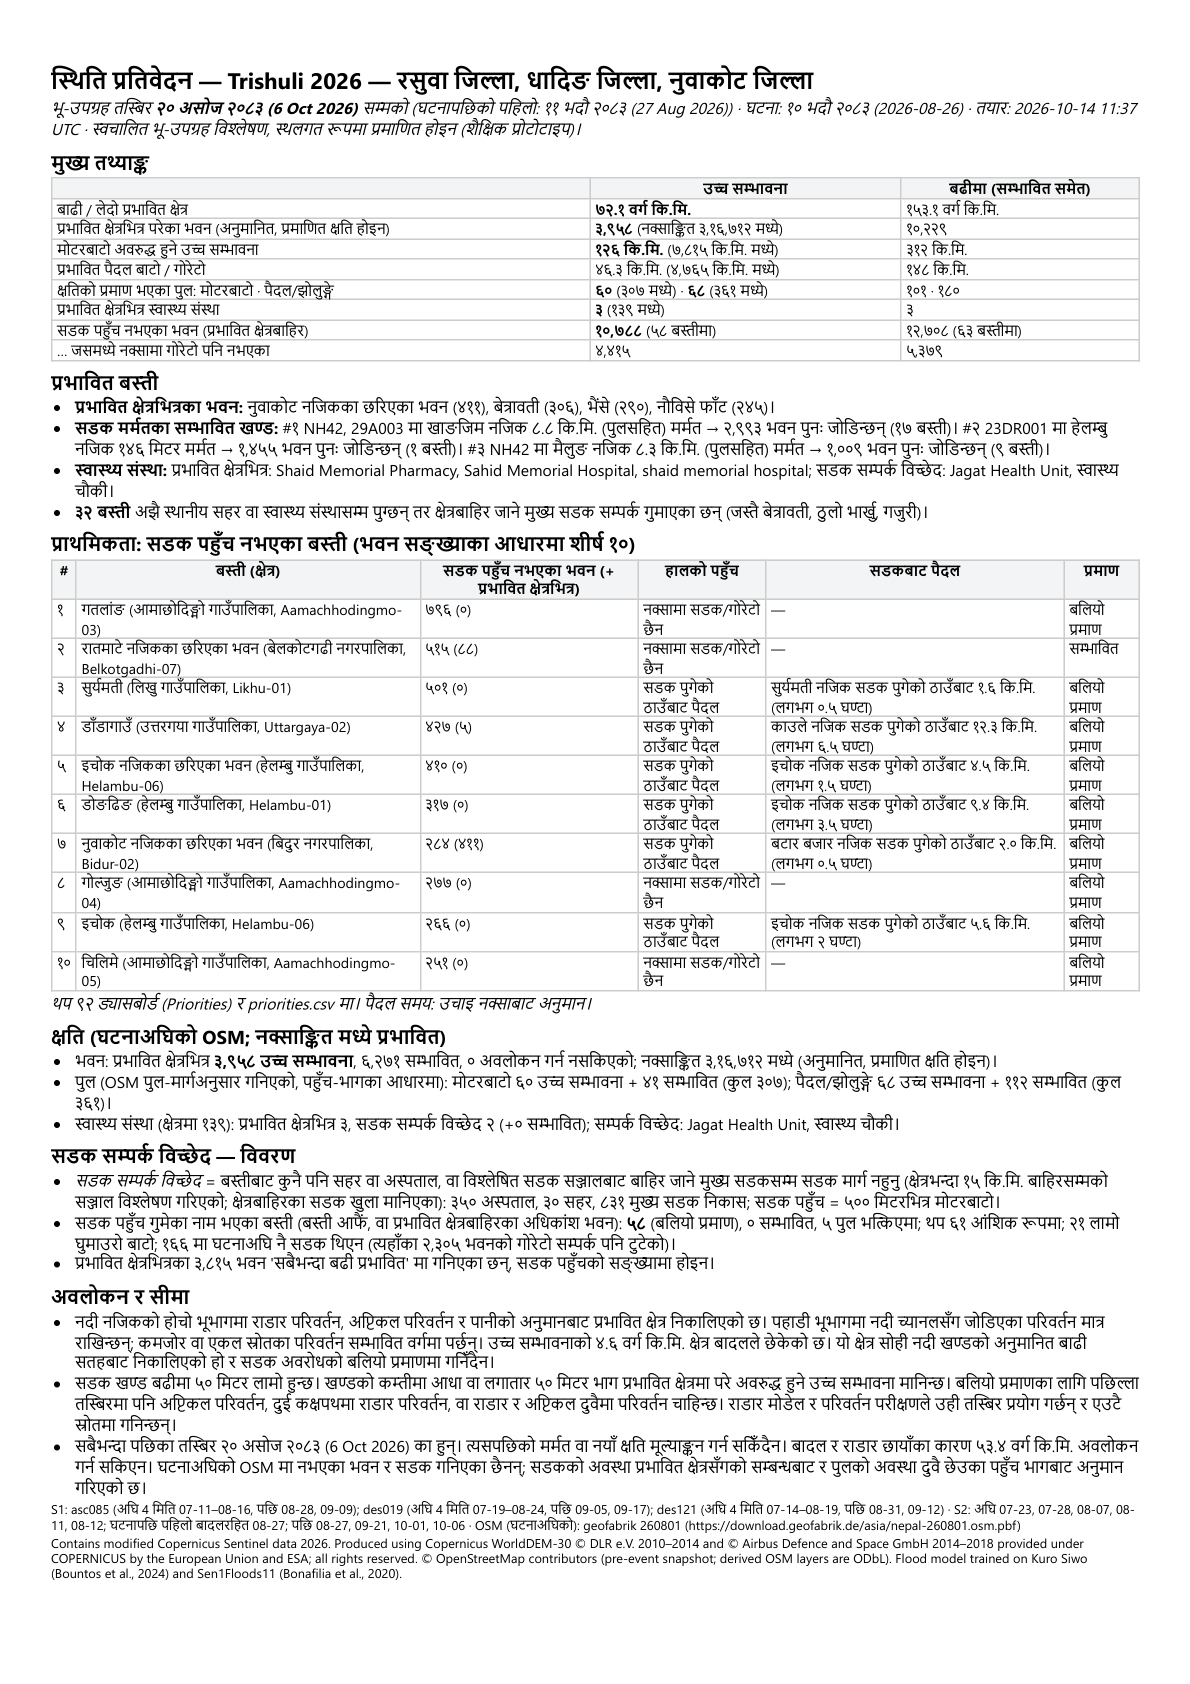
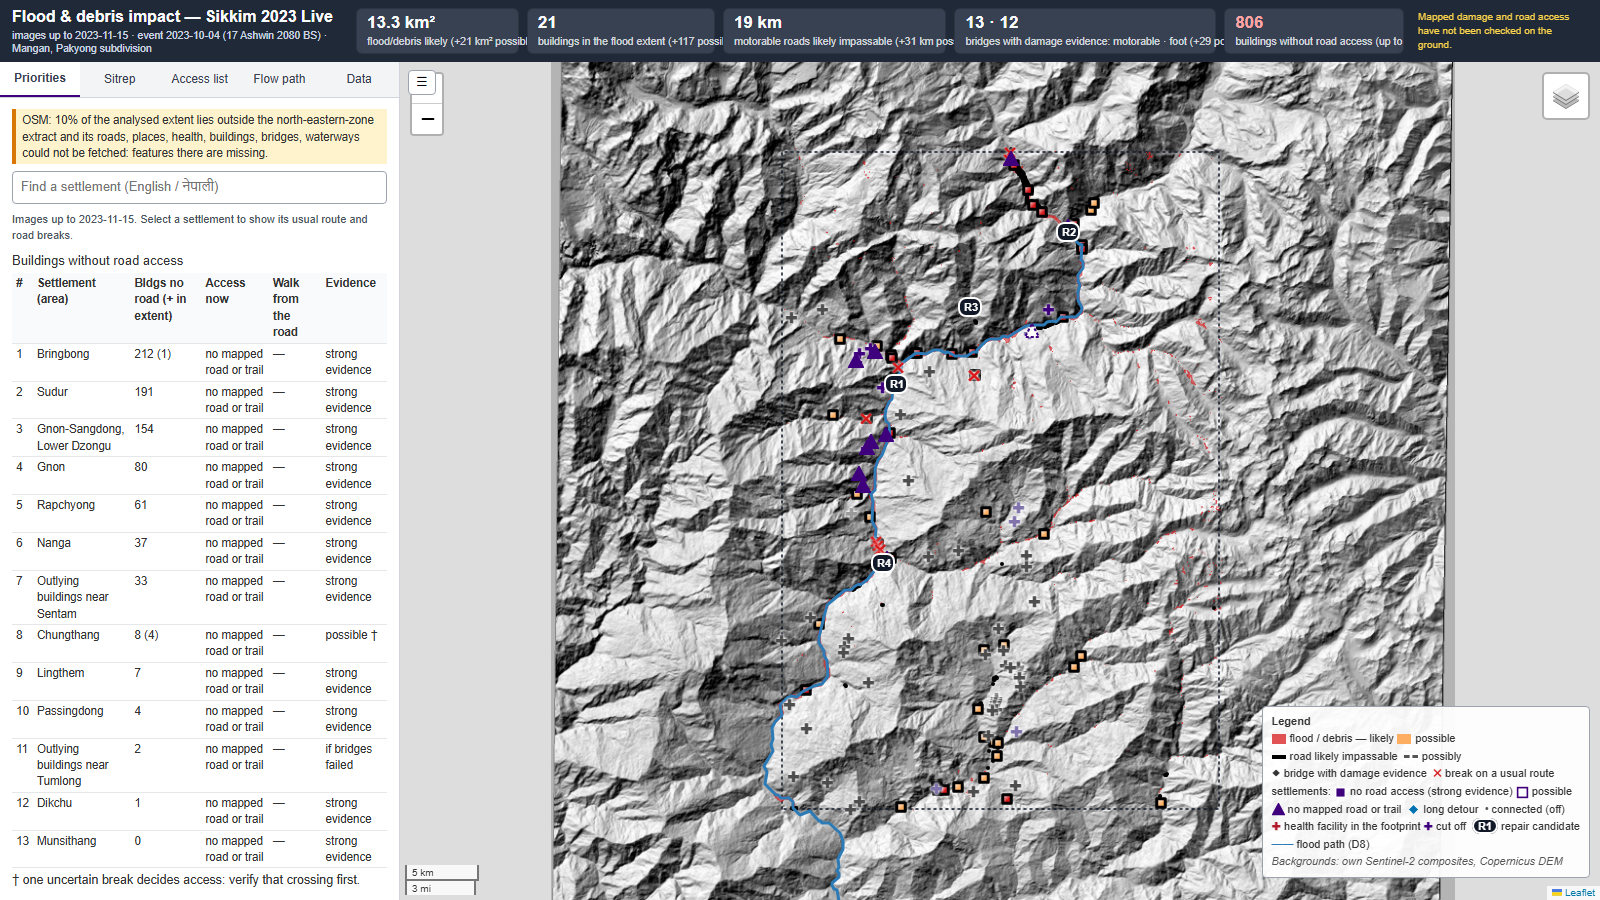
The dashboard contains these map layers, settlement lists and repair candidates. The same counts are written to one-page reports in English and Nepali. An upstream point can also be supplied to trace drainage down the valley and list settlements along the drainage path.
How we built it
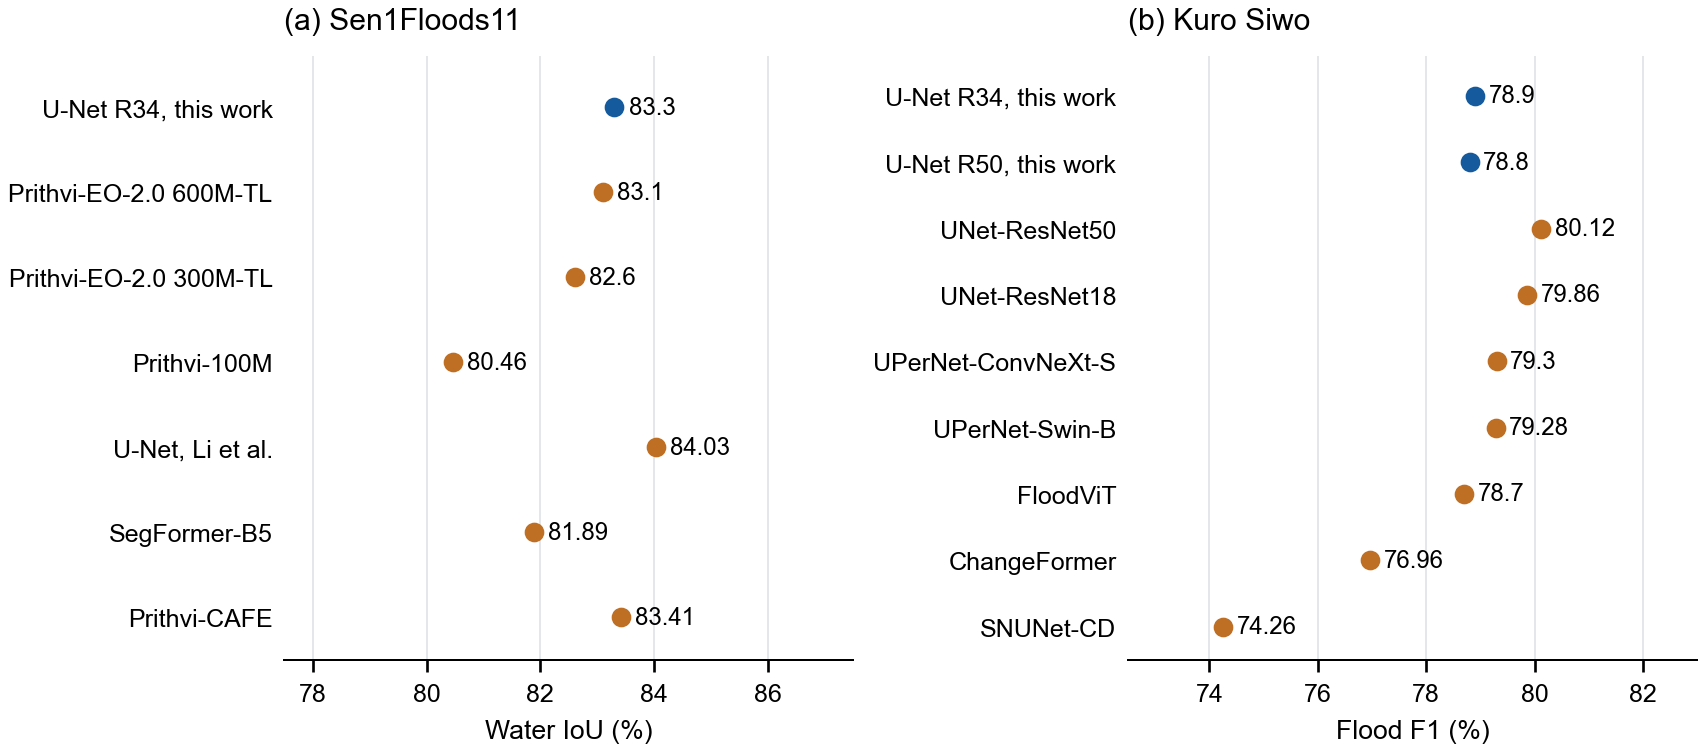
Sentinel-1 GRD is calibrated and terrain-corrected using the Copernicus DEM. Radar acquisitions are compared within each orbit track, with change thresholds estimated from pre-event observations. Optical change provides vegetation loss, bare-ground change and new water where clear images are available. A radar U-Net ensemble trained on Kuro Siwo and Sen1Floods11, and an optical U-Net trained on Sen1Floods11, provide water probabilities. The optical model has held-out test IoU 0.833.
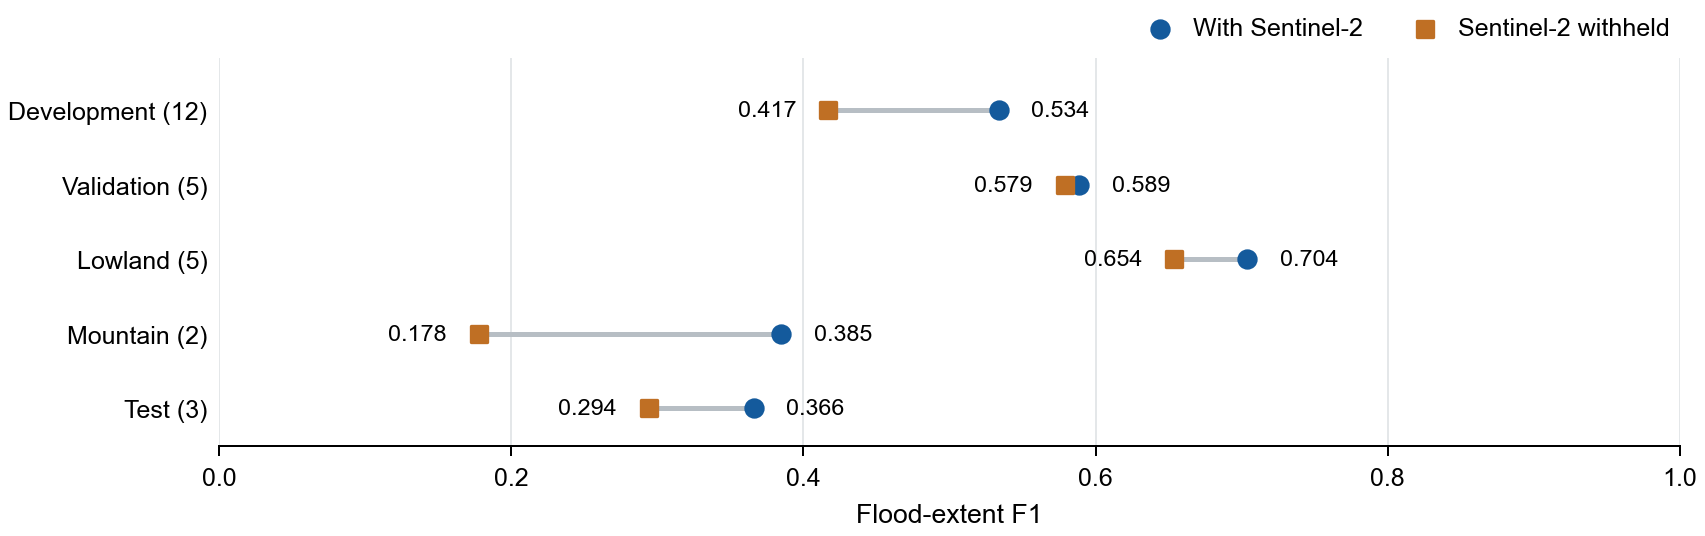
Slope and height above drainage are used when the observations are combined, since radar geometry and seasonal vegetation change can produce detections on the valley sides. Mountain detections must connect to a river channel; large low plains use the water predictions directly because water already present before the flood can show little additional change. Where cloud prevents optical observation, the flood level is estimated along the river from the available detections and valley ground below that level is added to the extent. These areas are marked as inferred in the map, and road breaks require stronger observations. Radar change and radar water predictions share their input images and are counted together when road breaks are assessed.
Results
| Evaluation | Flood-extent F1 | Status |
|---|---|---|
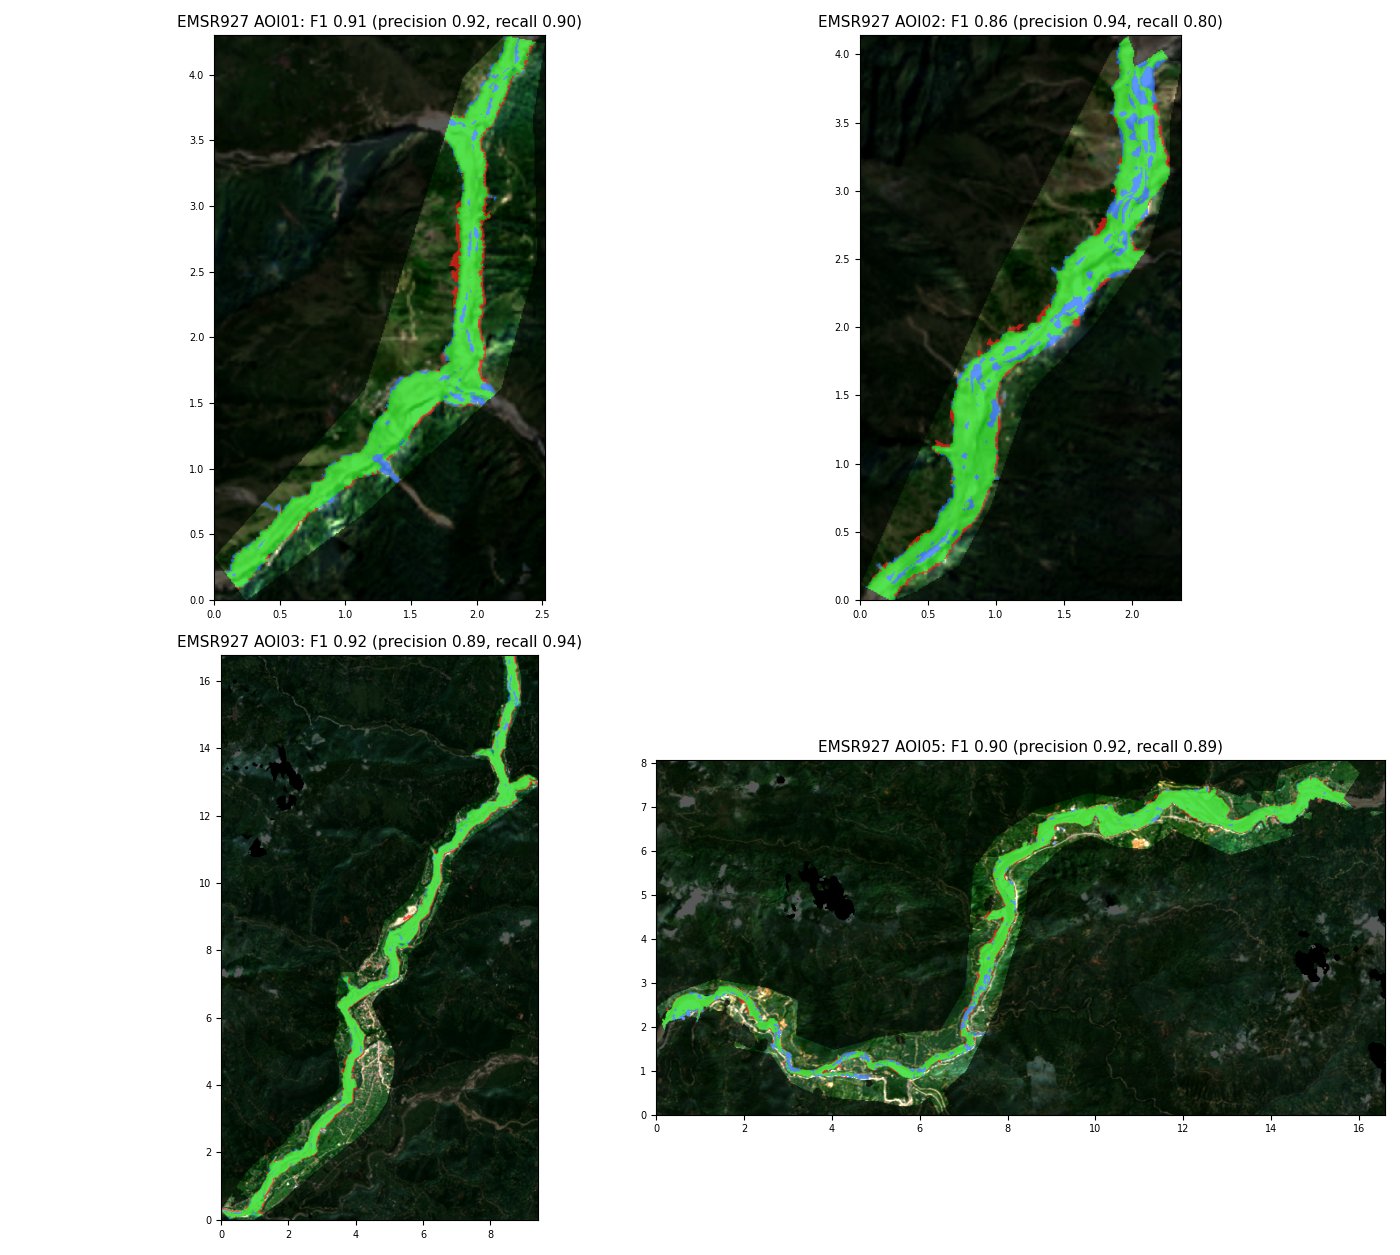
| Trishuli against EMSR927 | 0.906 | Development case study |
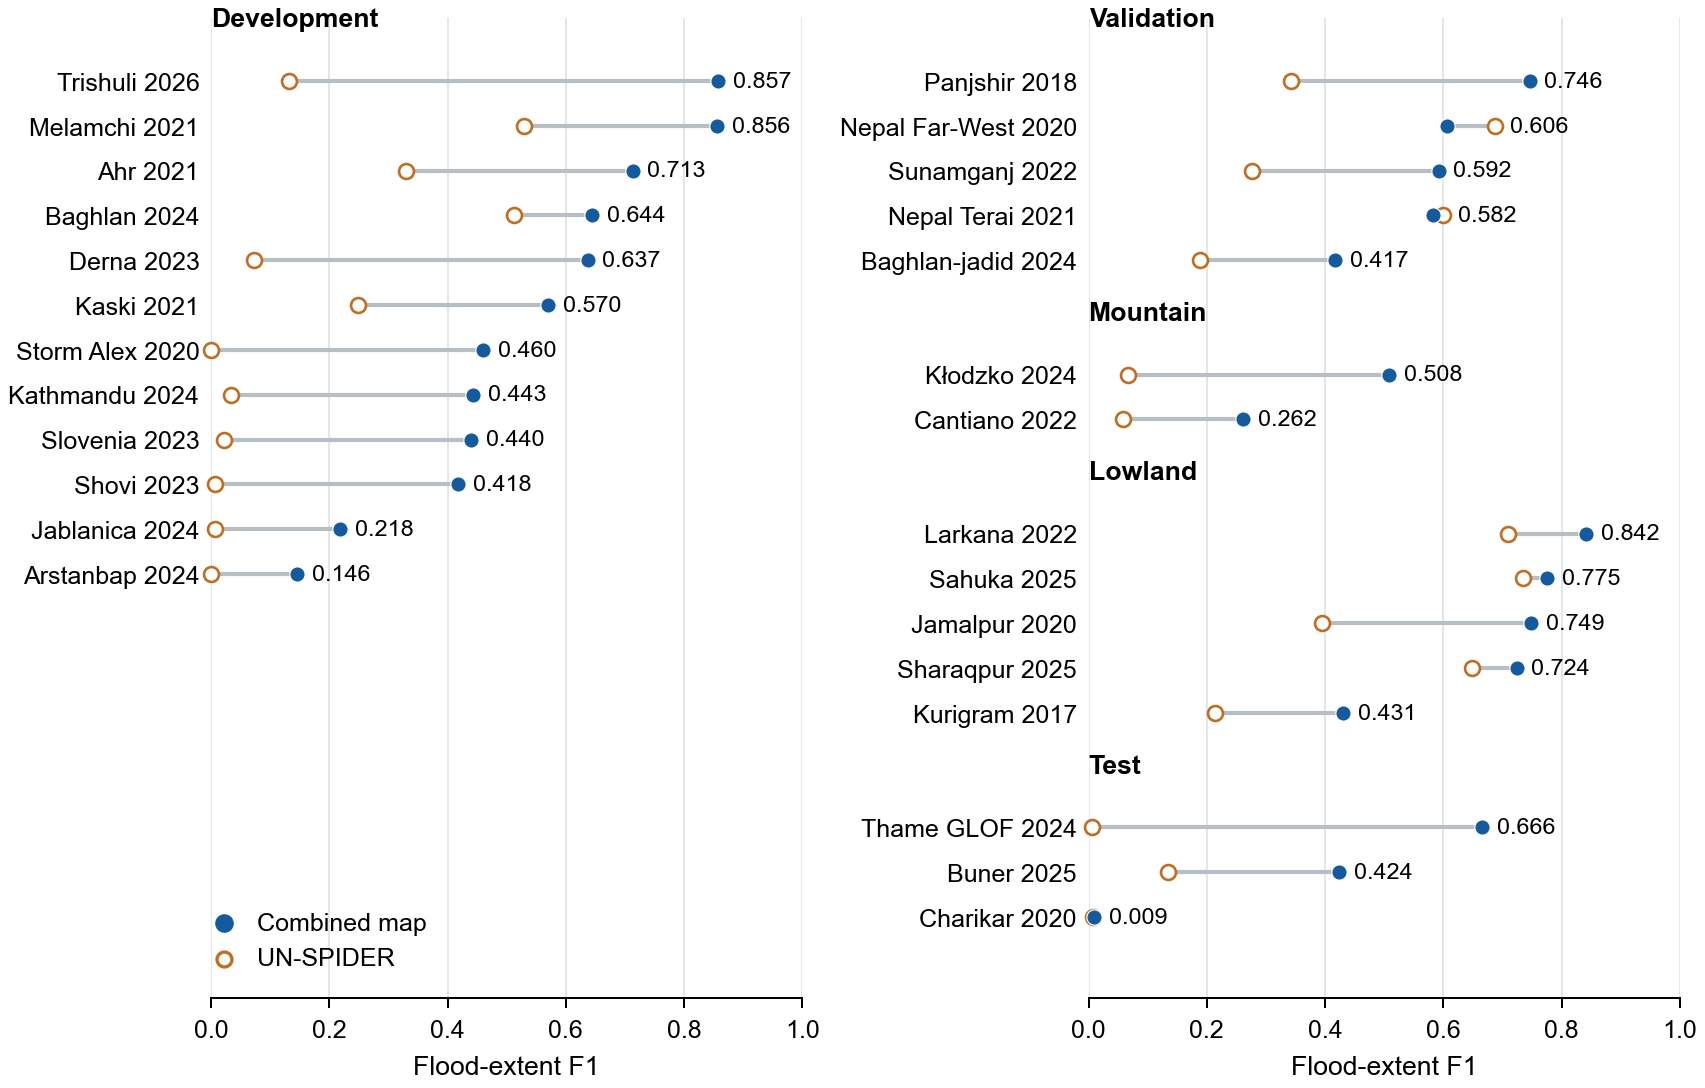
| Thame GLOF 2024 | 0.666 | Locked event, scored once |
| Five fresh lowland floods | 0.704 | The last two events were scored after the candidate rule was specified; their scores were used to accept it |
| Three locked events | 0.366 | Scored once |
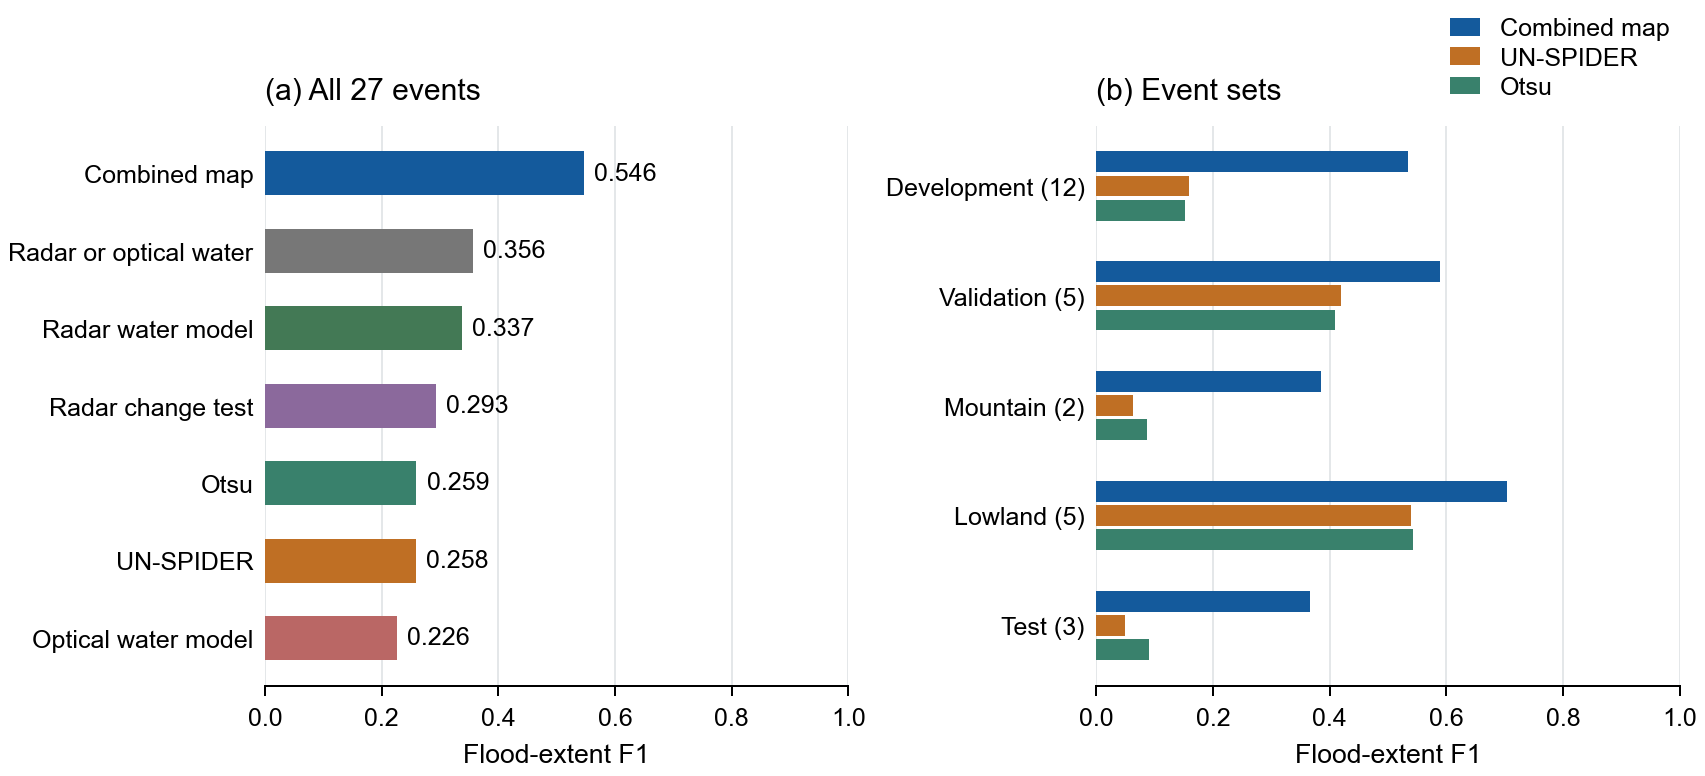
| All 27 benchmark events | 0.546 | Includes development events |
Excluding snow when selecting optical dates raised Kaski F1 from 0.570 to 0.591, with the twelve-event development mean changing from 0.5335 to 0.5351. Two additional flood areas, Tzermiado and San Sebastiano, score 0.477 and 0.235 with either selection. The change is retained, but has not improved these additional cases.
On the same 27 events, the implemented UN-SPIDER radar method scores 0.258 and Otsu thresholding scores 0.259. The road-access results agree with a calculation using EMS-graded road and bridge breaks at F1 0.854. An unseen Sikkim area ran from raw data to the dashboard in 36.5 minutes.
Challenges
Water labels do not describe all the debris left after a mountain flood. Deposited debris can remain after the water has receded, which limits water segmentation against reference maps of flood traces. Cloud also removes optical observations, while water already present in the pre-event images can be missed by change detection. The locked-event mean F1 is 0.366, compared with 0.906 for the Trishuli development case study.
What we learned
Water already present in the before images produces little change even during a larger flood, which accounts for much of the area missed by change detection on large plains. The water models gave higher scores on these events. In mountain valleys, however, water can recede before the satellite pass while dry debris remains, and optical change restricted to river channels recovered more of the reference extent than water segmentation alone.
What's next
Longer image series are needed where several flood waves leave the pre-event ground wet. Mountain debris mapping also needs better discrimination between flood deposits, seasonal vegetation change and unrelated slope failures. Settlement-access uncertainty needs comparison with independently checked road and bridge failures.
Claude and Codex were used to edit code and documentation.
Built With
- computer
- folium/leaflet
- geopandas
- kuro
- microsoft
- networkx
- openstreetmap
- planetary
- pysheds
- python
- pytorch
- rasterio
- segmentation-models-pytorch
- sen1floods11
- siwo

Log in or sign up for Devpost to join the conversation.