-
-
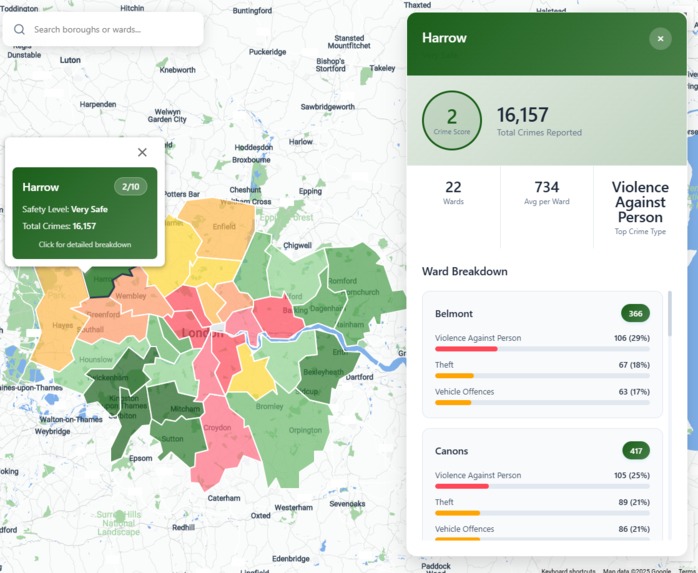
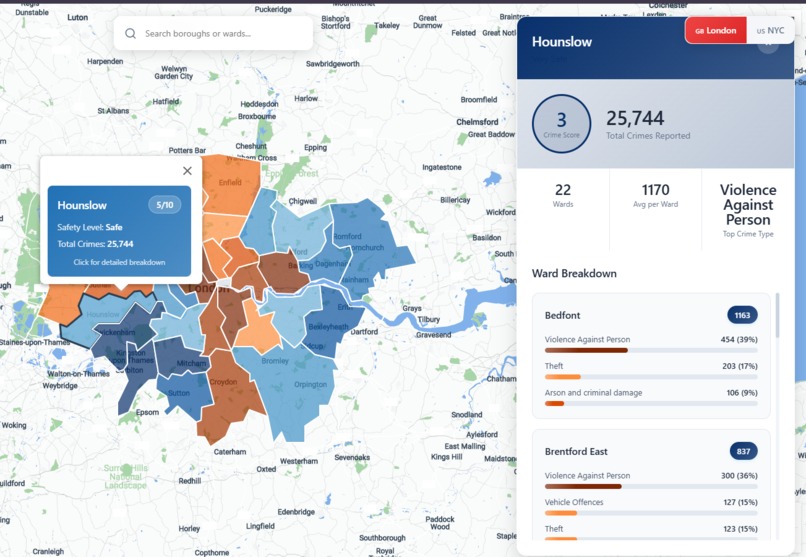
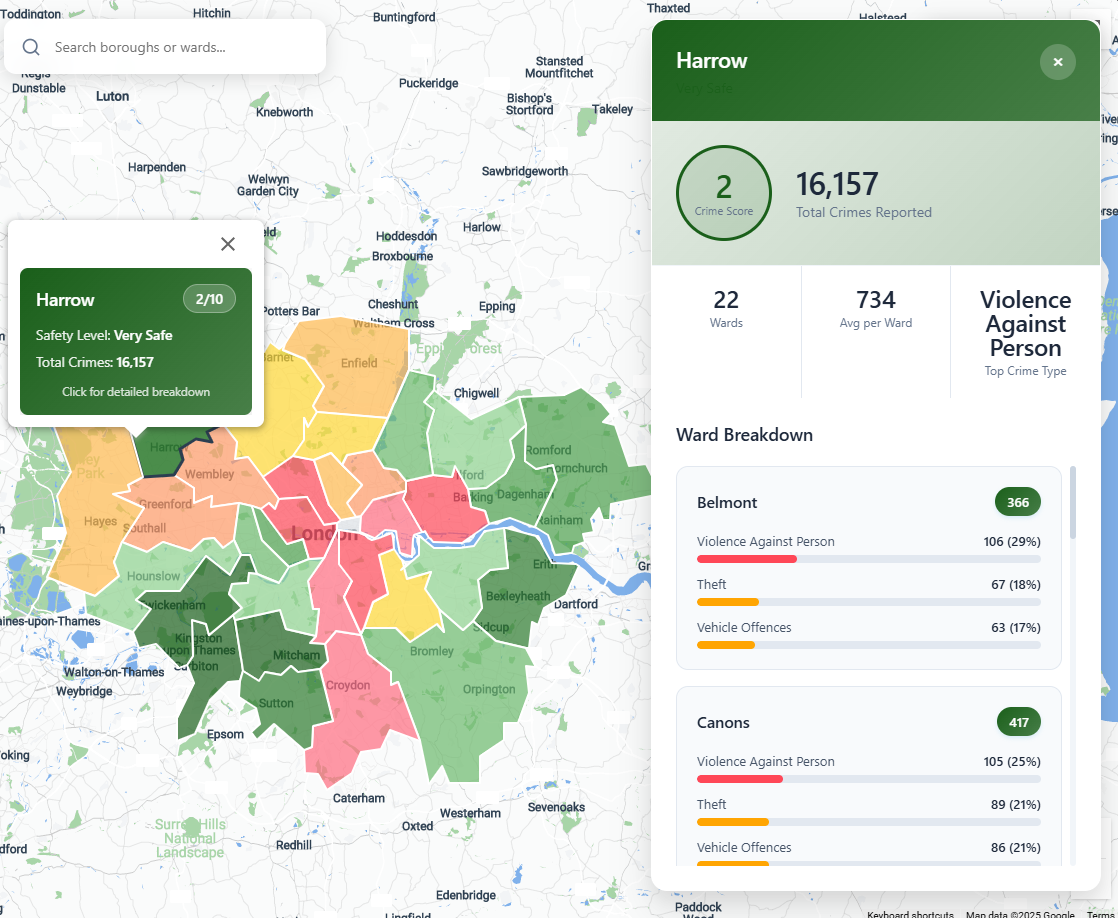
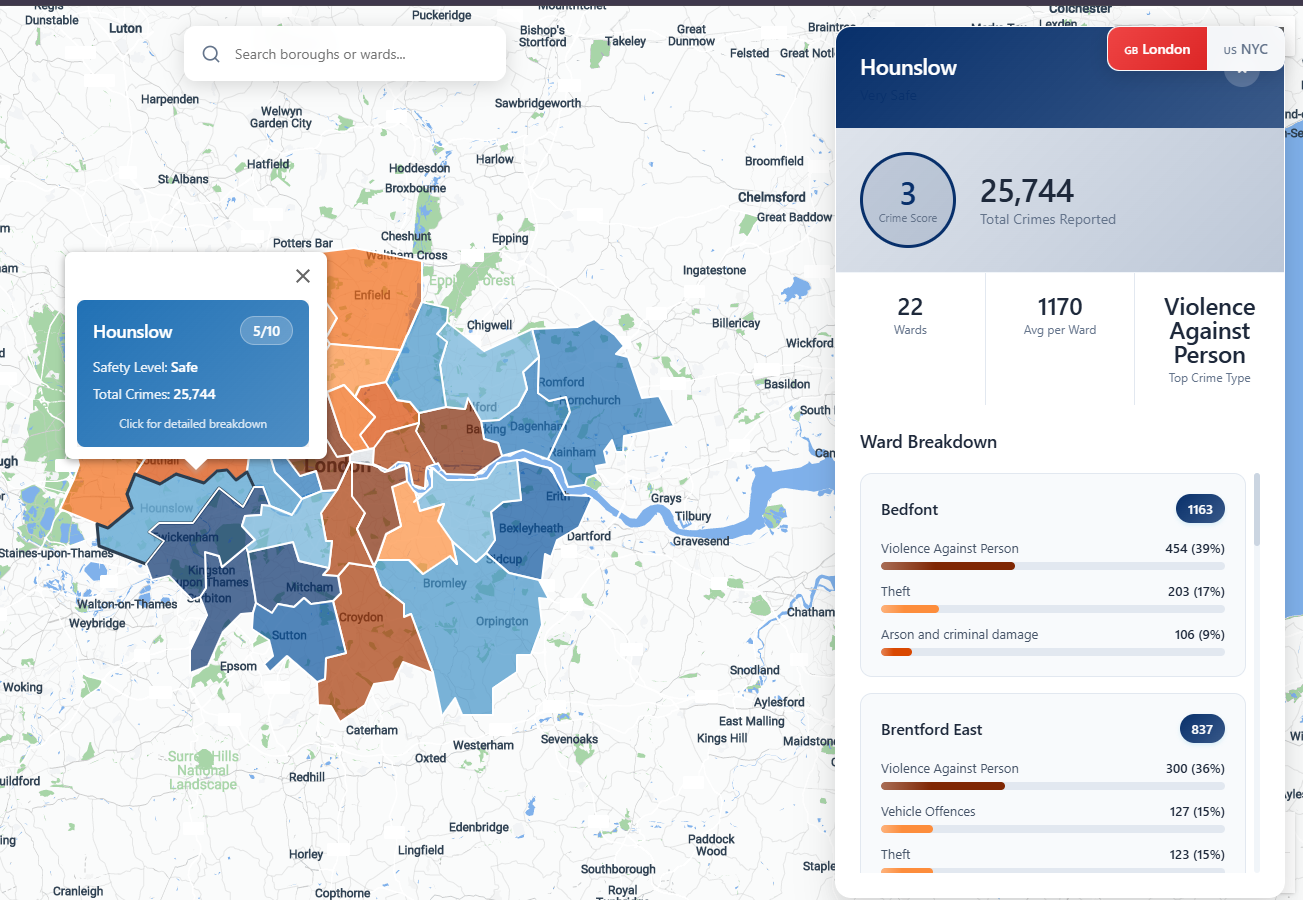
Borough ranking based on crime in London
-

Difficulty viewing certain colours
-
Enhanced Visibility mode
-
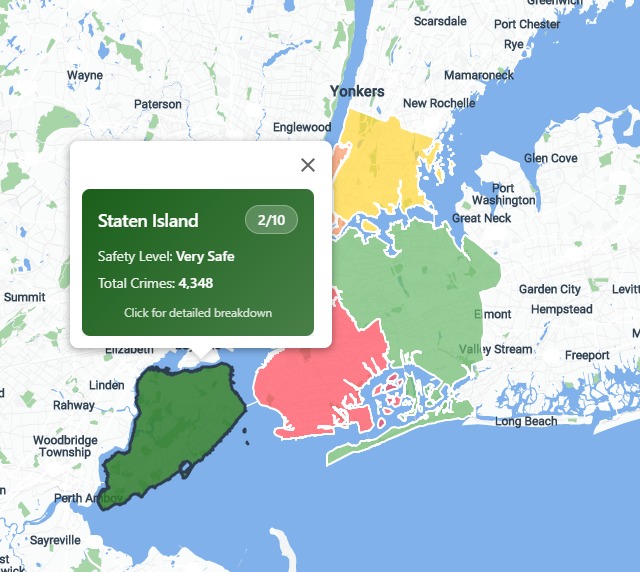
Borough ranking for NYC


Inspiration
When I moved to a new city as a student, I was looking for a safe place to live. Safety was a key part of my housing decision, but most real estate listings didn’t offer much help in that area. This project was born from that gap. By combining real government crime data with Google Maps, it creates a clear, interactive view of neighbourhood safety. The goal is to help renters, buyers, and even real estate agents make more informed housing decisions, bringing an extra layer of transparency to the process of choosing where to live.
What it does
SafeWorld provides interactive safety insights for London and New York City using official crime data from UK government and NYPD sources. The platform rates boroughs on a clear scale based on crime density over the past year, with color-coded visualizations and detailed breakdowns by crime type for each ward or precinct.
For better accessibility, there’s also an Enhanced Visibility mode, designed after learning that many people have trouble telling red and green apart. It’s a simple, clear tool to help renters, buyers, families, or anyone understand how safe a neighbourhood is.
How we built it
I started by collecting the past year's crime data from official government sources. Using Python, I cleaned and filtered the data to focus on borough- and ward-level crime stats that matter most to users.
The tools I used were:
HTML - Structures the web pages and provides containers for the map, dashboard, and UI elements.
CSS - Implements color schemes, animations, and layout for both desktop and mobile.
JavaScript - Loads and processes crime data (JSON/GeoJSON) for visualization, manages dashboard updates, tooltips, and navigation effects.
Python - Generates borough-level safety scores and outputs them as JSON and GeoJSON for the frontend.
GeoJSON - Represents geographic boundaries of boroughs (e.g., boroughs_crime_score.geojson).
JSON - Stores processed crime data and borough safety scores
SVG - Used for custom map outlines and icons in the UI for enhanced visuals.
The Google Maps JavaScript API allowed me to:
- Embed a live map on the website that users can interact with directly.
- Display customized polygons for each borough based on real boundaries, enabling area-based safety comparisons.
- Use markers and info windows to show crime summaries and other details when users click or hover.
- Integrate Places Autocomplete so users can search for a specific location and instantly see safety information for that area.
Challenges we ran into
One of the biggest challenges was making sense of the raw crime data. As a beginner, it took time to understand how the data was structured, what each column meant, and how to group it in a meaningful way. Figuring out how to match crime stats with map boundaries also took some trial and error.
Accomplishments that we're proud of
I'm proud I was able to clean and organise real crime data, and map it in a way that’s easy to understand. It was also my first time using an API, and it was pretty fun!
What we learned
- I learned how to use an API for the first time and display geographical data
- I also learned how to find accurate data and explored how to work with large datasets
- Used pandas for the first time and discovered how efficient it can be for sorting data and visualization
What's next for SafeWorld
As planned in the beginning, future features shall include:
- Safer Route Suggestions - Help users plan their daily commutes by suggesting alternative routes that avoid areas with a high crime history, which is particularly handy for walking alone or at night.
- Community Crime Reporting - Allow users to report crimes or unsafe incidents directly on the platform to improve real-time awareness and build a more community-driven safety map.
- Time-Based Crime Trends - Show how crime rates have changed over time by introducing toggles for monthly, seasonal, or yearly views. Users could compare “This Month vs Last Month” or monitor whether an area is becoming safer or riskier.
- Expanded city coverage - Add more major cities using similar government data sources


Log in or sign up for Devpost to join the conversation.