-
-
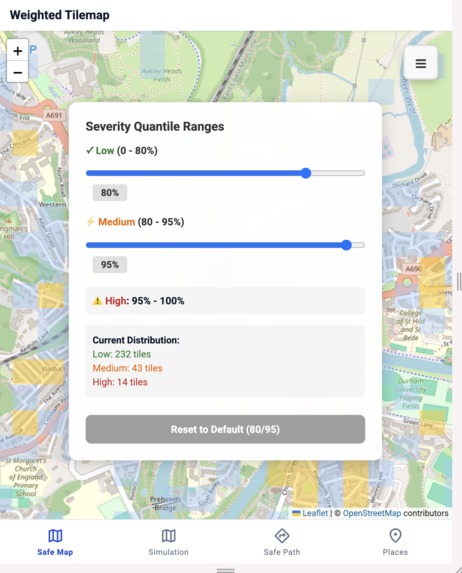
Severity Quantile Ranges
-
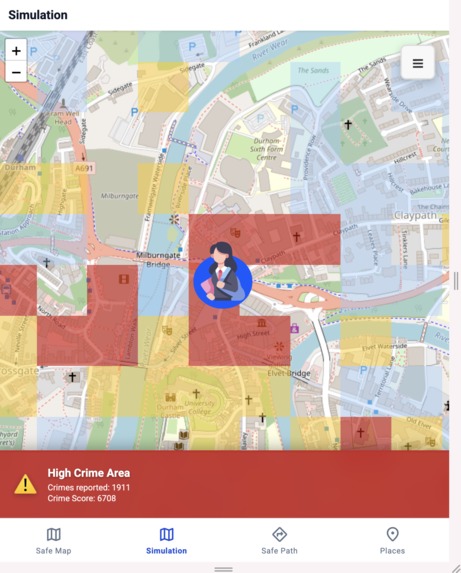
High Crime Area
-
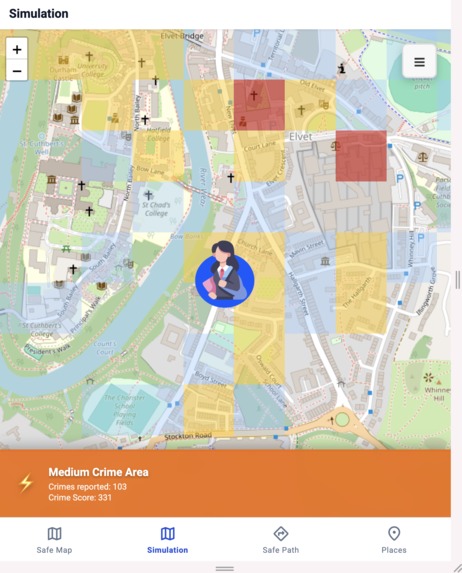
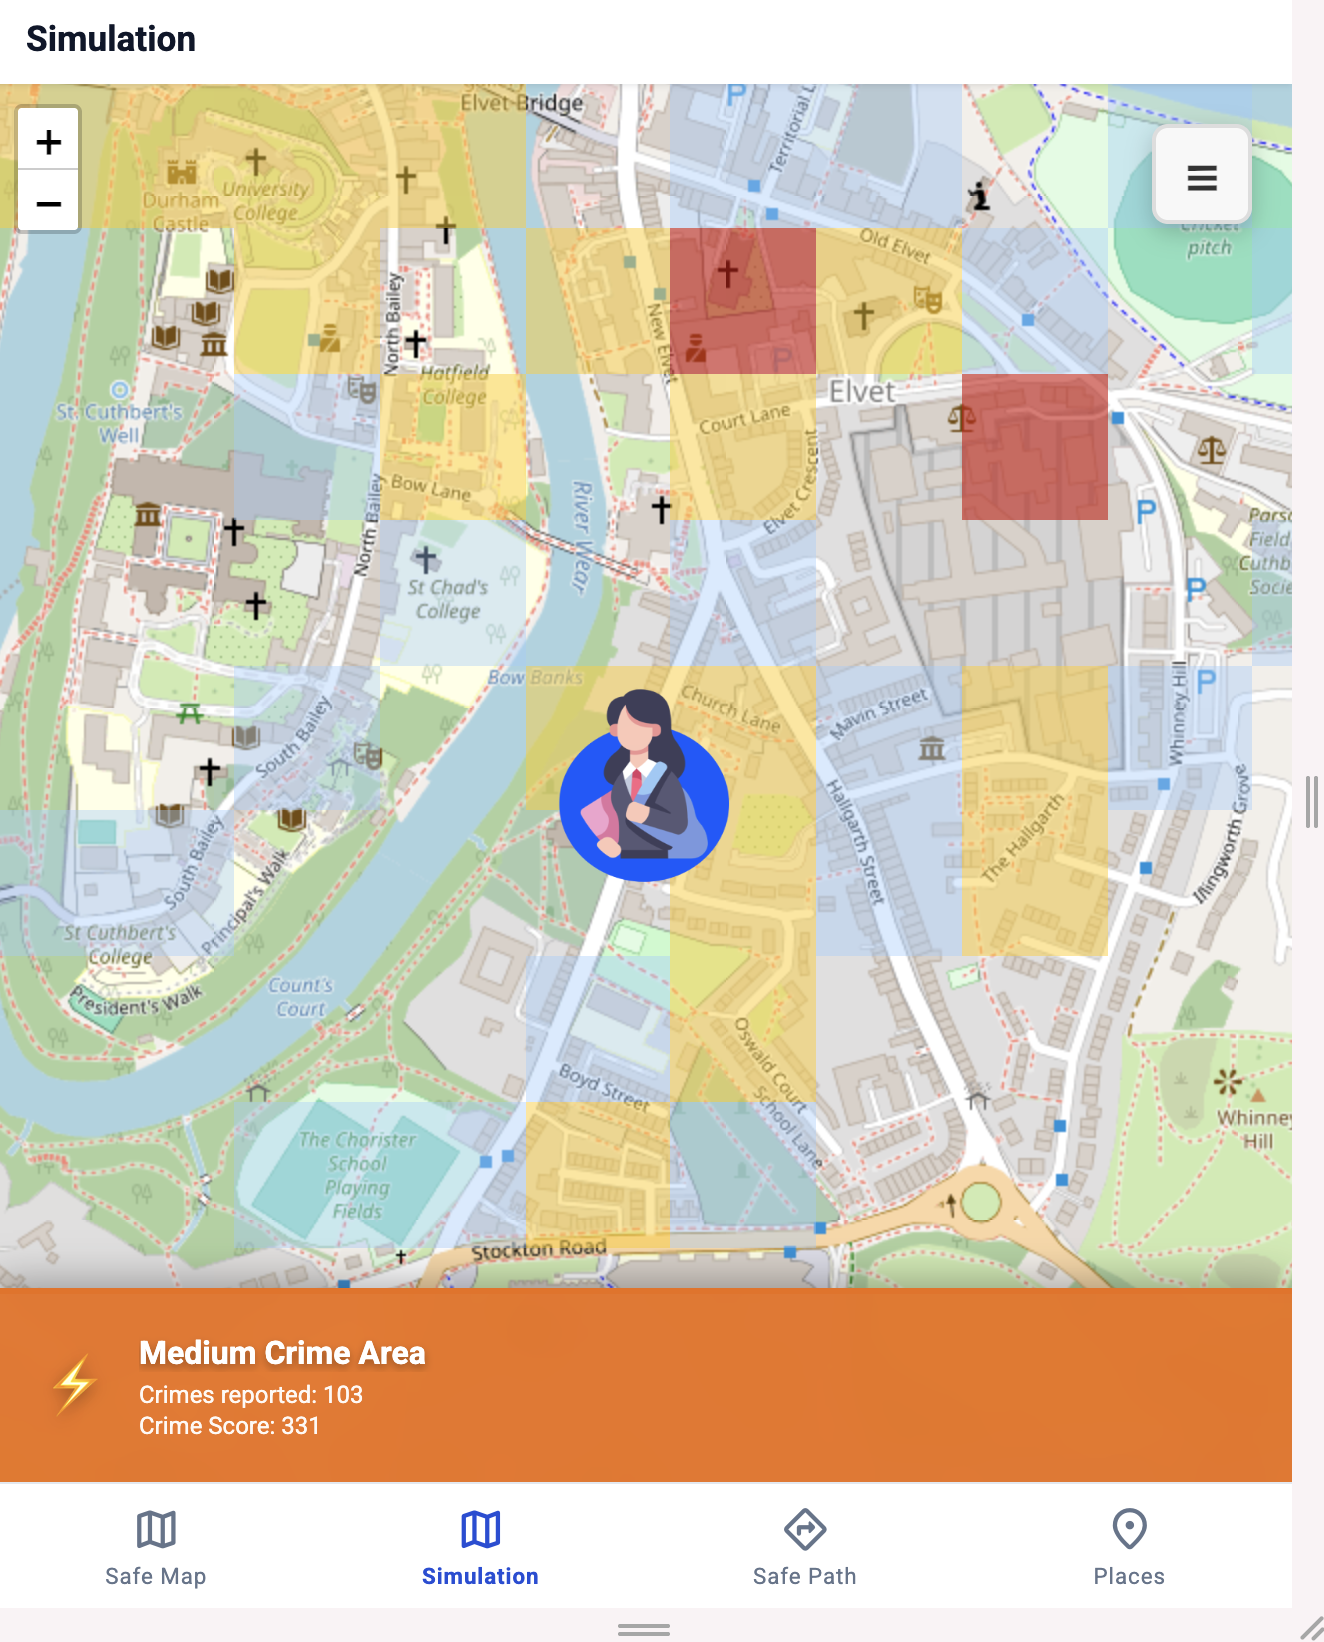
Medium Crime Area
-
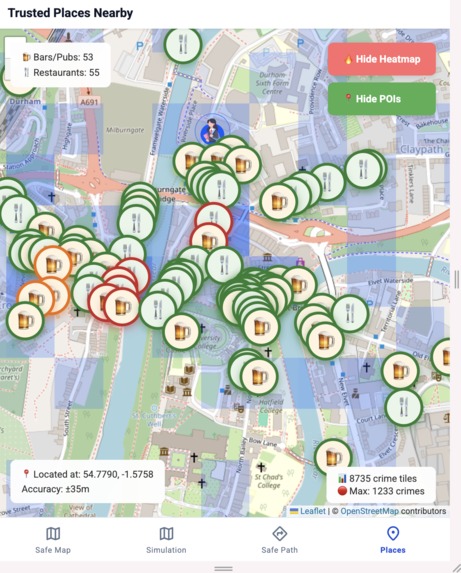
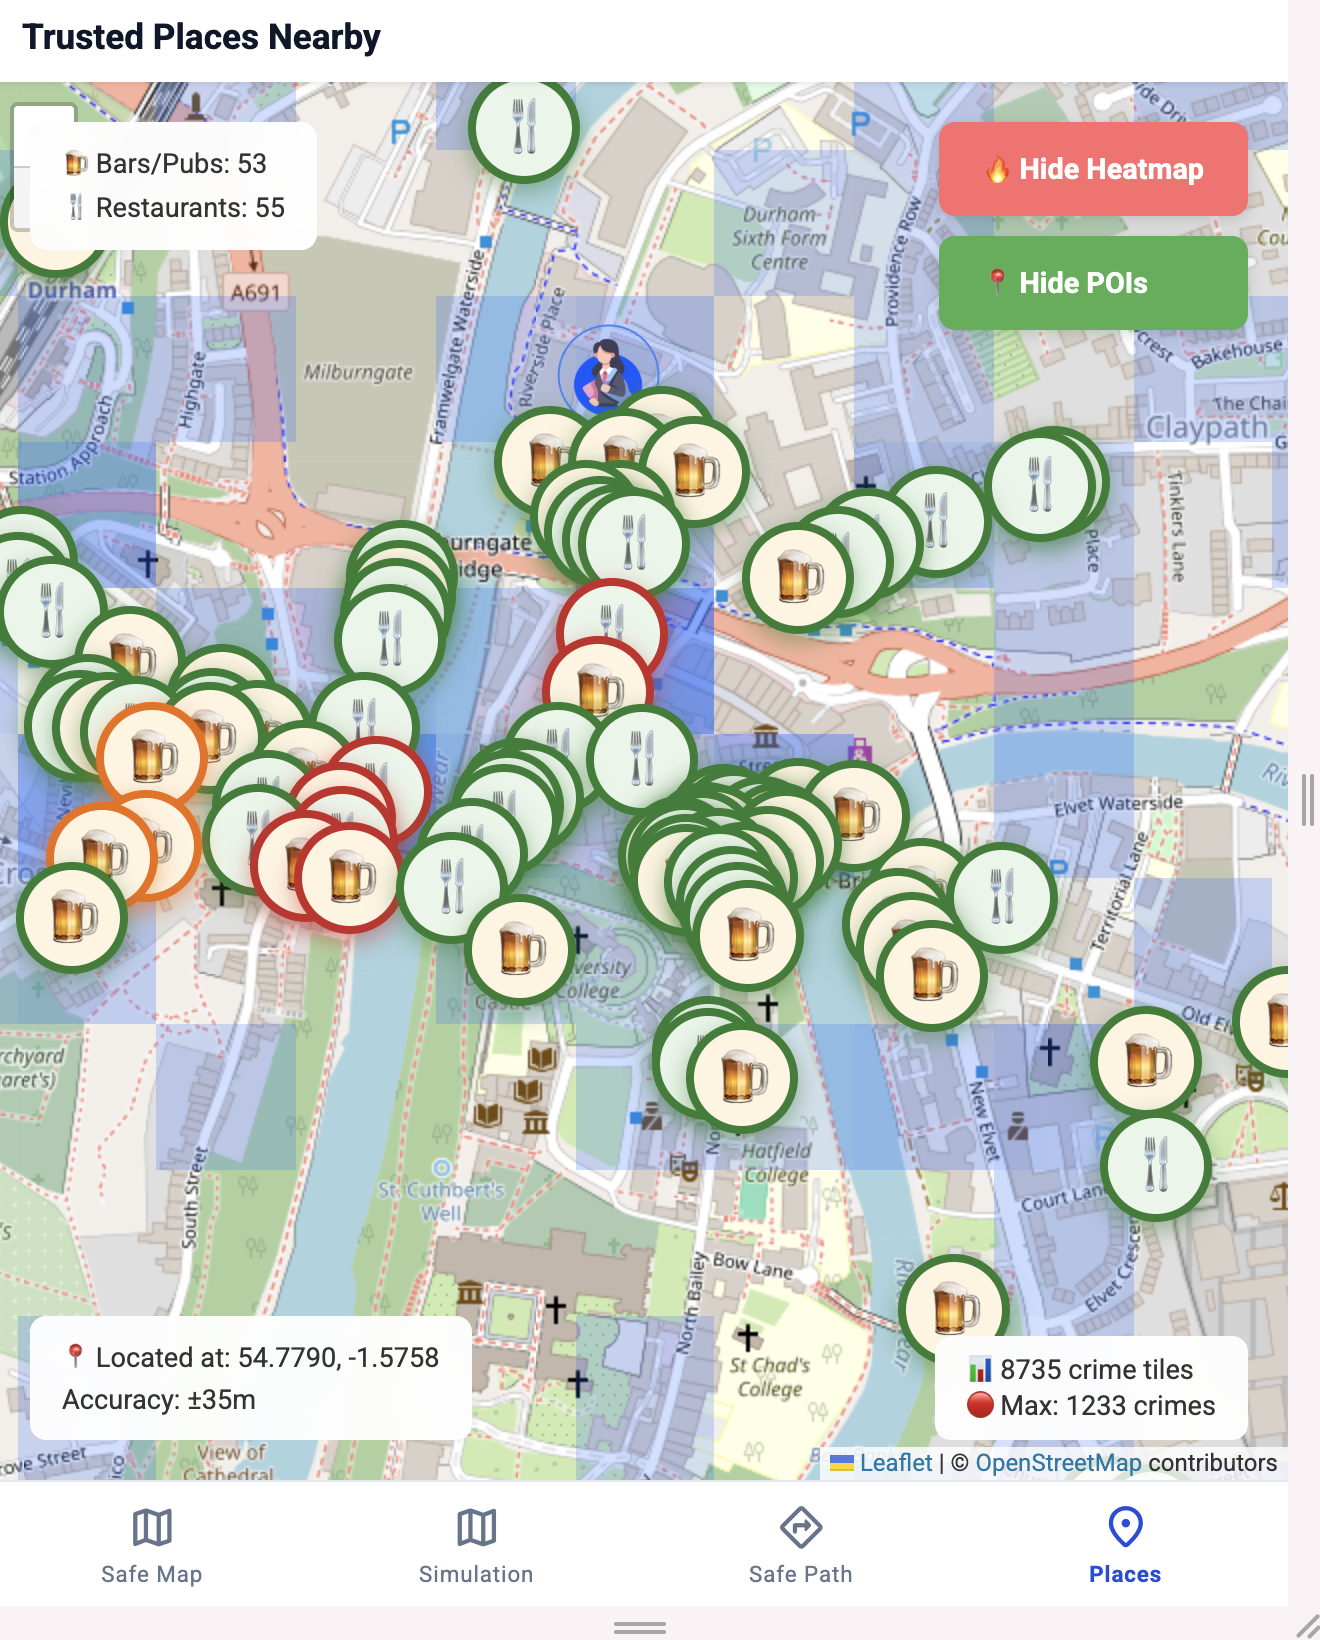
Bar & Restaurant
-
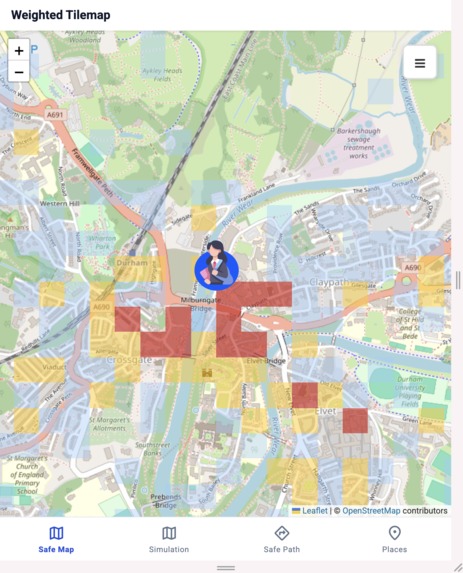
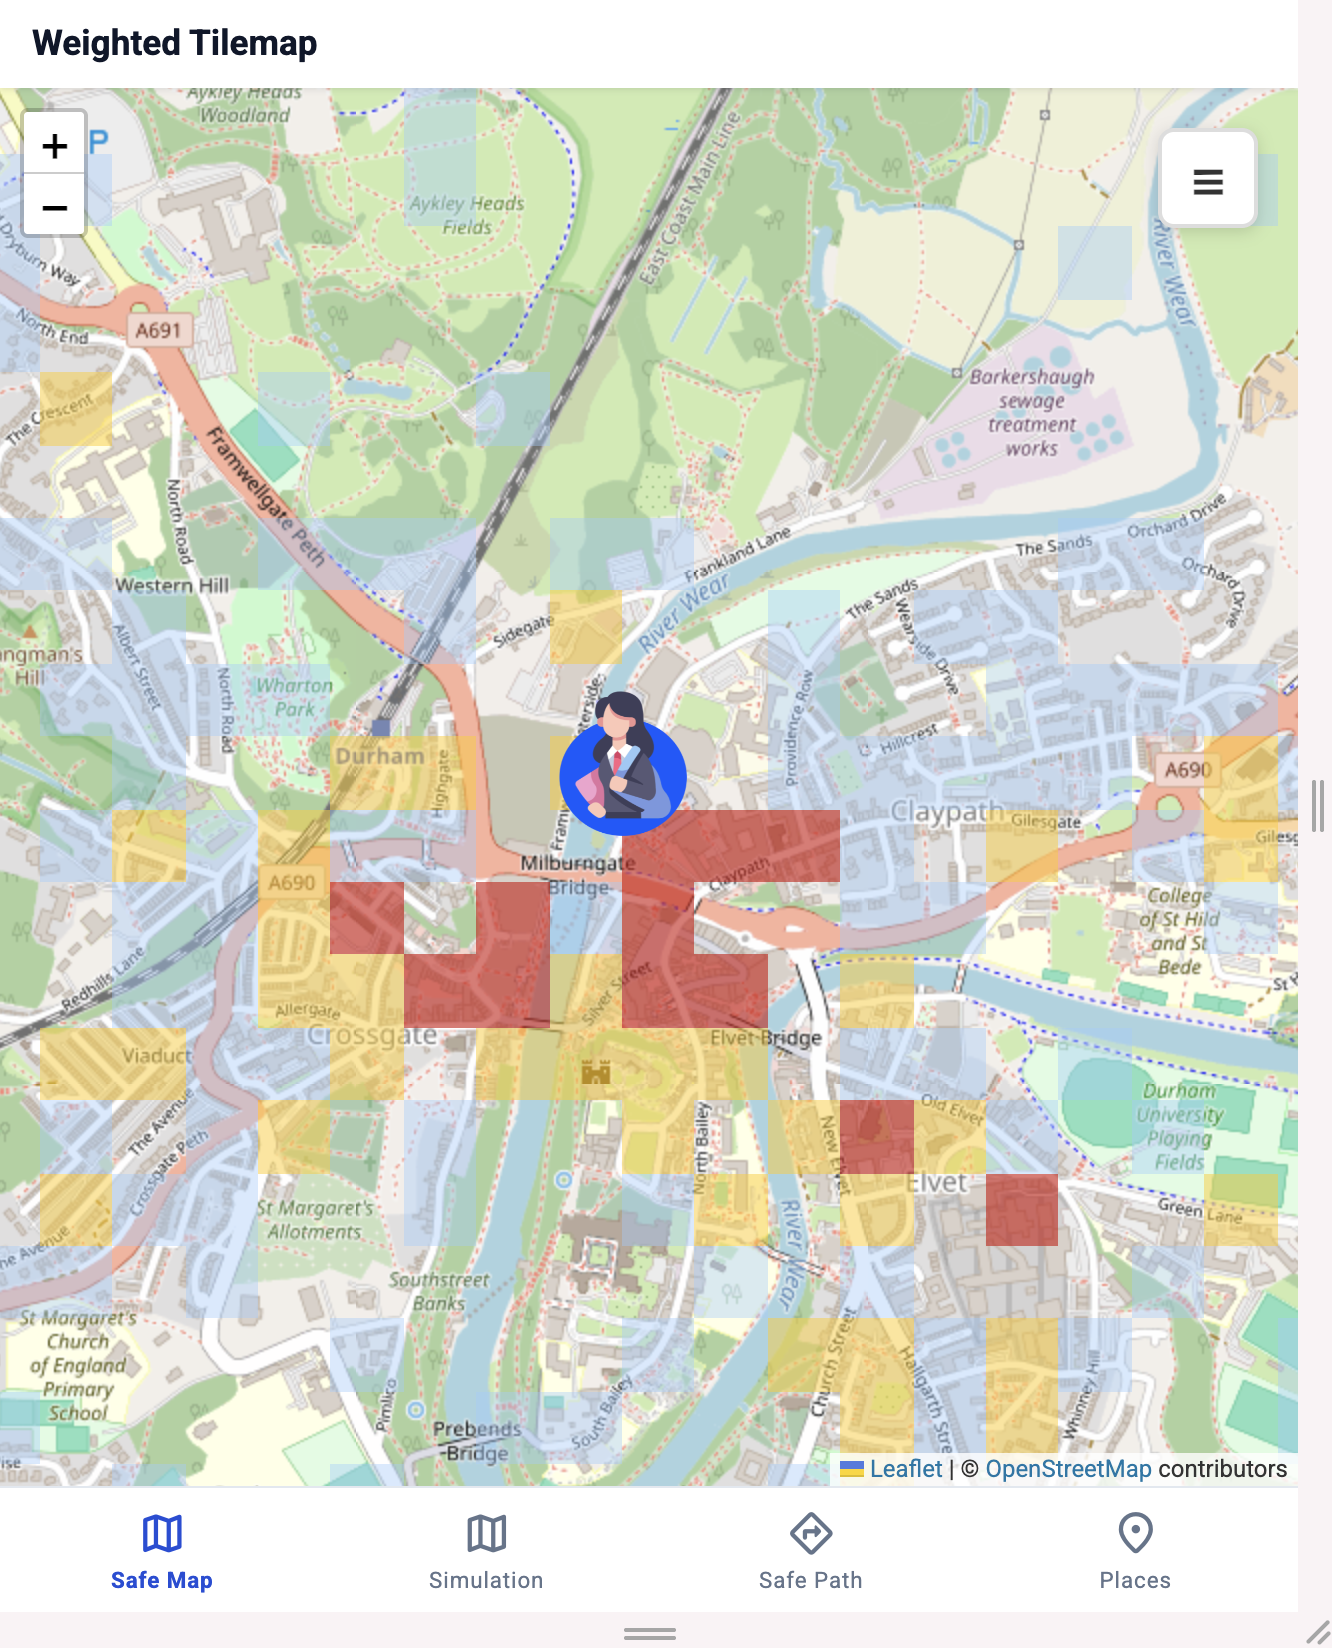
Safe Map (mobile app)
-

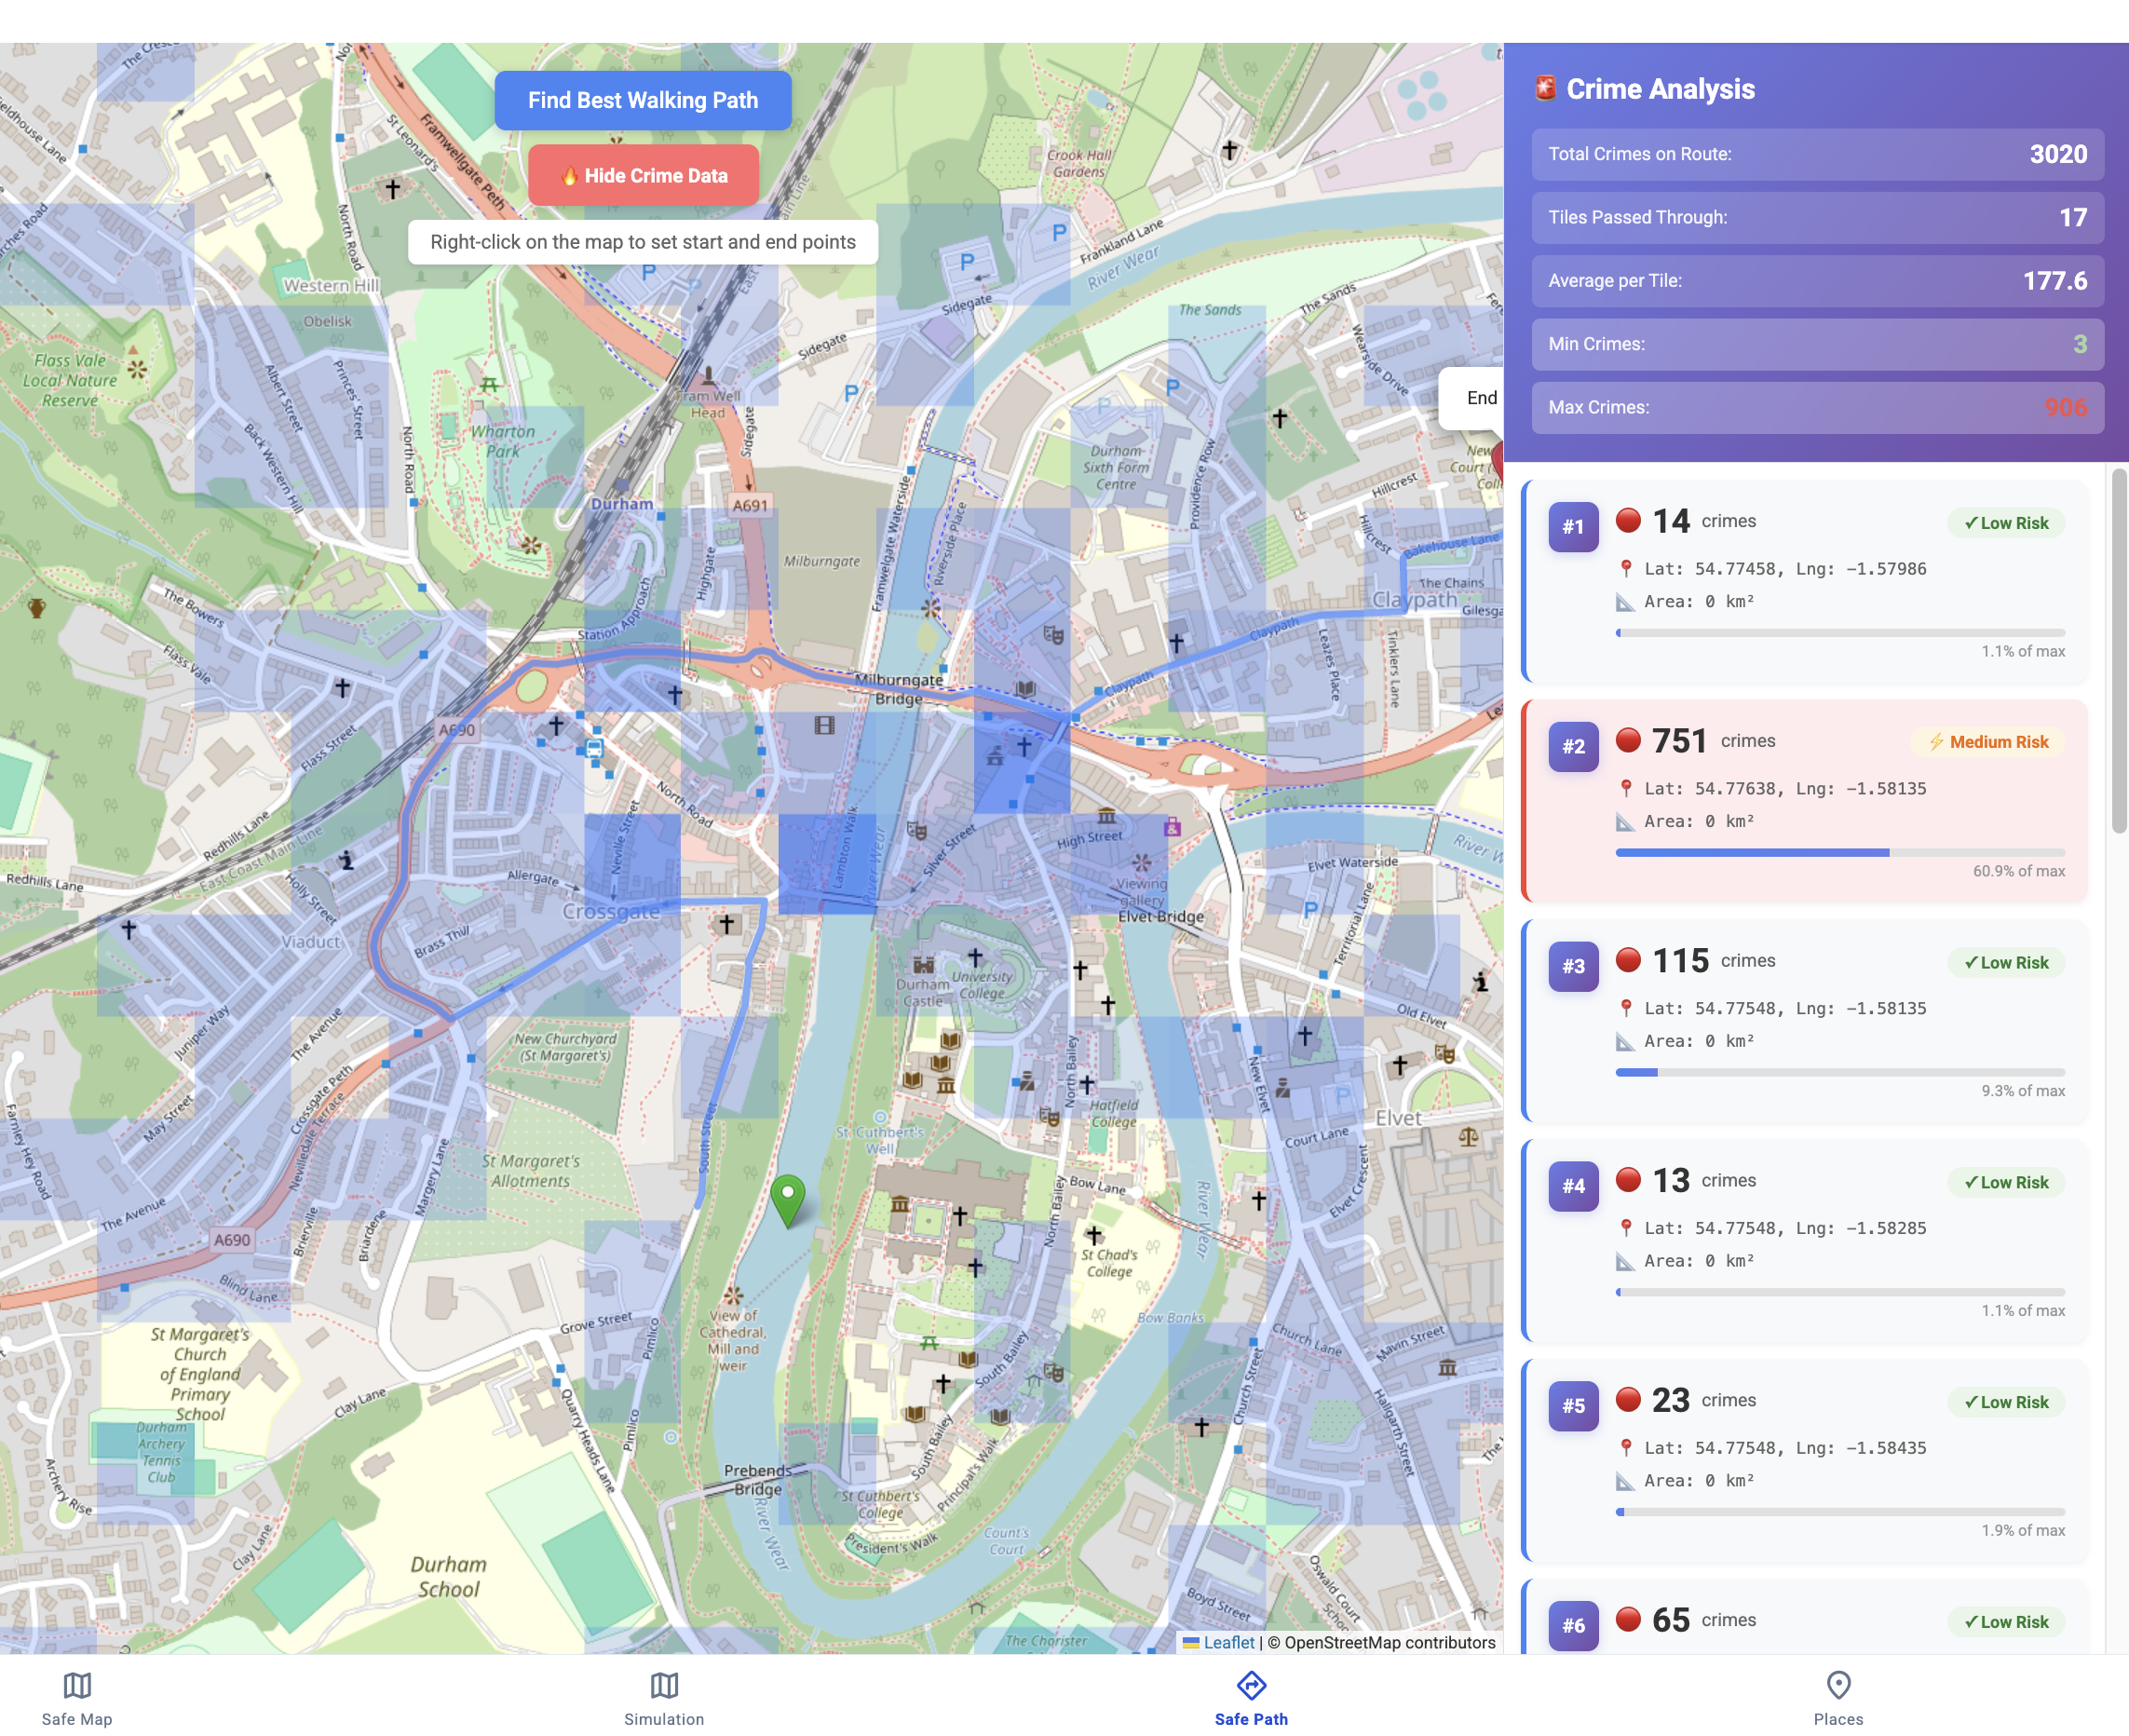
Find Safest Walking Path
-
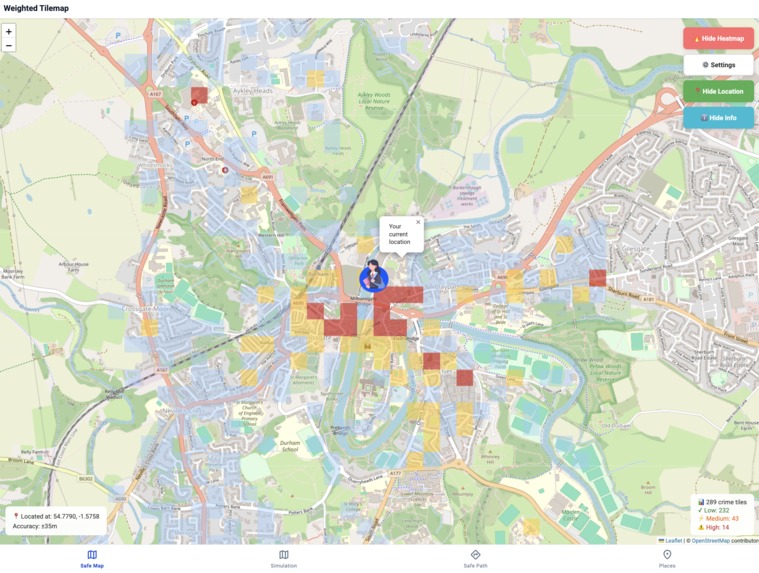
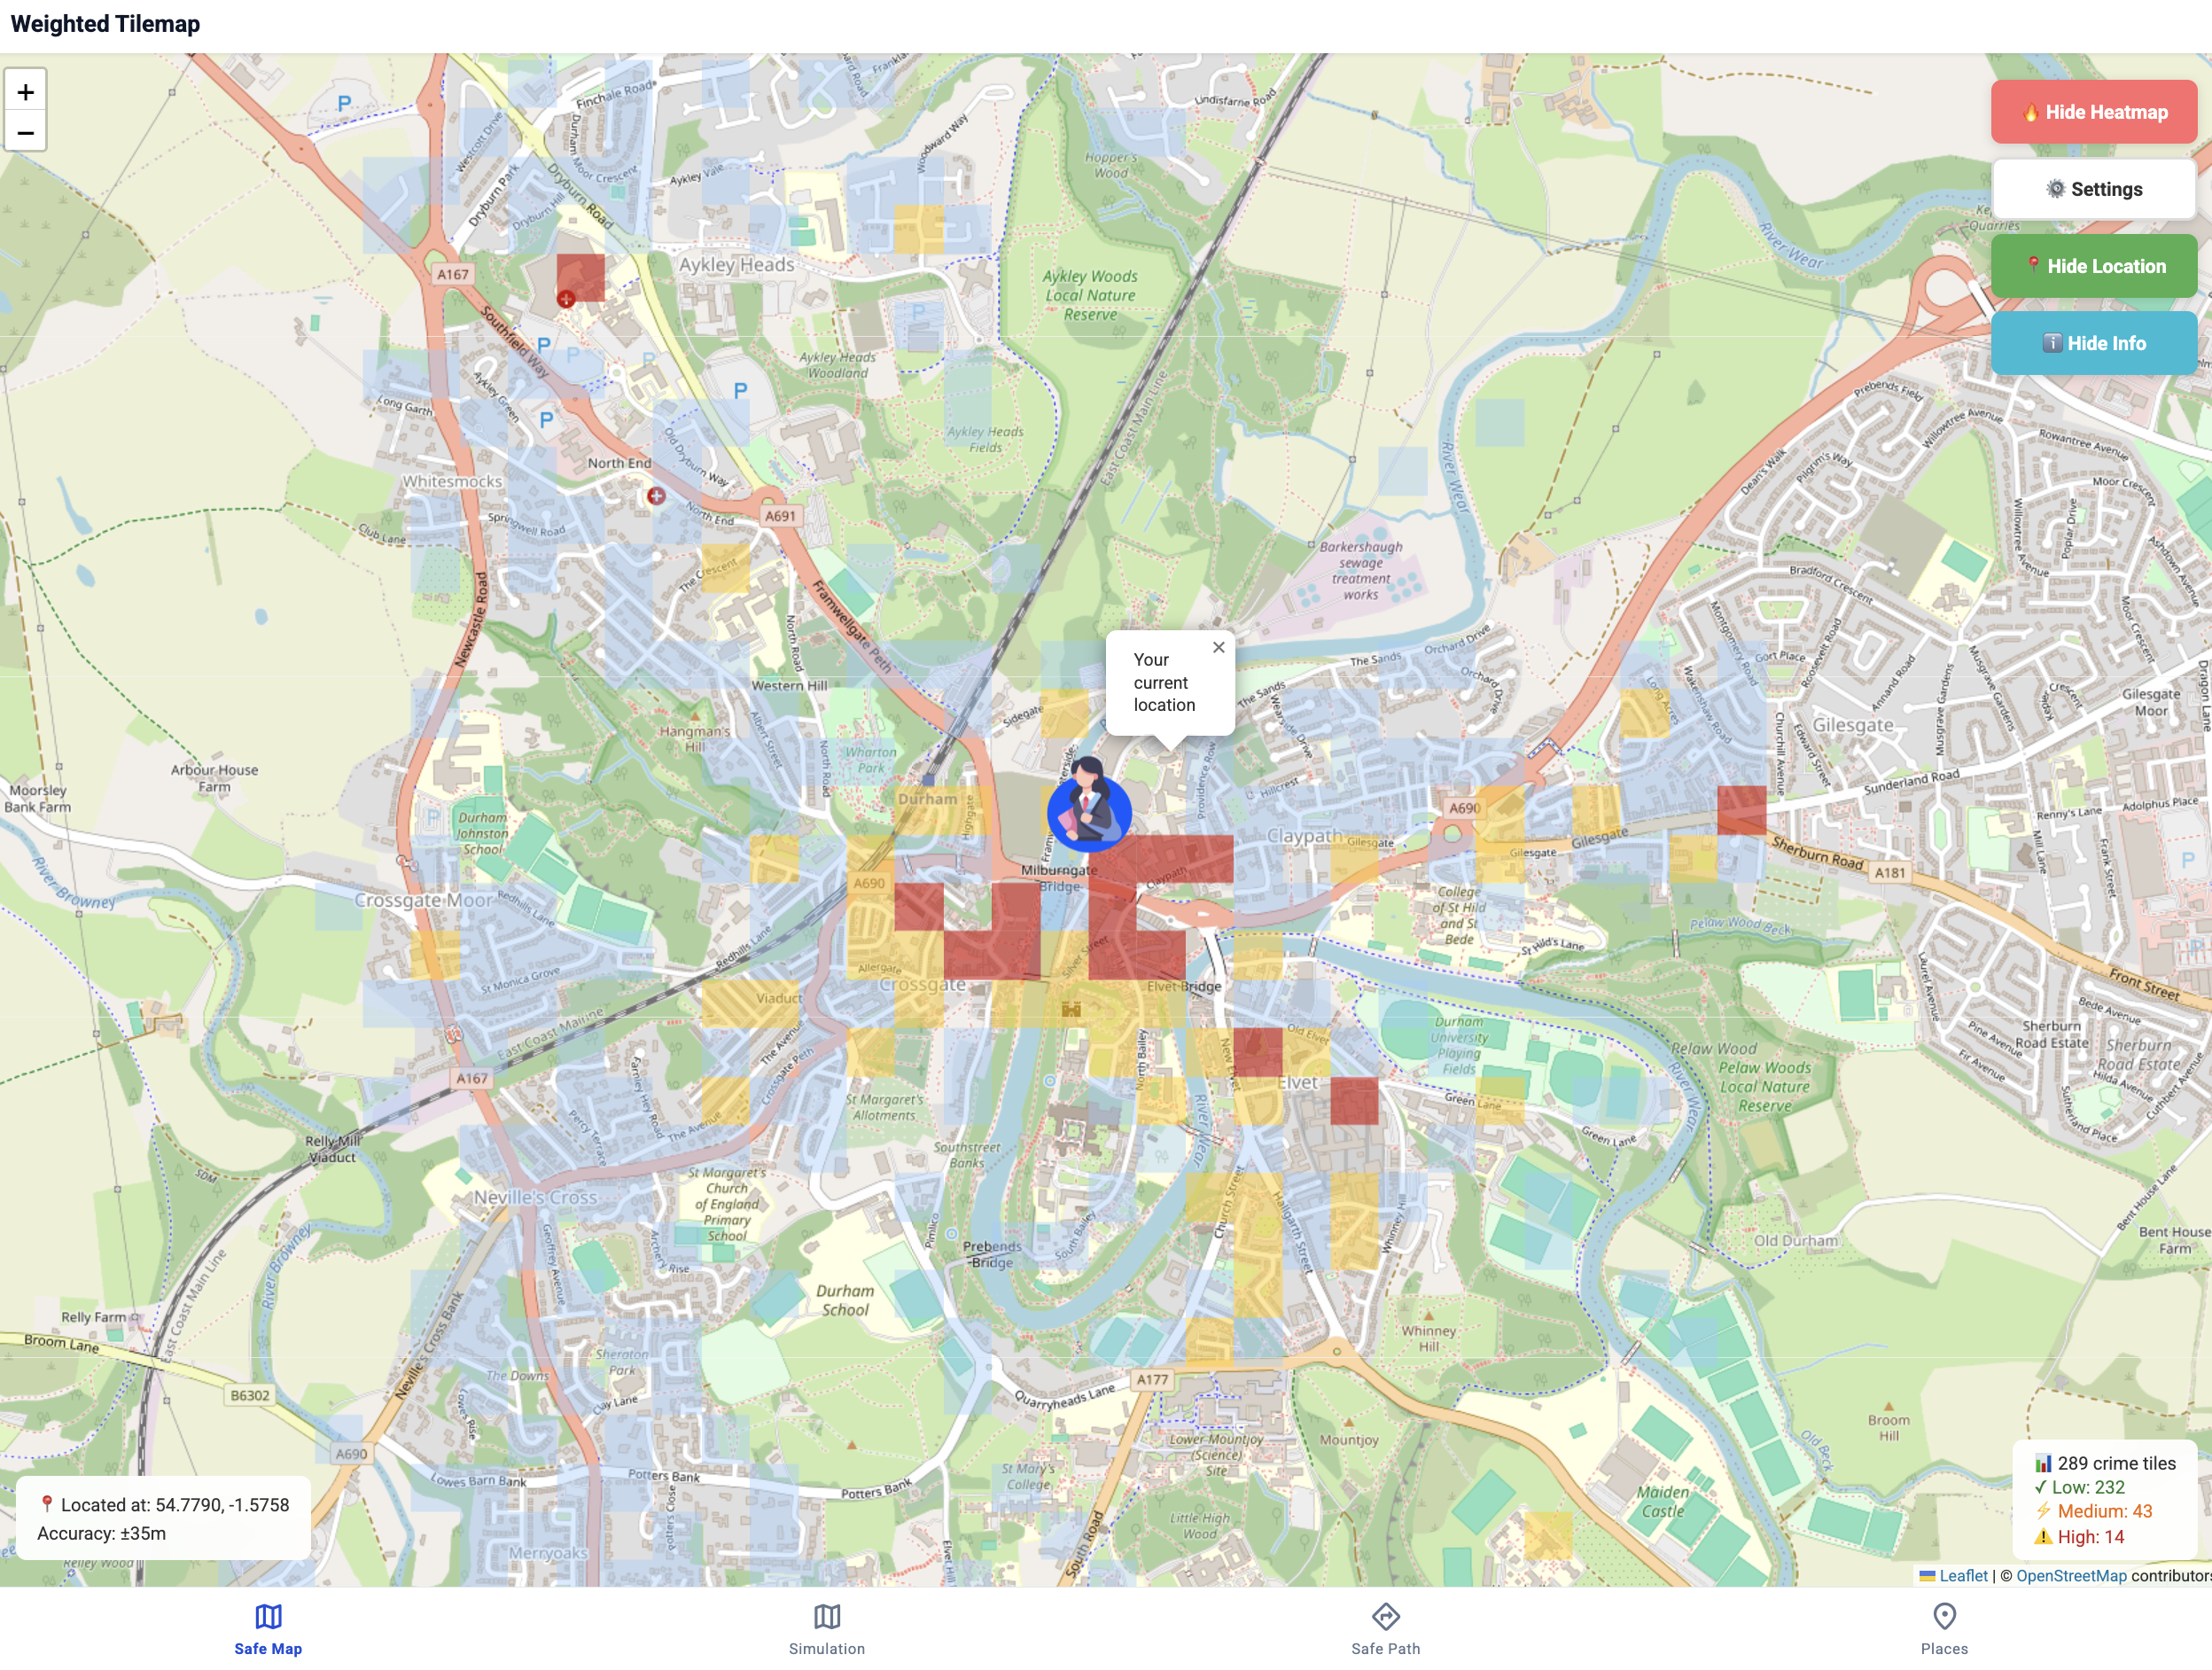
Safe Map (web)


Inspiration
Two winters ago, I moved to a new city to study. It was a completely unfamiliar environment for me. One night after class, I was walking back to my dorm and got attacked by a few drunk men. I was terrified.....and after that, I never dared to walk that way again.
Later, I learned from senior students that the area was known for safety issues at night. I thought, “If I had known that earlier, maybe this wouldn’t have happened.”
A few months later, my friend’s bike was stolen, and we found out that the place already had one of the highest bike theft rates.
That’s when I realized that students often face risks not because they’re careless, but because they don’t have the right information. And that’s why I created SafeWalk — Your Campus Guardian — to help students stay informed, aware, and safe wherever they go.
What it does
SafeWalk is an interactive map that visualizes crime data and helps users find the safest walking path. It not only shows the quickest route but also features a unique "Safest Path" option that automatically navigates around high-risk areas.
Challenges
The biggest challenge is to find to figure out:
- What can be used to predict the danger and the sources of feeling unsafe
- What data sources can we use? (past crime reports, Point of interest on map, user current location, user preferences, …)
- How to make a user-friendly app, which combines all the data and inputs together?
Methodology
Data Collection and Preprocessing
The first step is to download all the data from the public dataset. Then select only the Durham and filter to the target area of 2km around Durham city. The next step is to split the area into a 100m x 100m grid. Other inputs are data about points of interest, in this case restaurants, cafes and bars, which can also be displayed on the map and classified whether they’re in safer or more dangerous locations.
Model Features
The key step is to prepare a single combined metric to be able to identify the dangerous spots. This metric combines customizable weights to give priority to more serious crimes, time decay to prioritize most recent data.
Feature 1
The second key feature is to track the current location of the user and pop up warnings whenever the user enters a dangerous location. This is done by tracking the data from location API against the map tiles and once the user crosses the boundaries, the app evaluates the risk and based on that decides whether to show the warning.
Feature 2
Ahead of time planning is as important and allows the user to find a route from one point to another, while showing all the potential risks on the way. Then it would allow the user to be prepared or even try to take another safer route.
Feature 3
Finally, the app also uses the view to show the POI and visualize them on the map.
Limitations and Future Enhancement
Limitations
The area is limited to a 2km area around Durham. It’s built as a website so there is limited access to sensor and location inputs when running in the background. The current pathfinding only finds the fastest route.
Future Enhancement
Use more data and allow the application to be used around the country and possibly internationally Adding native mobile application wrapper, which can run as a service. This would allow it to provide location and other sensor data even when the phone is in standby. Customized the route planning to avoid the dangerous area and priority the safety by adding custom weights and areas to avoid.
References
DATA.POLICE.UK : https://data.police.uk/data/ (Oct 2016 to Aug 2025) Flaticon: https://www.flaticon.com/ ChatGPT: https://chatgpt.com/ Gemini API: https://ai.google.dev/gemini-api/docs Openstreetmap: https://www.openstreetmap.org Project OSRM (OpenSource Routing Machine): https://project-osrm.org Overpass API: https://dev.overpass-api.de/index.html
Built With
- chatgpt
- claude
- copilot
- gemini
- github
- javascript
- openstreetmap
- python
- svelte
- vercel
- vscode


Log in or sign up for Devpost to join the conversation.