-
-
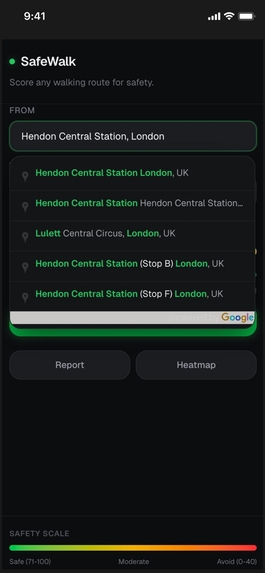
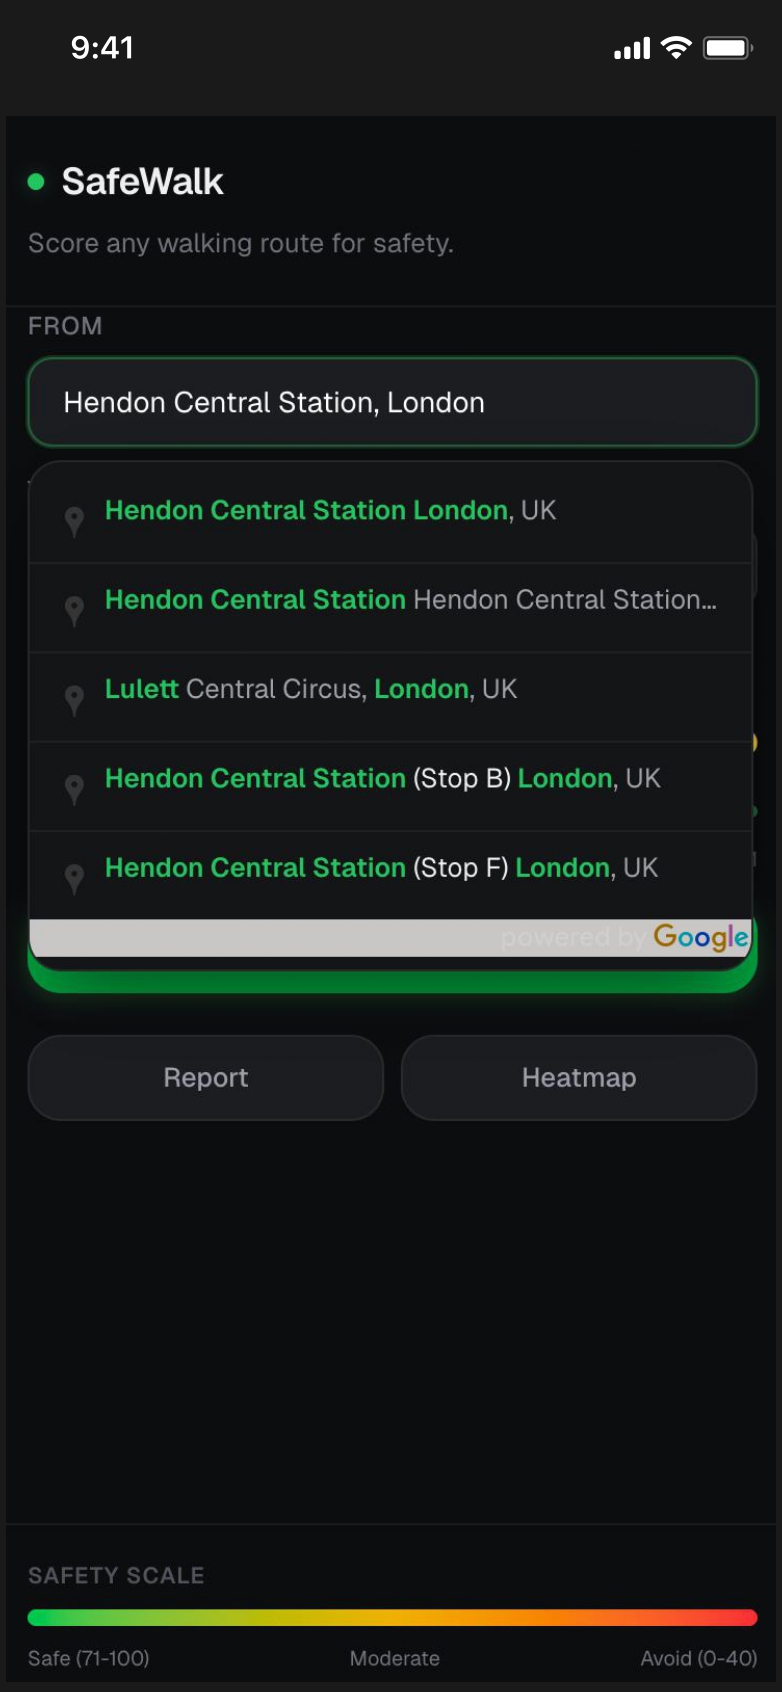
Places Autocomplete with Barnet-biased suggestions
-
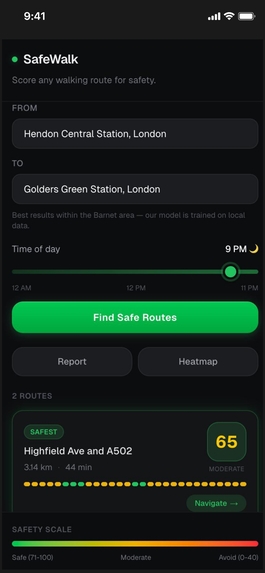
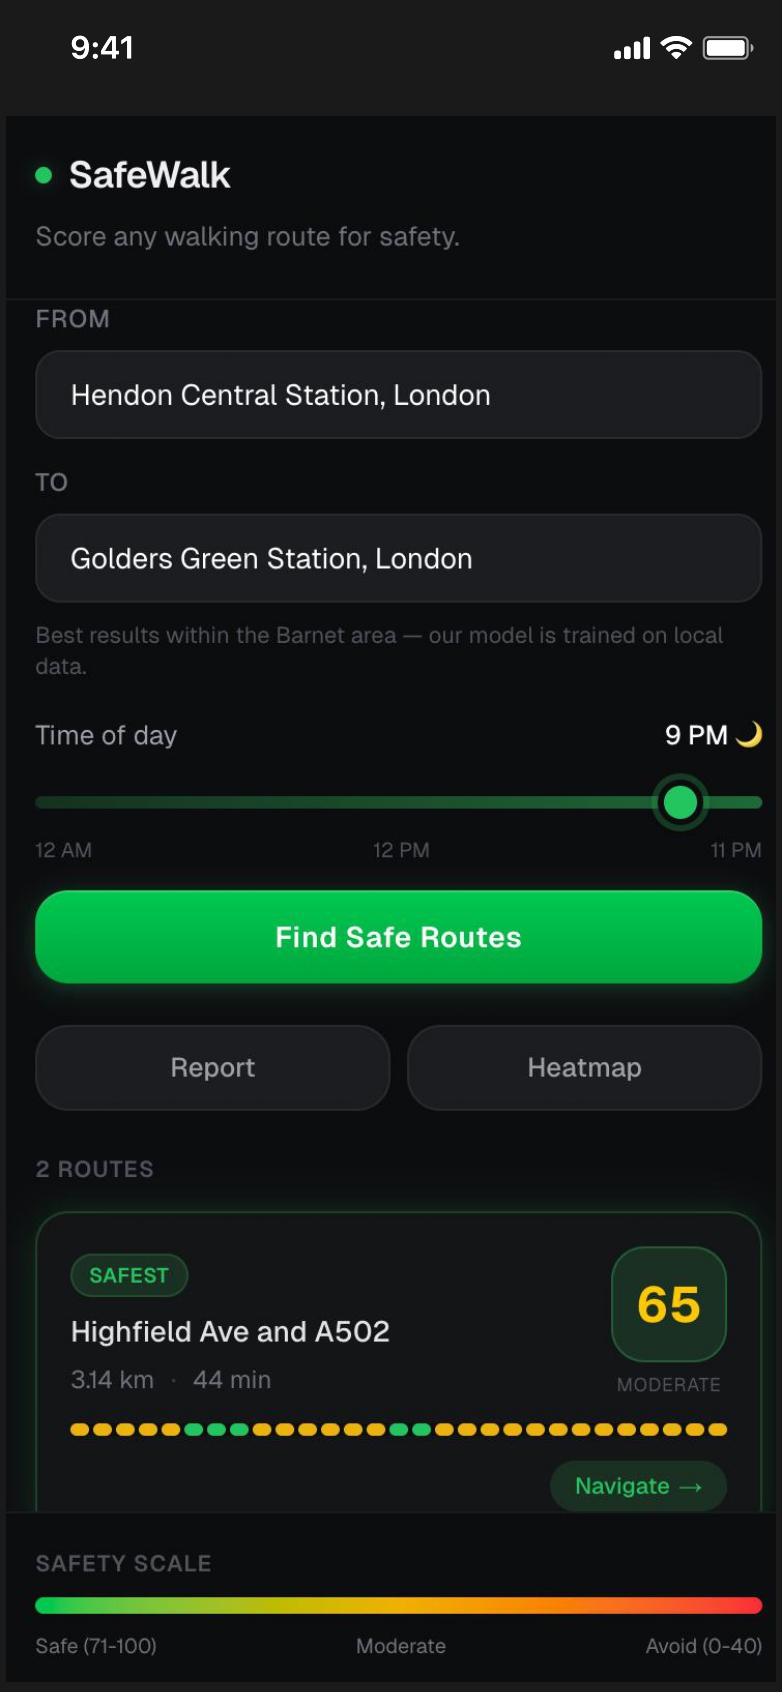
Time-of-day selector with safety scoring controls
-

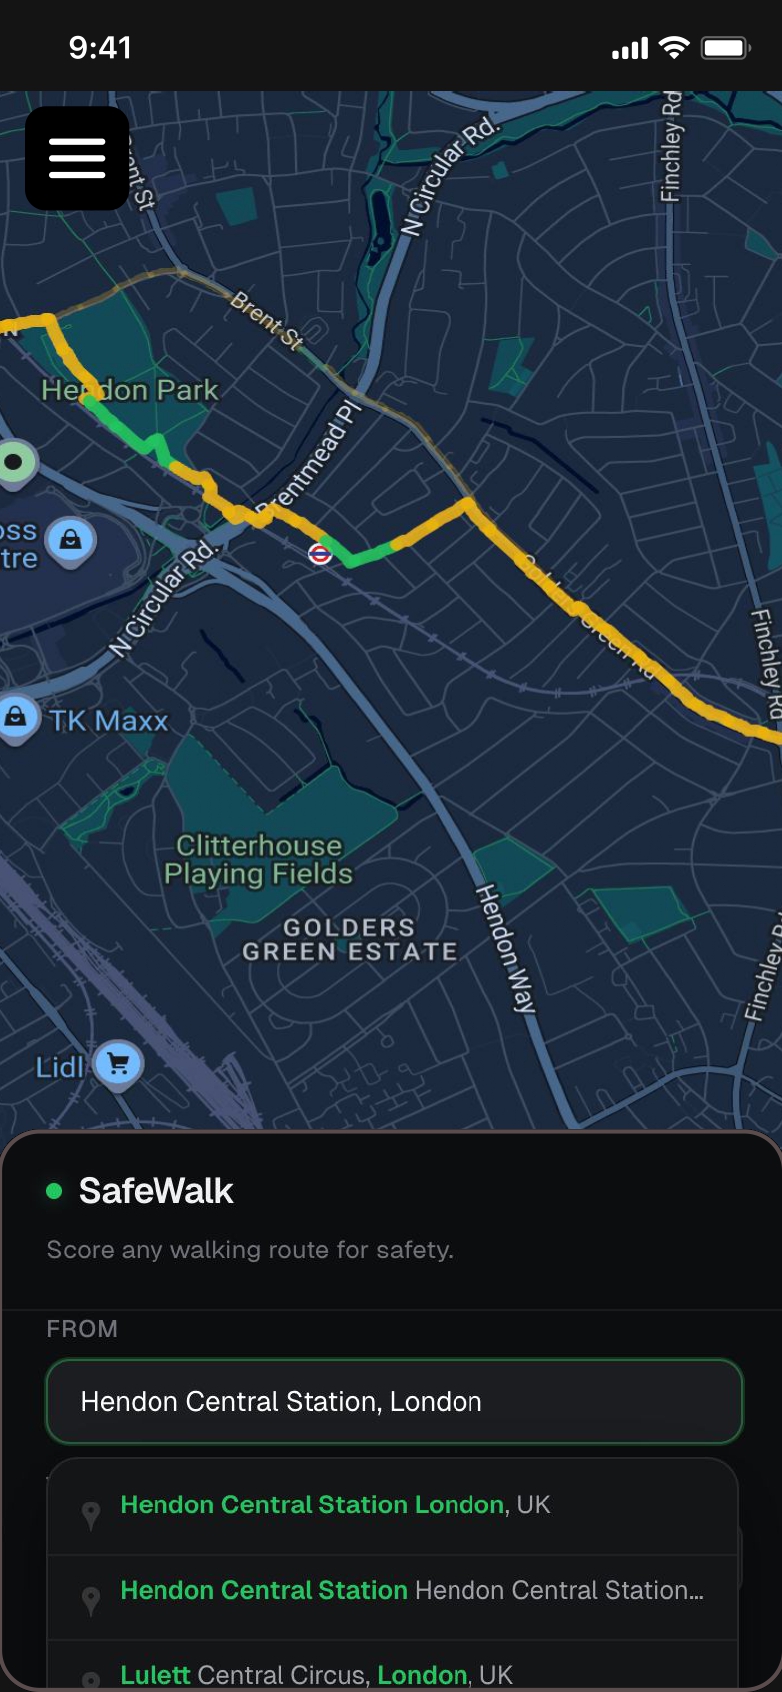
Colour-coded walking routes scored by Machine Learning safety model
-
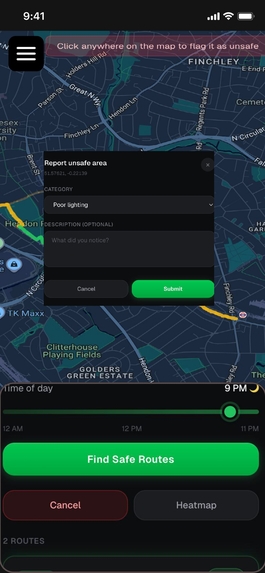
Community safety reporting with category selection
-

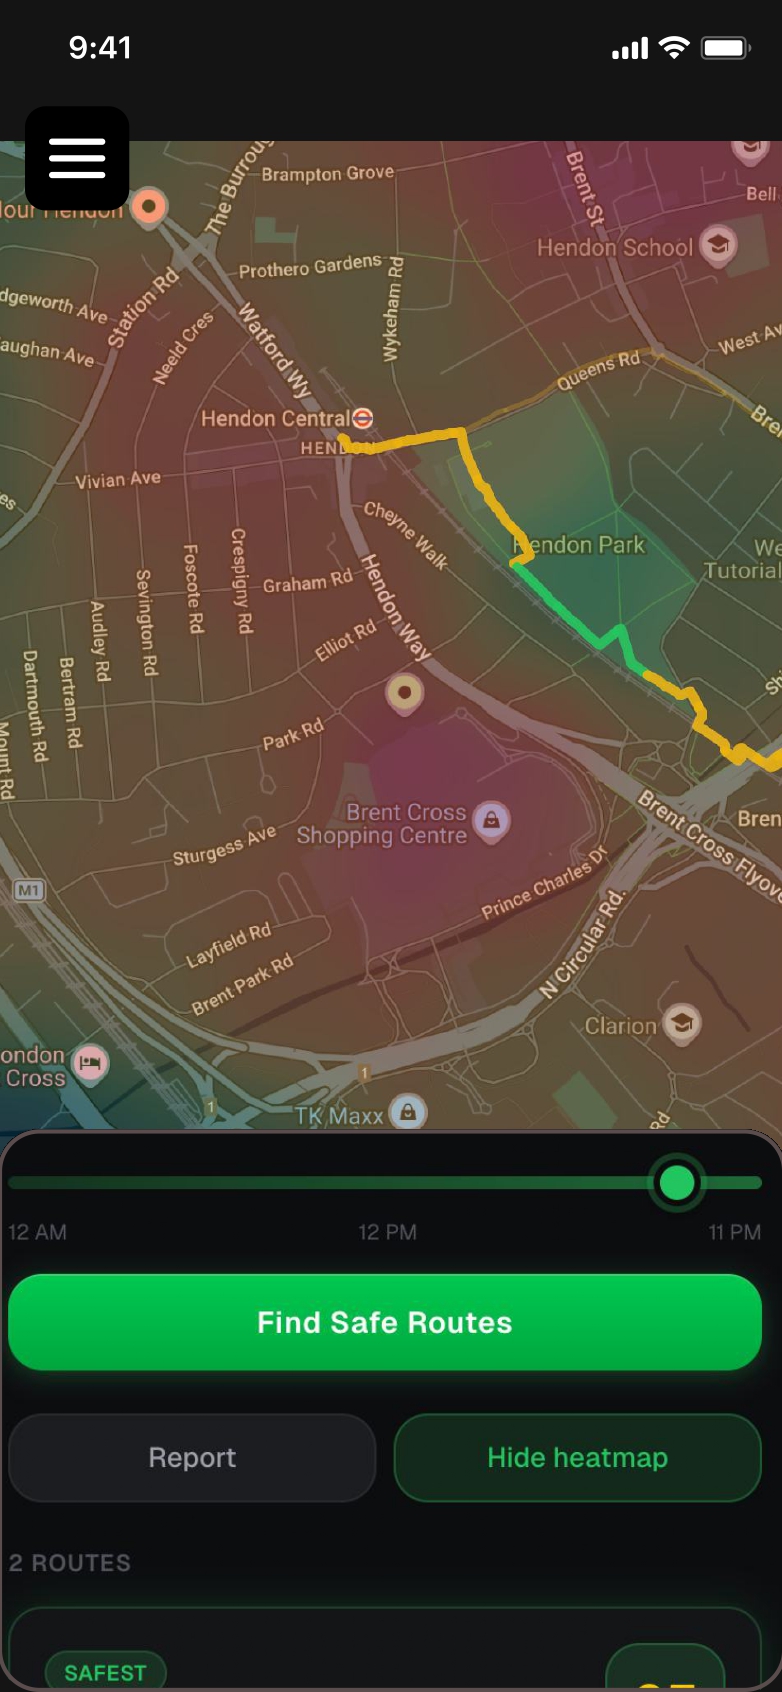
Real-time safety heatmap overlay at 9 PM
-
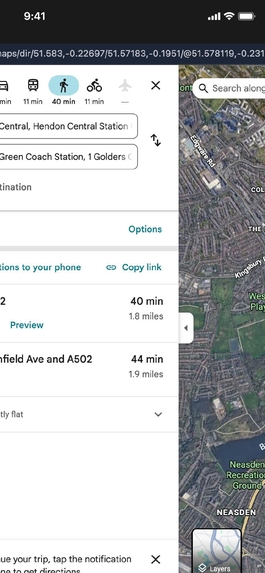
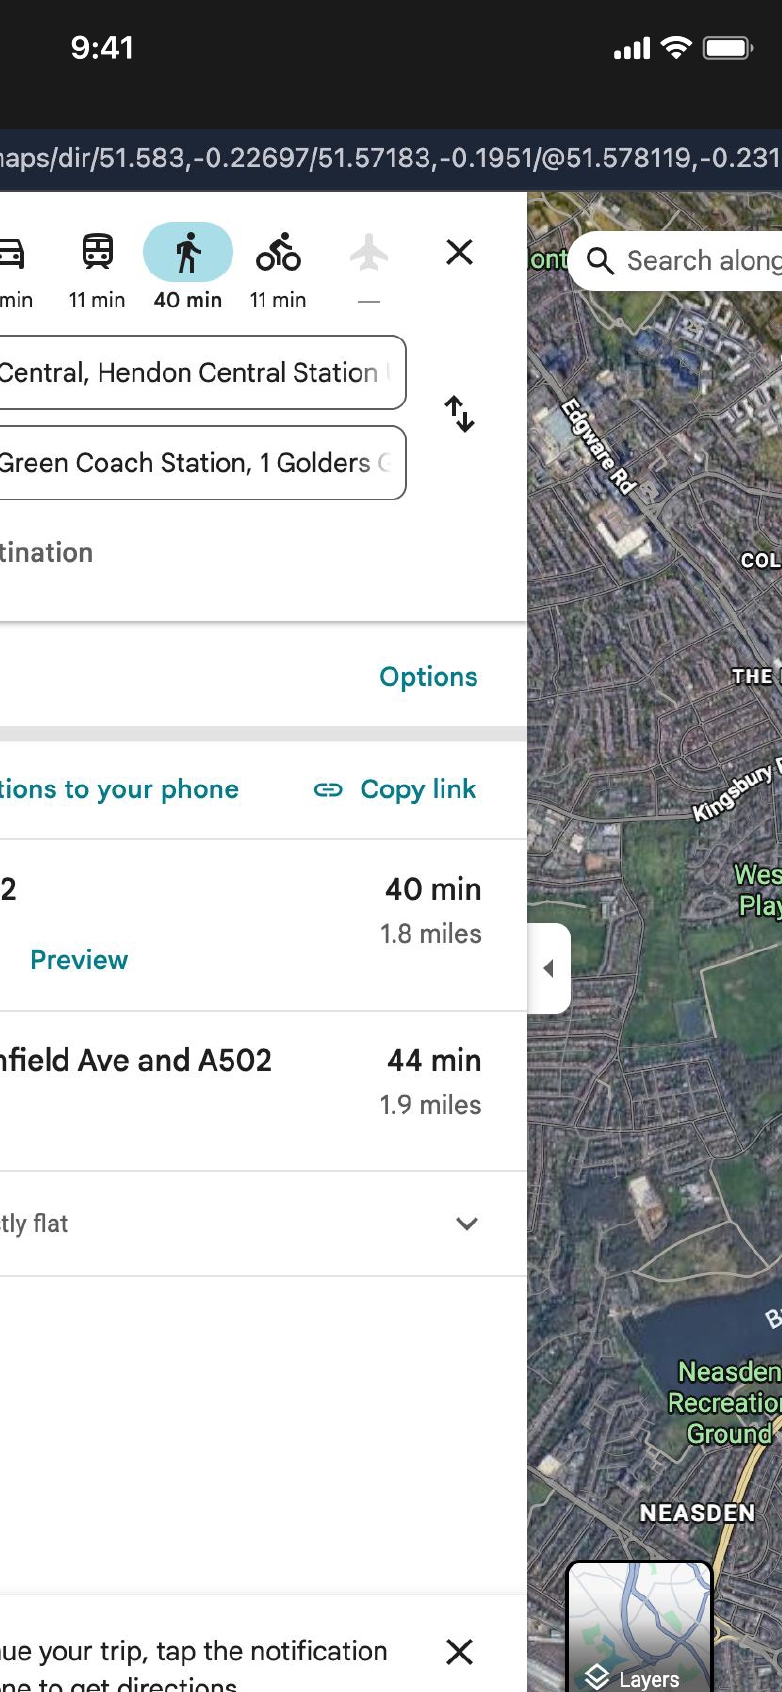
Google Maps walking navigation from safest route

Inspiration
Every night, there are students leaving late evening lectures, shift workers finishing after midnight, and people catching the last train face the same silent calculation: is this route safe? Right now, that decision relies entirely on gut feel and people consistently have to stay cautious. There's no tool that tells you the stretch of footpath ahead is unlit, that foot traffic drops off at 9pm, or that a reported hotspot sits two blocks from your shortcut. The data exists. It's just never been assembled into something useful at the moment it matters most.
What it does
SafeWalk lets users enter a start point, destination, and departure time, then returns a safety-scored route alongside other alternatives. Danger levels by colors (green-yellow-red) are built from several live data layers: street lighting coverage, regional crime statistics, foot traffic density, and proximity to open businesses. A community reporting feature lets users flag unsafe stretches in real time, feeding directly back into the model so it improves with every walk taken.
How we built it
The backend runs on Python FastAPI with SQLAlchemy and GeoAlchemy2, deployed on Railway. The frontend is Next.js 16 with TypeScript and Tailwind CSS on Vercel. We use PostgreSQL with PostGIS 3.3 on Supabase for geospatial queries on community reports.
The scoring engine is an XGBoost gradient-boosted model trained on 8 features via knowledge distillation. Features include crime count, crime severity, street lighting density, public transport proximity, and hour of day with sin/cos encoding so the model treats midnight and 11pm as adjacent. It achieves R² = 0.9975 on held-out test data.
We trained on real data: 6,425 crime incidents from data.police.uk, 7,681 street lights, and 478 public transport stops across North London. Routes come from Google Maps Directions API with walking mode and alternatives enabled. The ML model is hot-swappable through a single environment variable, so we can flip between the trained model and the rule-based fallback without touching any code. The heatmap grid covers 360 points, computed lazily and cached in memory. First request takes about a second, everything after that is instant.
Challenges we ran into
Few free, granular safety APIs exist. UK Police data was localised and aggregated by area rather than precise coordinates, so we used ML to approximate street-level danger scores from the available features.
Railway's standard Postgres doesn't include PostGIS. We discovered this mid-deploy and pivoted to Supabase, which ships PostGIS by default, while keeping Railway for the backend.
Our initial scoring weights were tuned for mock data with about 200 crimes. Real London data had 6,425 in the same area and every location maxed out the crime penalty. We switched to square-root severity scaling to compress the long tail and added public transport as a "busy area equals safer" signal.
Building the scoring model required careful iteration. Choosing between gradient boosting and neural approaches, deciding on feature engineering, and tuning hyperparameters. Our teammate explored a hybrid CNN-Transformer approach for spatial pattern recognition, which surfaced challenges around activation functions, layer depth, and vanishing gradients before we settled on XGBoost for the MVP.
Linking a computed grid of safety values to a real interactive map was harder than expected. The heatmap had to align geographically, adapt to zoom level, and blend visually without obscuring road labels.
Our first mock routes were hand-drawn waypoints that rendered as ugly straight lines. We wrote a script to call the real Google Directions API and save decoded polylines with 144 to 332 points per route so even mock mode renders smooth road-following curves.
Accomplishments that we're proud of
The thing we're most proud of is that it just works. Not "works on my machine" but works on a real phone, with real data, deployed live. You can pull it up right now, search a route, and get a genuine safety score backed by real UK crime data and a trained ML model. For a 48-hour hackathon, that felt like a real achievement.
We're also proud of how the team came together. We split the work cleanly and everything plugged in seamlessly because we designed the interface contract upfront. The scoring engine is genuinely hot-swappable: one environment variable flips between rule-based and ML scoring with zero code changes. That's how we actually developed, testing both engines side by side.
The community feedback loop is something we're genuinely excited about. Flag a dark underpass, re-search your route, and watch the nearby segments shift from yellow to red. The system is reactive and the data persists.
Feature importance from the trained model confirmed what we intuitively expected: time-of-day dominates at 60% importance. The model learned that independently from the data. Seeing the ML validate the real-world intuition that walking the same street at 2pm vs 11pm is a fundamentally different safety proposition was a satisfying moment.
What we learned
The biggest lesson was how much you can build in 48 hours when you have a clear scope, a clean architecture, and enough caffeine to keep going at 3am. We went from an empty repo to a fully deployed ML-powered safety app with real data, community reporting, and a polished mobile UI.
On the technical side, we learned machine learning end-to-end as a team. Not just calling an API but actually engineering features, understanding why sin/cos encoding matters for cyclical time data, training a gradient-boosted model, interpreting feature importance, and deploying the artifact in production. Knowledge distillation turned out to be the perfect hackathon strategy: when you don't have labelled data, train your model to replicate your best heuristic, then let it generalise.
We also learned that real data breaks everything. Our mock dataset had 200 crimes. London had 6,425. Every assumption about scoring weights and feature importance shattered the moment we plugged in real data. The lesson is to always build with real data from day one, even if it's messier.
Execution over ideation was advice the event coordinator gave us and we took it literally. We built the mock scoring engine first so the full app worked end-to-end on day one, then improved each layer independently. That meant we always had a working demo and were never in the "it'll come together at the end" danger zone.
And honestly, we learned how to work as a team under pressure. Splitting the work cleanly, agreeing on interface contracts early, and trusting each other to deliver. That's a skill that goes beyond any hackathon.
What's next for SafeWalk App
The immediate next step is richer data. Right now we score routes using crime, street lighting, and public transport, but there's so much more signal out there. Pubs, late-night venues, and 24-hour businesses create natural foot traffic that makes streets safer after dark. CCTV coverage, pedestrian crossing density, and vegetation blocking sightlines are all features the model could learn from.
We want to expand geographically. The architecture is already city-agnostic. Swap in a new crime dataset and lighting file, retrain the model, and SafeWalk works for a new area. The UK has open police data nationally and similar datasets exist in the US, Australia, and parts of Europe. To get there we'd partner with local governments and councils who hold the most granular data like street-level lighting maintenance logs, reported hazards, and planned infrastructure changes. That turns SafeWalk from a consumer tool into a genuine urban planning resource.
On the ML side, the next evolution is real user feedback. Let walkers upvote or downvote route scores after they've actually walked them. That creates genuine supervised training labels and lets the model learn patterns that no formula could capture, like "this park feels safe at 6pm but not at 10pm" which only emerges from lived experience.
Other features on the roadmap include real-time foot traffic estimation, an emergency SOS button with auto-location sharing, cycling and accessibility-friendly route scoring, and on-device ML inference for fully offline operation.
Built With
- css
- data.police.uk
- directionsapi
- dockerfile
- fastapi
- geoalchemy2
- google-maps
- javascript
- mako
- next.js-16
- node.json
- openstreetmap
- overpassapi
- placesapi
- postgis
- postgresql
- python
- react
- shell
- sqlalchemy
- tailwind-css
- typescript
- vscode


Log in or sign up for Devpost to join the conversation.