-
-

Welcome
-
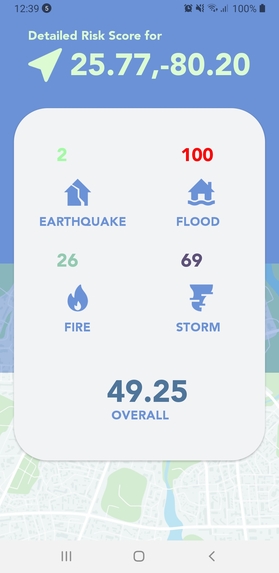
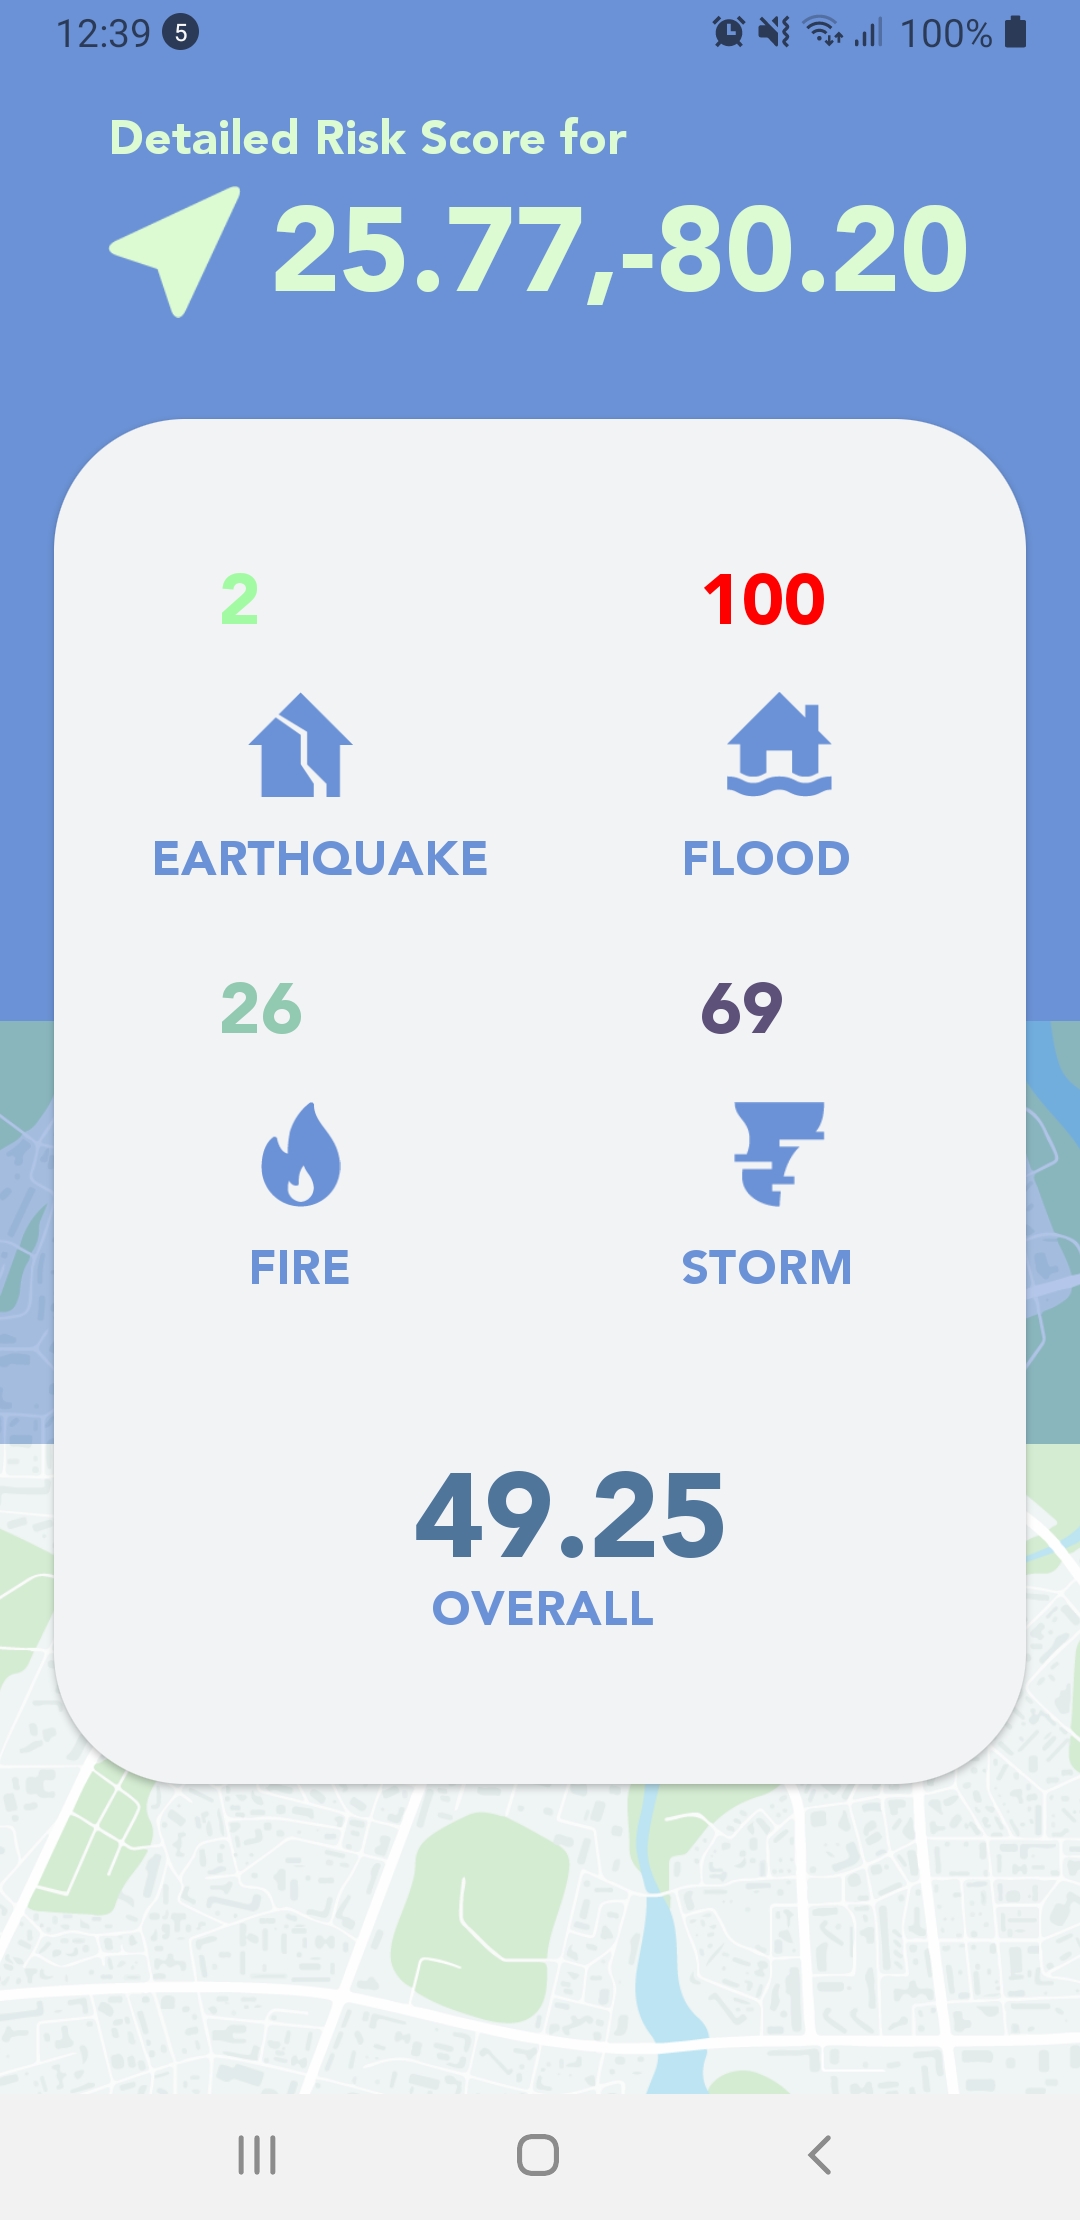
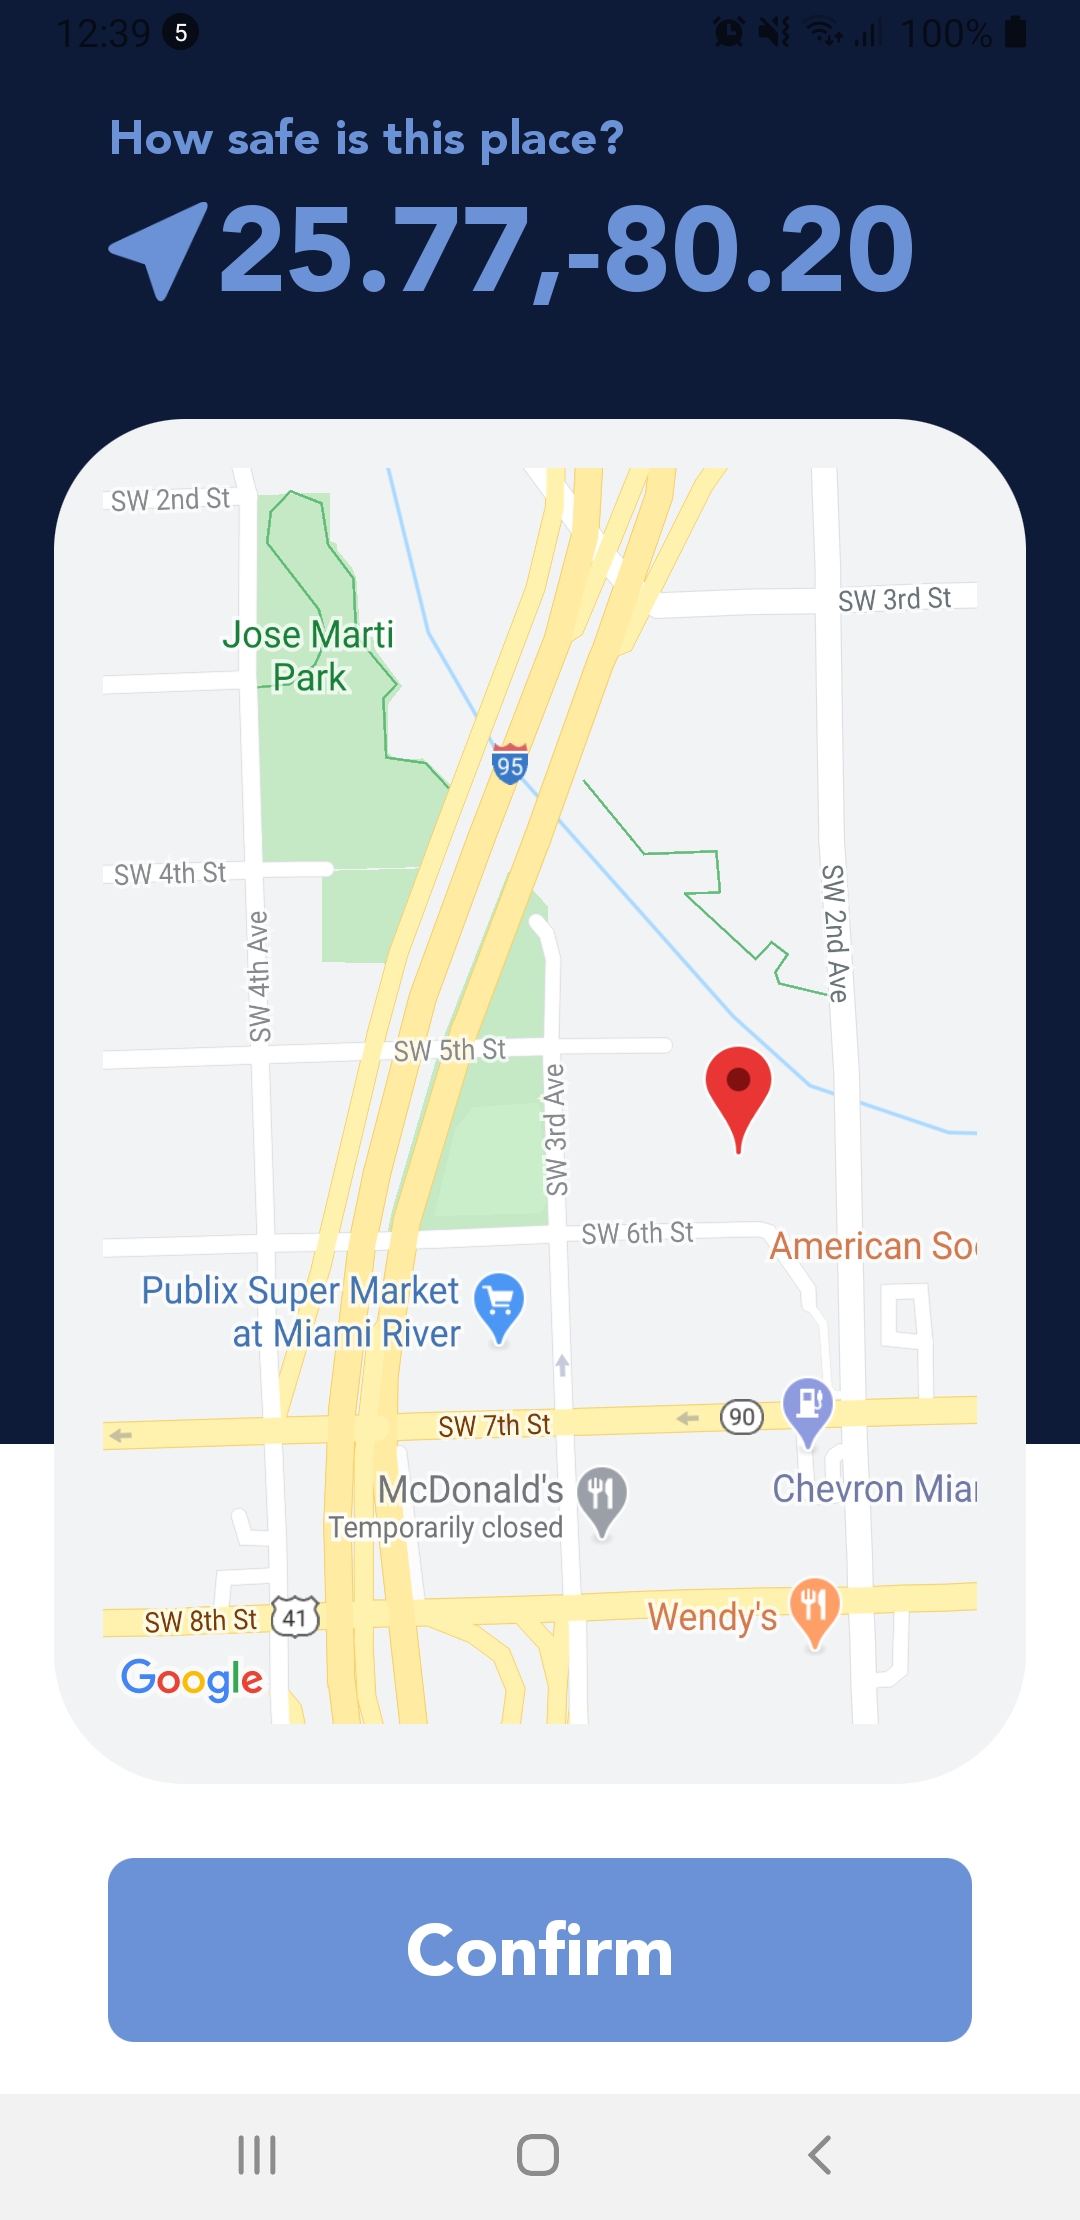
View detailed risk score
-

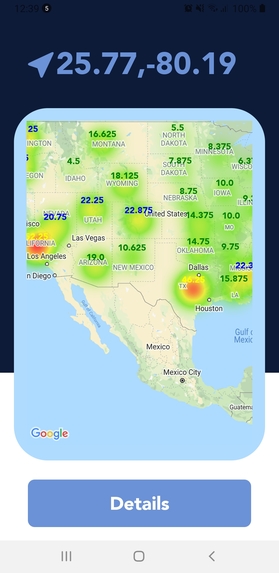
Select an area
-
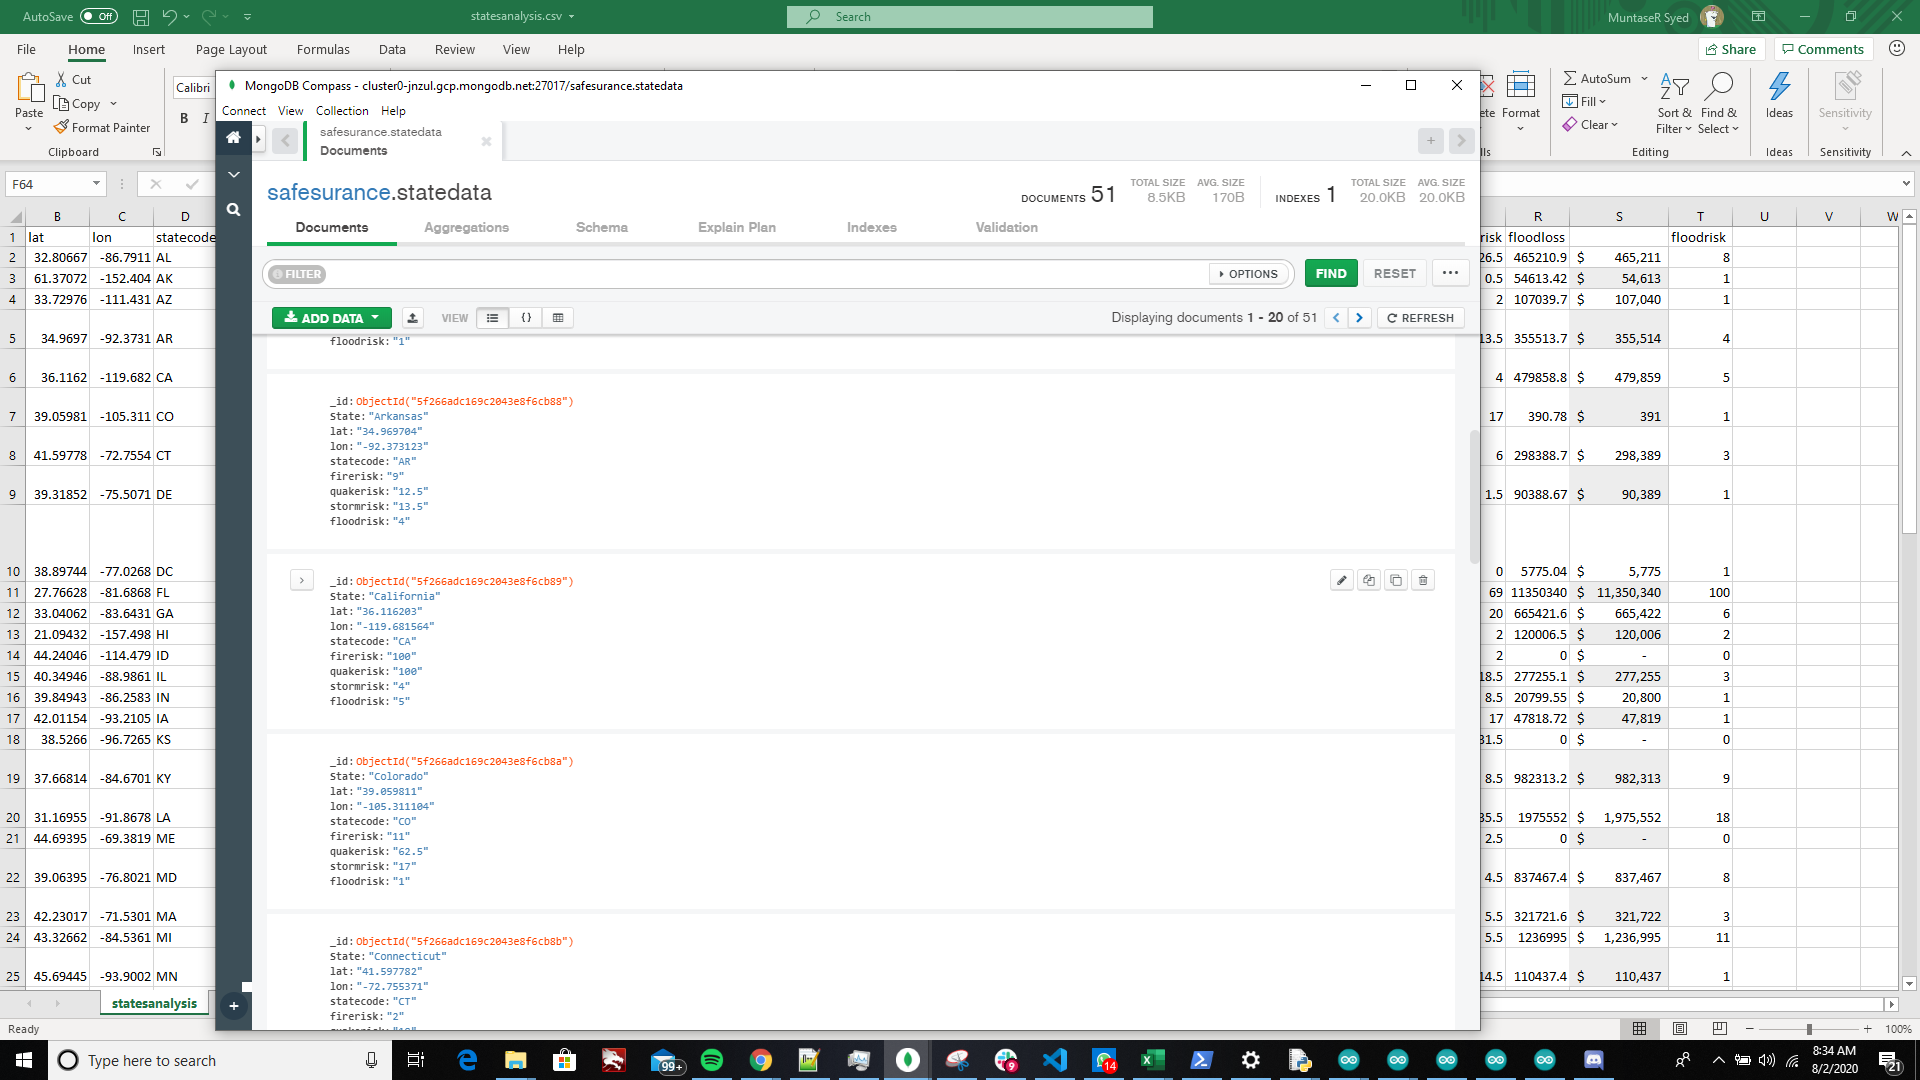
Risk Score for each state
-
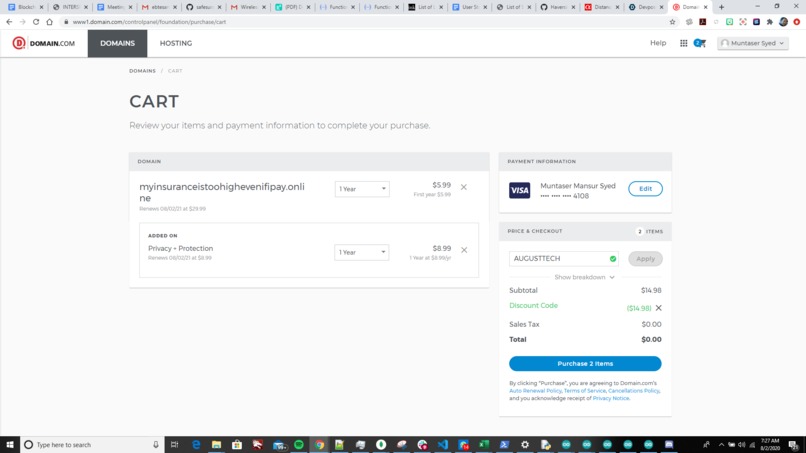
myinsuranceistoohighevenifipay.online
-
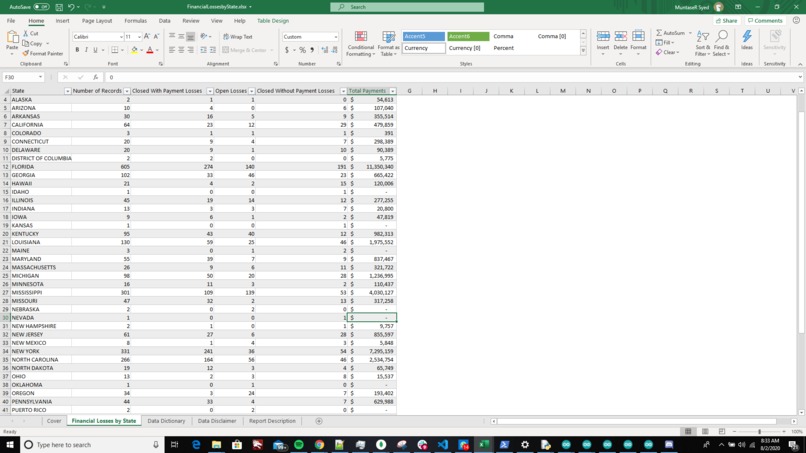
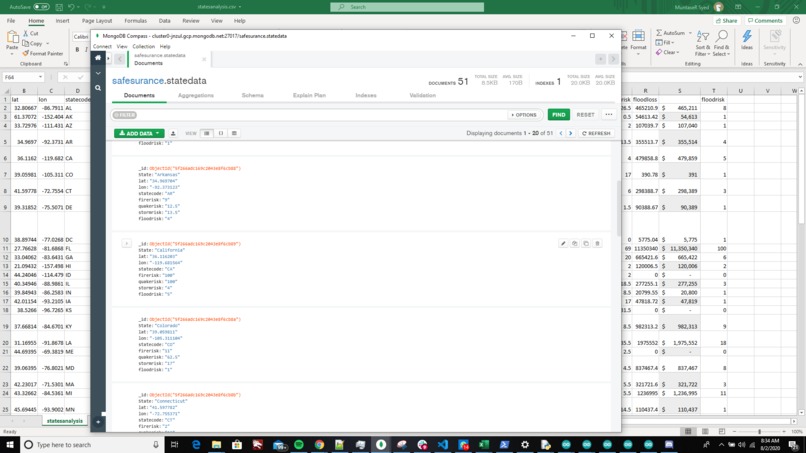
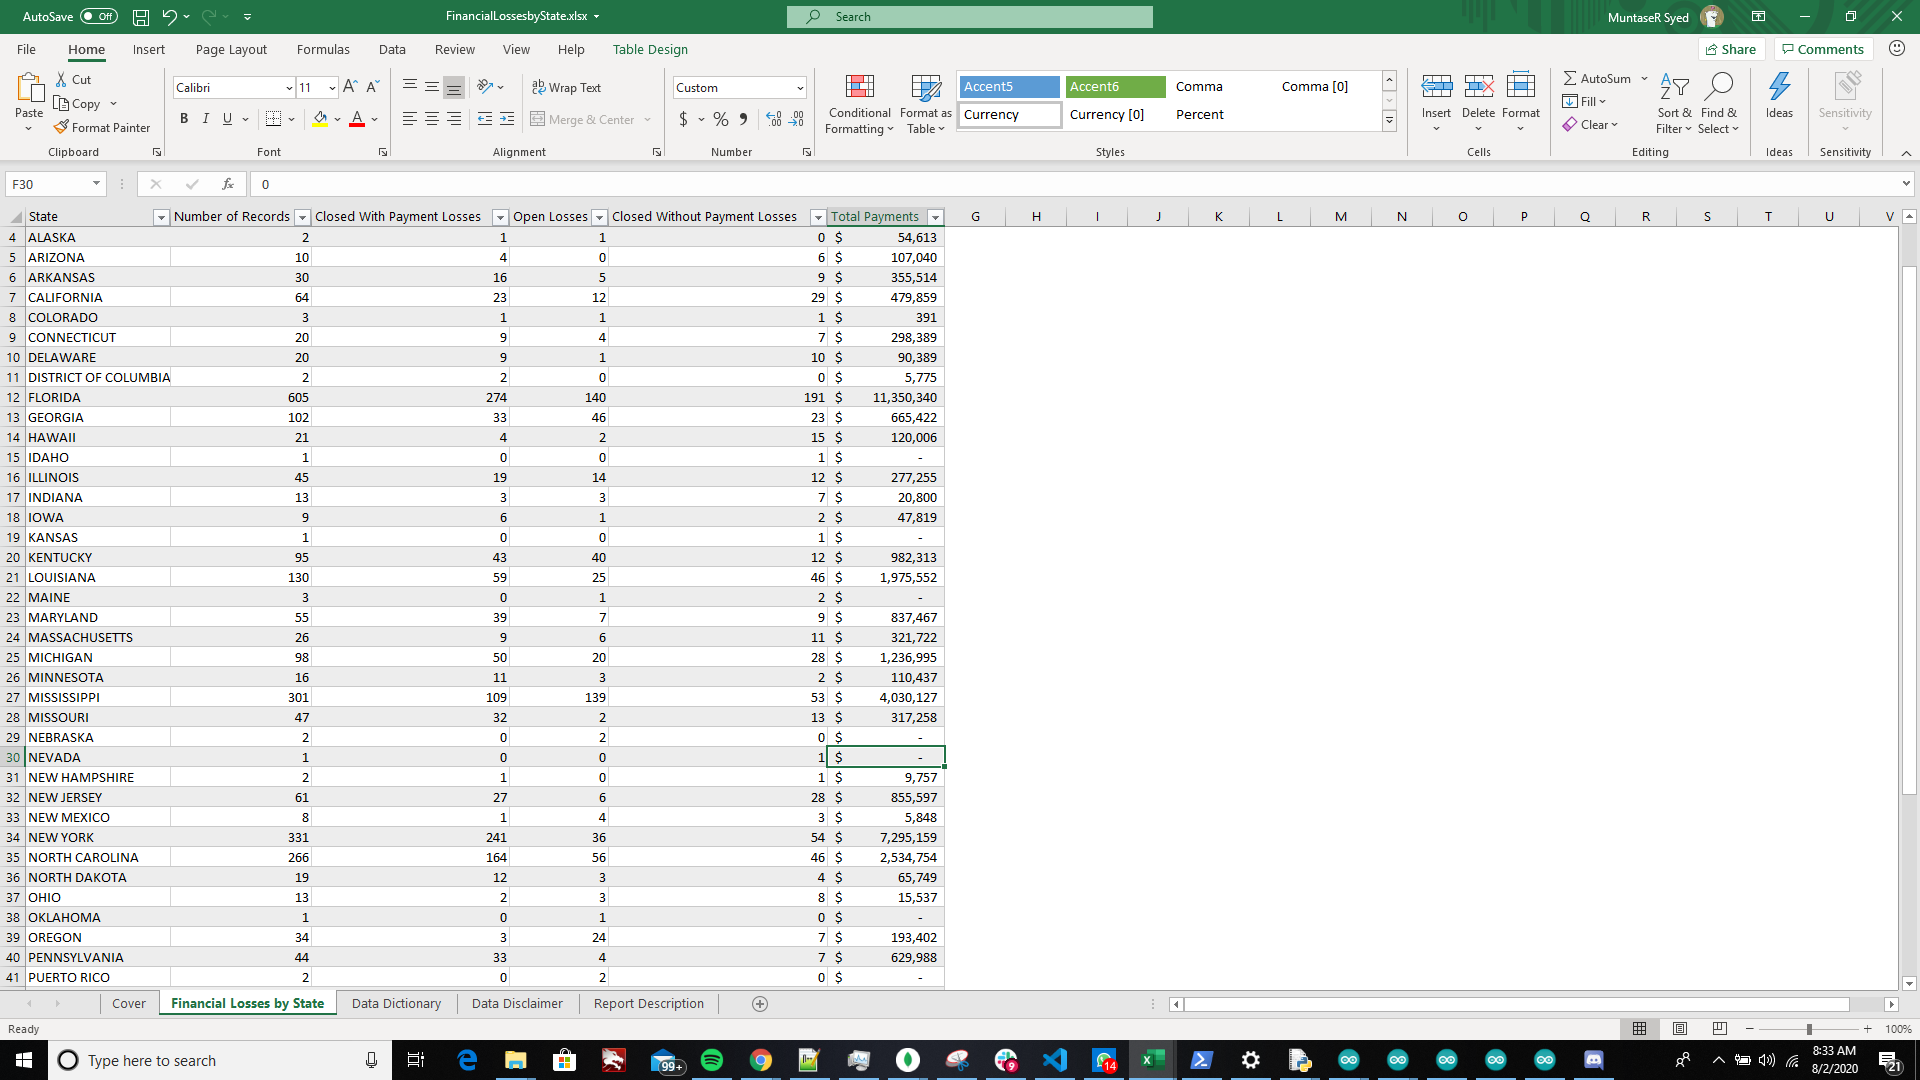
Financial data
-
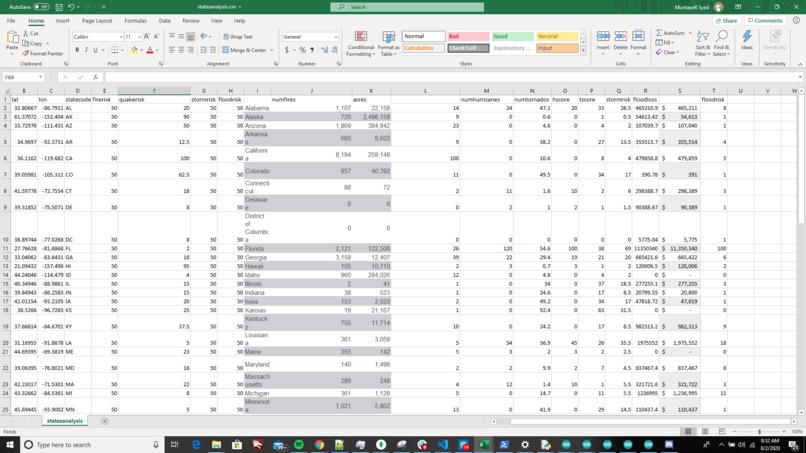
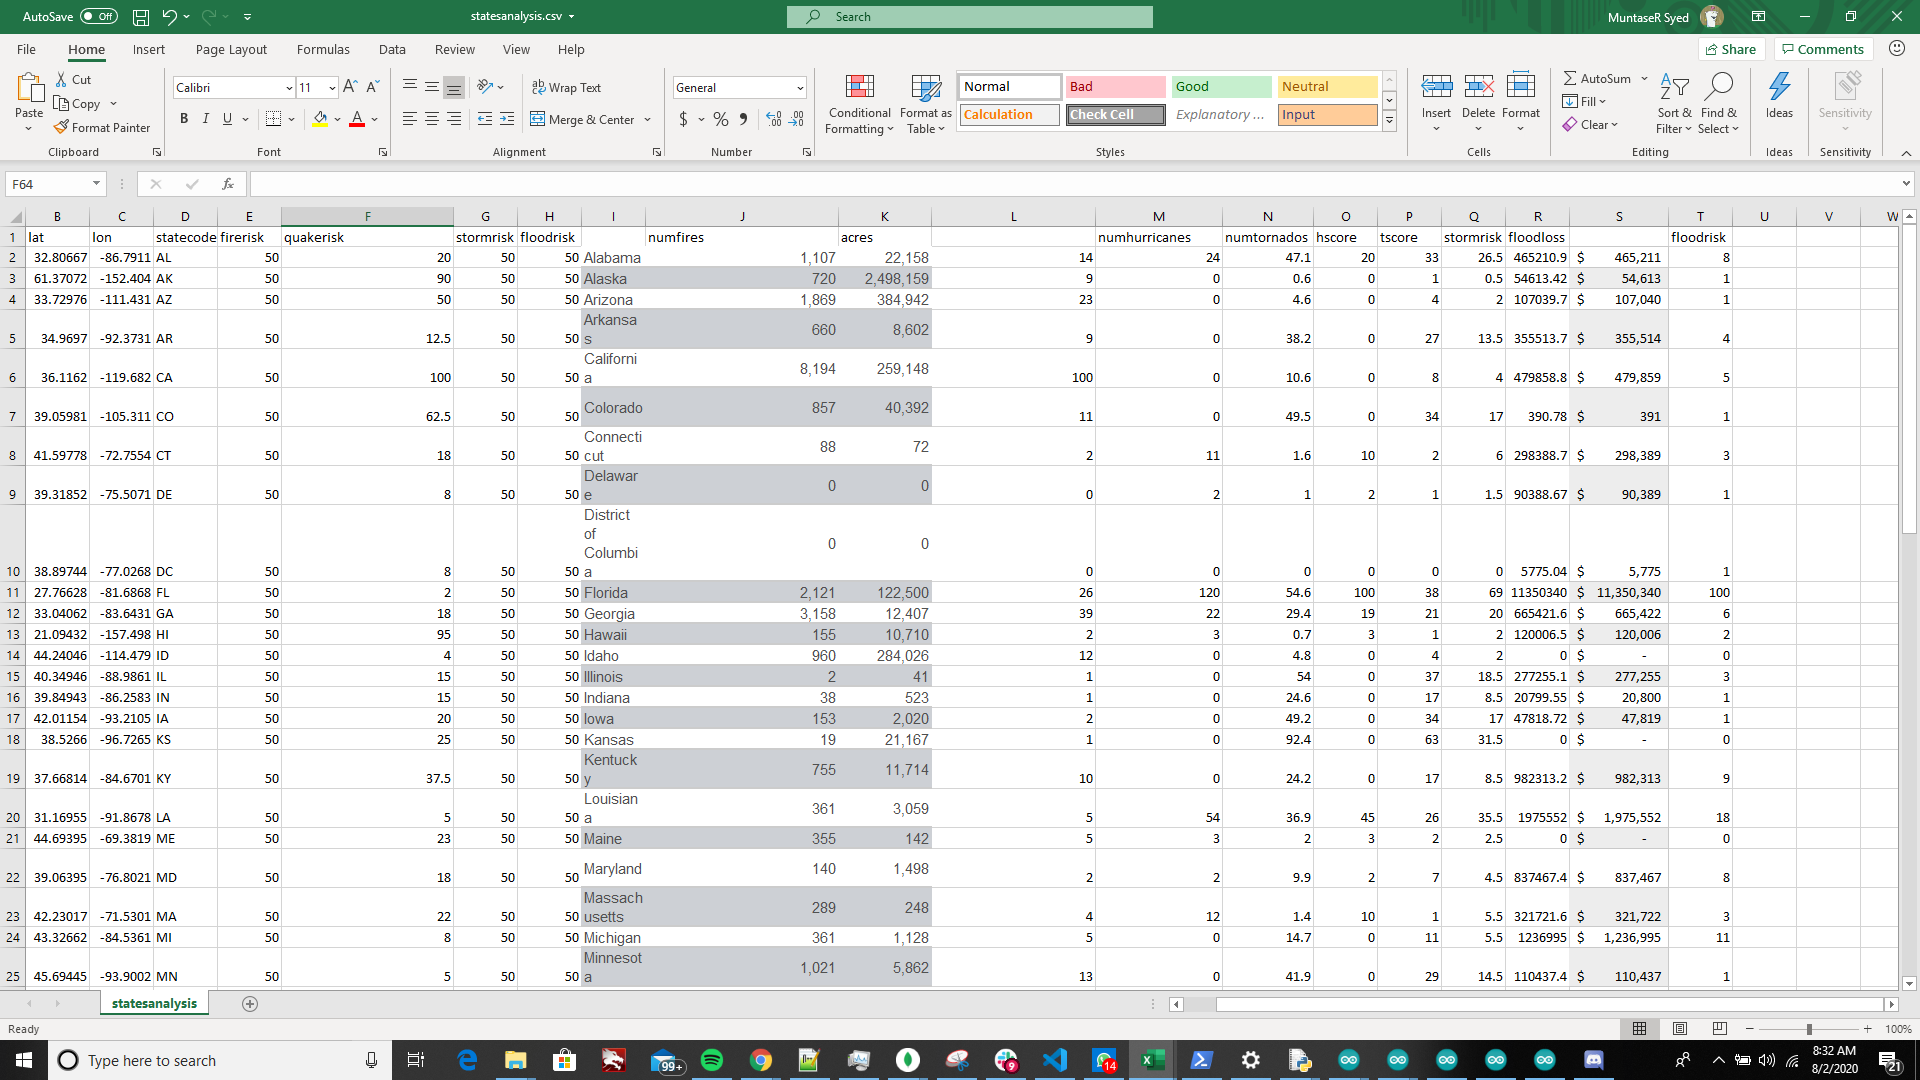
Flood, fire, storm data
-
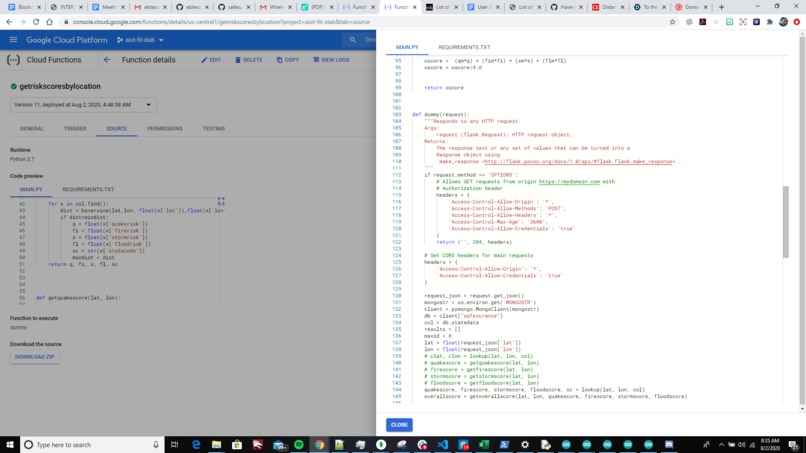
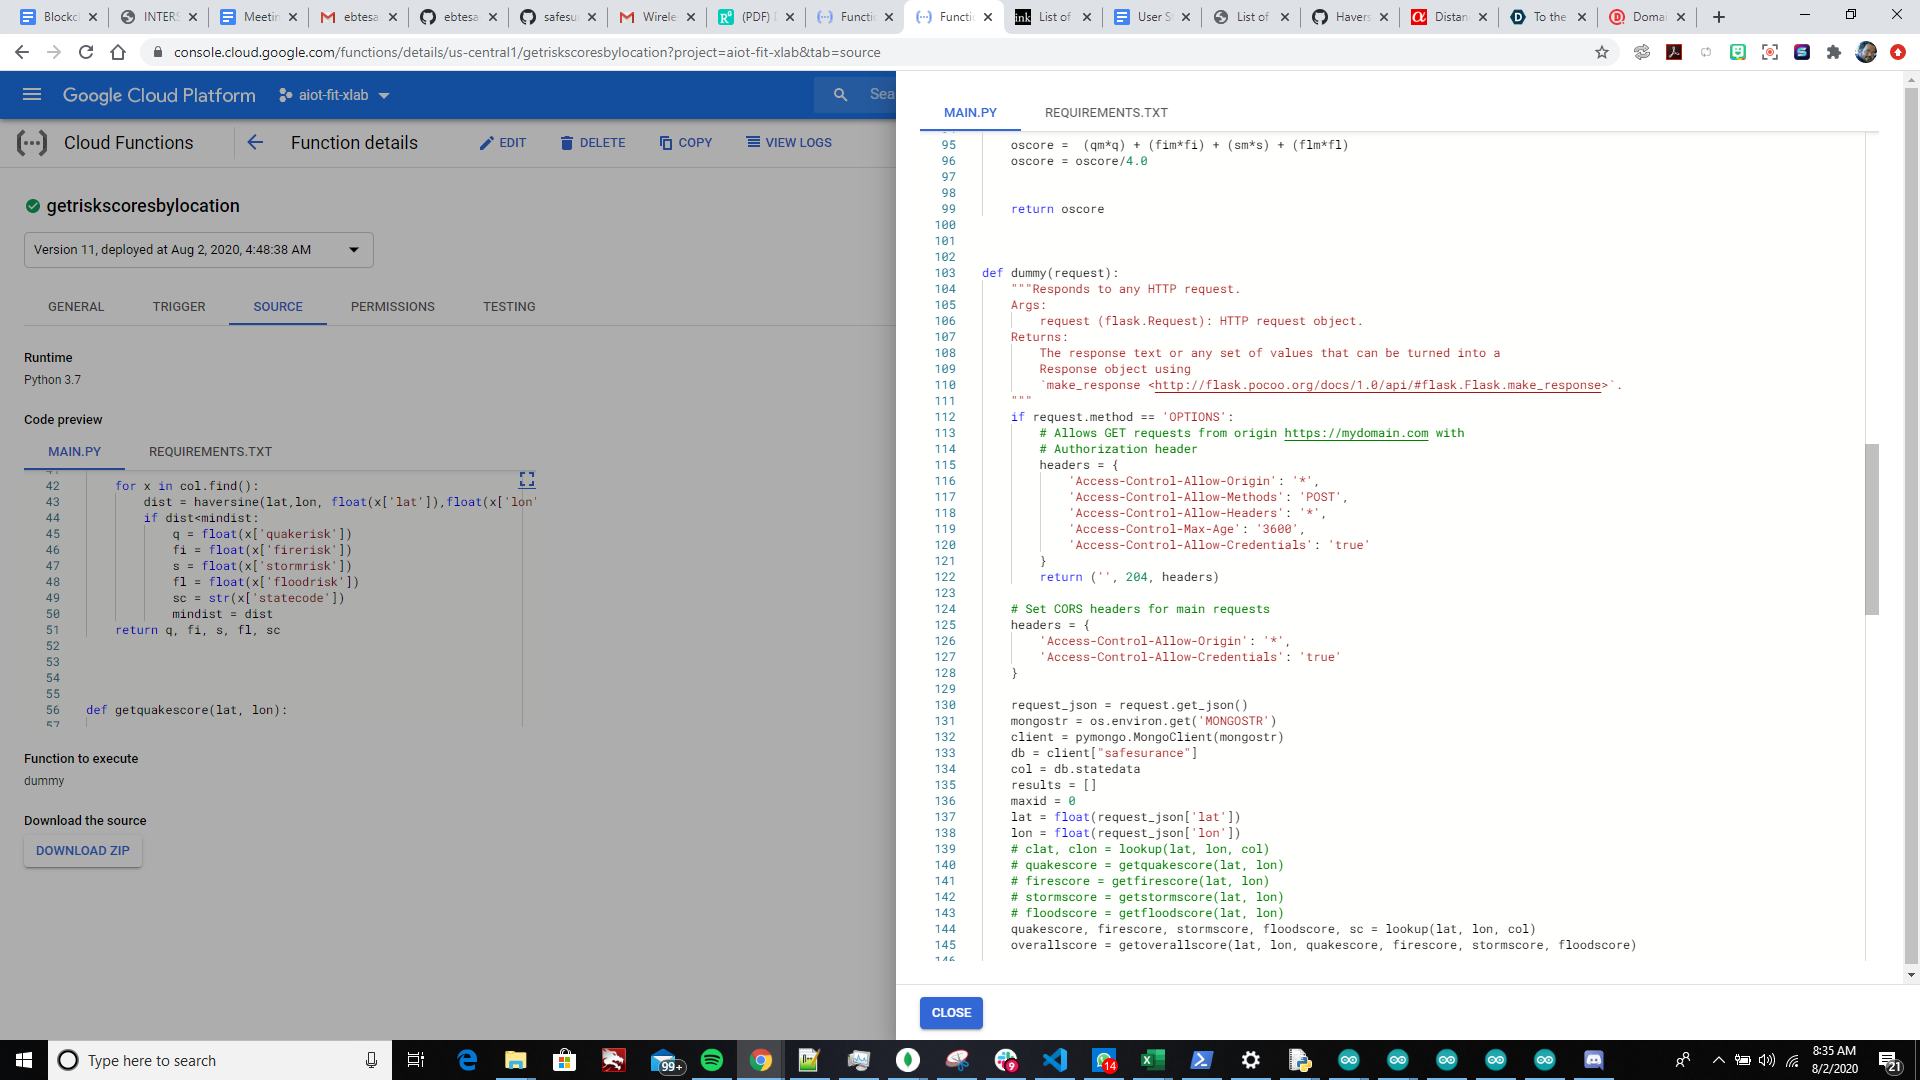
Endpoints
-
Scores


Inspiration
(Forbes) Natural disasters and insurance premiums continue to rise, and that's hurting our wallets.

What it does
Provides an overview of how susceptible your area is to natural disasters.

How we built it
Datasets:
- Earthquake: USGS

- Fire: NASA
- Flood: FEMA _ We also dug around a little to obtain financial lossses caused due to floods for each state_
- Storms: NOAA (Hurricane and Tornado history)

For earthquakes, USGS provided a granular dataset along with the probability of the magnitude of damage around the fault lines. Fire risk score was calculated by taking into consideration the history of fires and the acres of land that were damaged by them in a particular area. Flood risk score was calculated by taking into consideration the financial losses caused by the floods in addition to damages. Storm risk was calculated using hurricane and damaging tornado data obtained from NOAA. We normalized all the scores to a scale of 1-100, with 100 being the most susceptible. An overall score was then calculating by taking an average of all the scores.
Challenges we ran into
Hacking while being stuck in a hurricane.
Accomplishments that we're proud of
Successully completing what we planned to finish this weekend.
What we learned
2010 had the most natural disasters.
What's next for Safesurance
Tie it to insurance
domain.com entry:
myinsuranceistoohighevenifipay.online ..

Log in or sign up for Devpost to join the conversation.