-
-
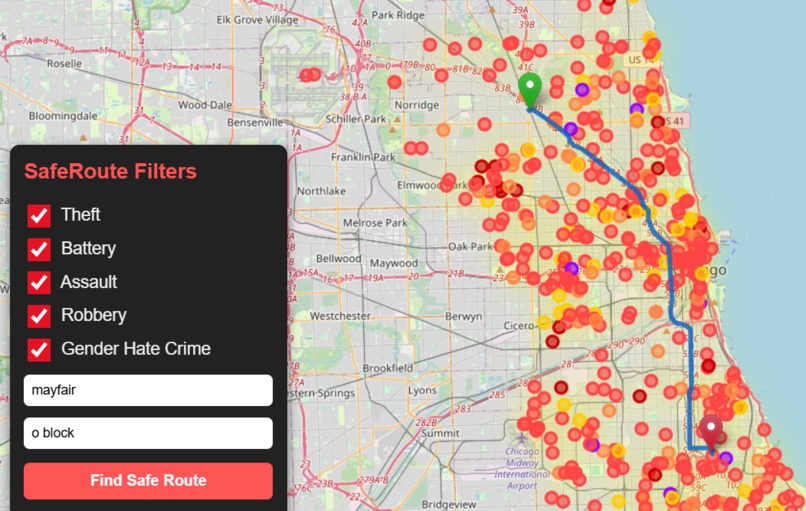
Set Route on the Map
-
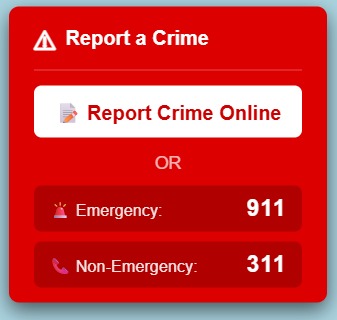
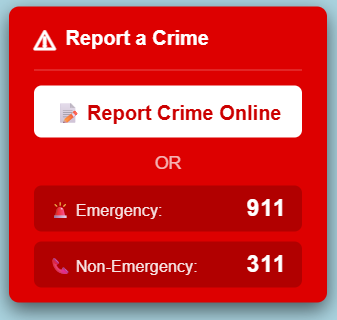
Hotline for Emergencies
-
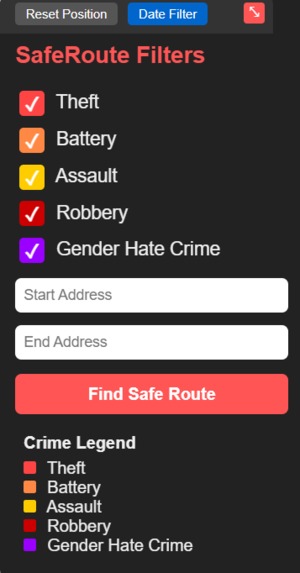
Filters by Crime Type
-
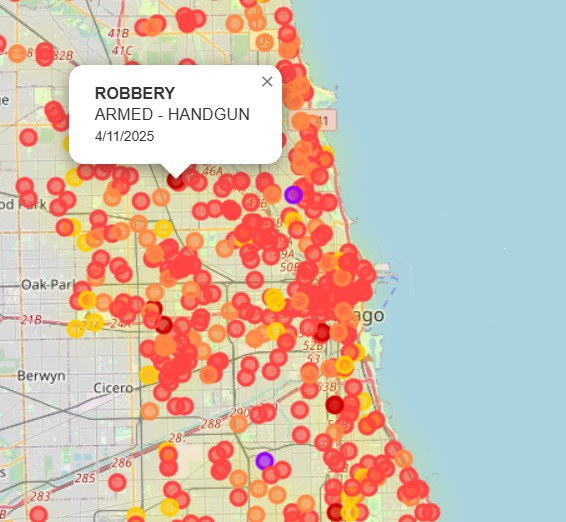
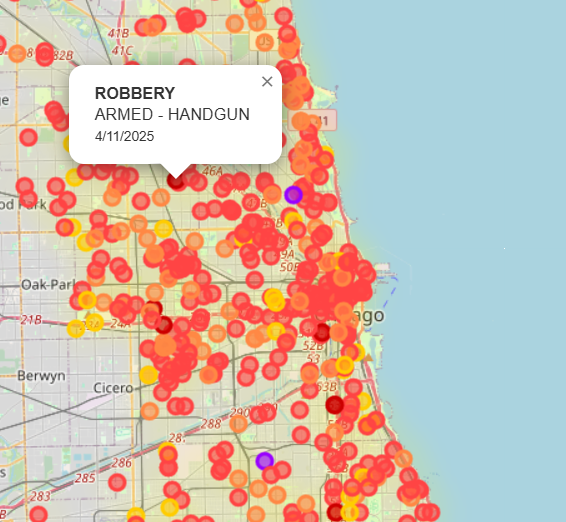
Brief details of Each Incident
-

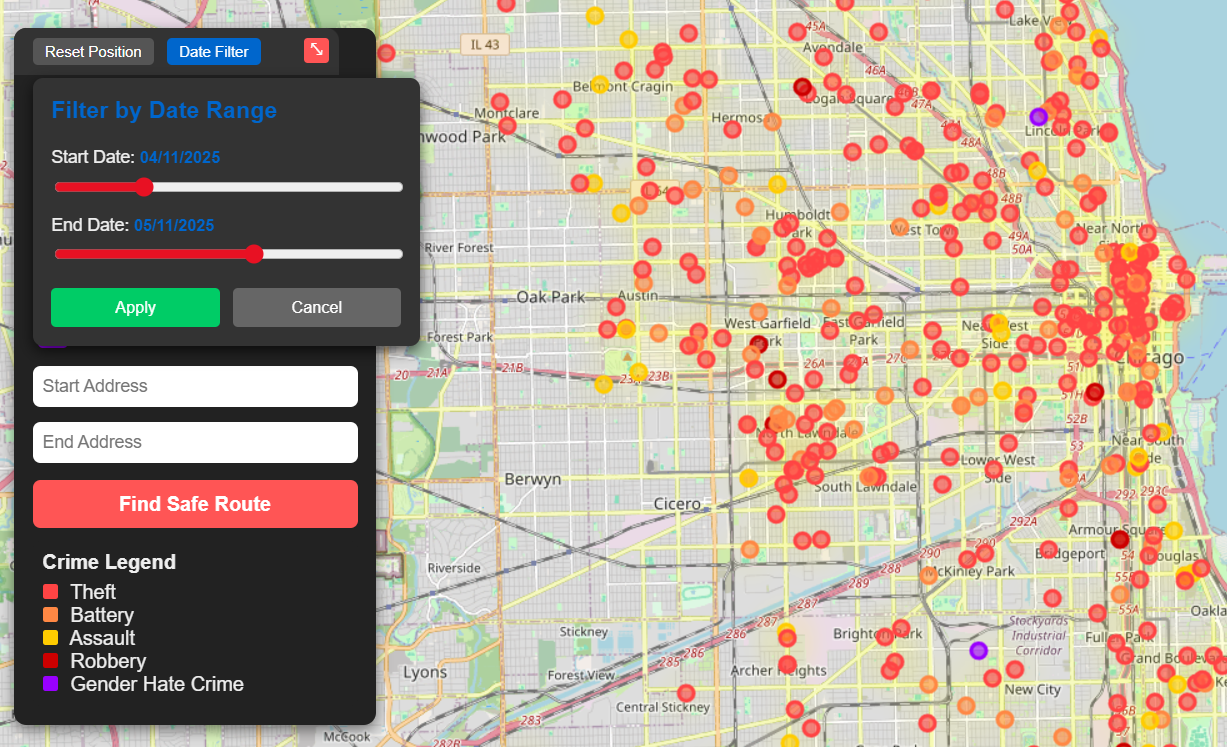
Date Filter for Crime
-
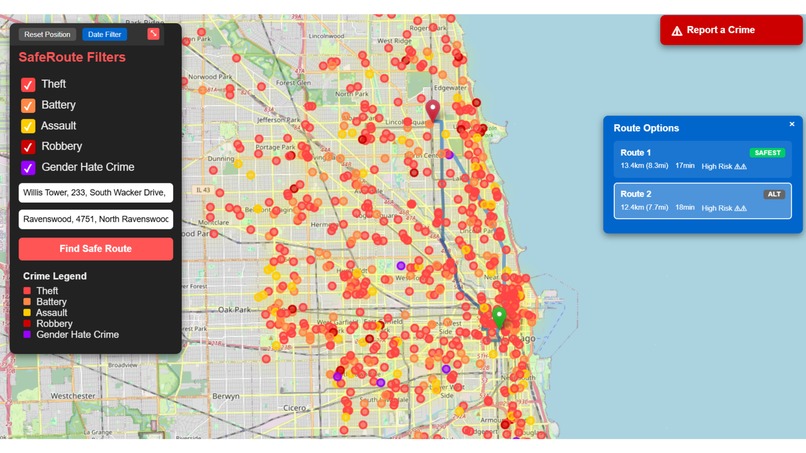
Comparison of Available Routes


Inspiration:
We wanted to create a tool that helps people feel safer while travelling, especially for those that live or commute in high-crime areas. Many people face harrassment, theft, or unsafe conditions, and we thought technology could help by visualizing these crime hotspots and suggesting safer routes.
What it does:
SafeRoute Crime Map shows real time crime data on an interactive map. The map shows users crime incidents as markers and heatmaps, and also colour codes these markers with various types of crimes, which include gender-related and hate crimes. It also allows users to enter a start and end location when travelling, and returns the most optimal route that avoids these hotspots, and analyses the route with respect to a safety level and crime score.
How we built it:
We built SafeRoute by pulling live crime data from Chicago's open-data API, which is very well maintained, regularly updated, and has data from 2011 to now. We cleaned and sorted the data into categories, then sent it to the frontend using a REST endpoint. On the frontend, we used Leaflet to draw the map, with Leaflet plugins for our heatmaps and details. We also placed markers, and let users toggle different crime types. We added a basic routing setup using Nominatim API so users can enter start and end points, and the map updates with safer paths. Most of our work went into making the map responsive, the data reliable, and the interface easy to use.
Challenges we ran into:
Heatmaps initially did not render properly. It took multiple iterations to get intensities and colour gradients working. Figuring out the logic for the map routing to minimize exposure to heat zones. Ensuring all the filters with markers and heatmaps worked as intended.
Accomplishments that we're proud of:
Created a fully functional, interactive map. Incorporated gender-based and hate crimes as a distinct category. Our safe route feature that allows users to implement their own start and end locations, and gave them a safe route that avoided dangerous zones.
What we learned:
We learned how to create routes from a start point to an end point using a Leaflet routing add-on. The plugin handled the path calculation, and our code layered crime data on top to show safer routes. This allowed us to draw routes directly on the map and highlight areas with higher or lower risk. Along the way, we also gained experience with HTML and JavaScript to build a responsive interface with filters and input fields.
What's next for SafeRoute Crime Map:
We would like to add predictive analytics to suggest safer travel times based on historical data. Expanding SafeRoute Crime Map to major cities/locations. Adding navigation options via subway/metro.
Built With
- html
- javascript
- leaflet.js
- nominatim
- openstreetmap
- osrm

Log in or sign up for Devpost to join the conversation.