-

Splash Page
-
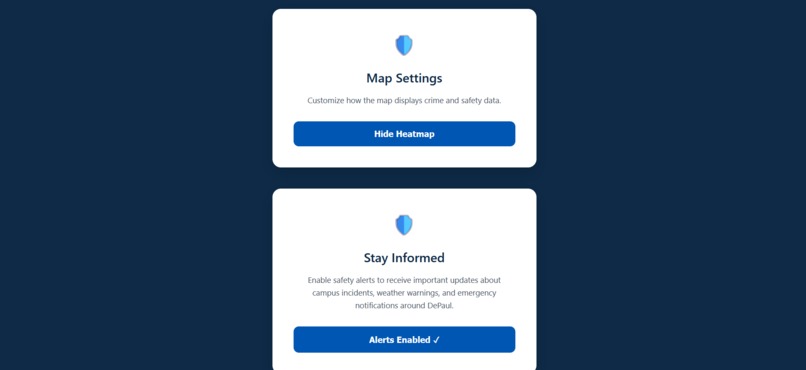
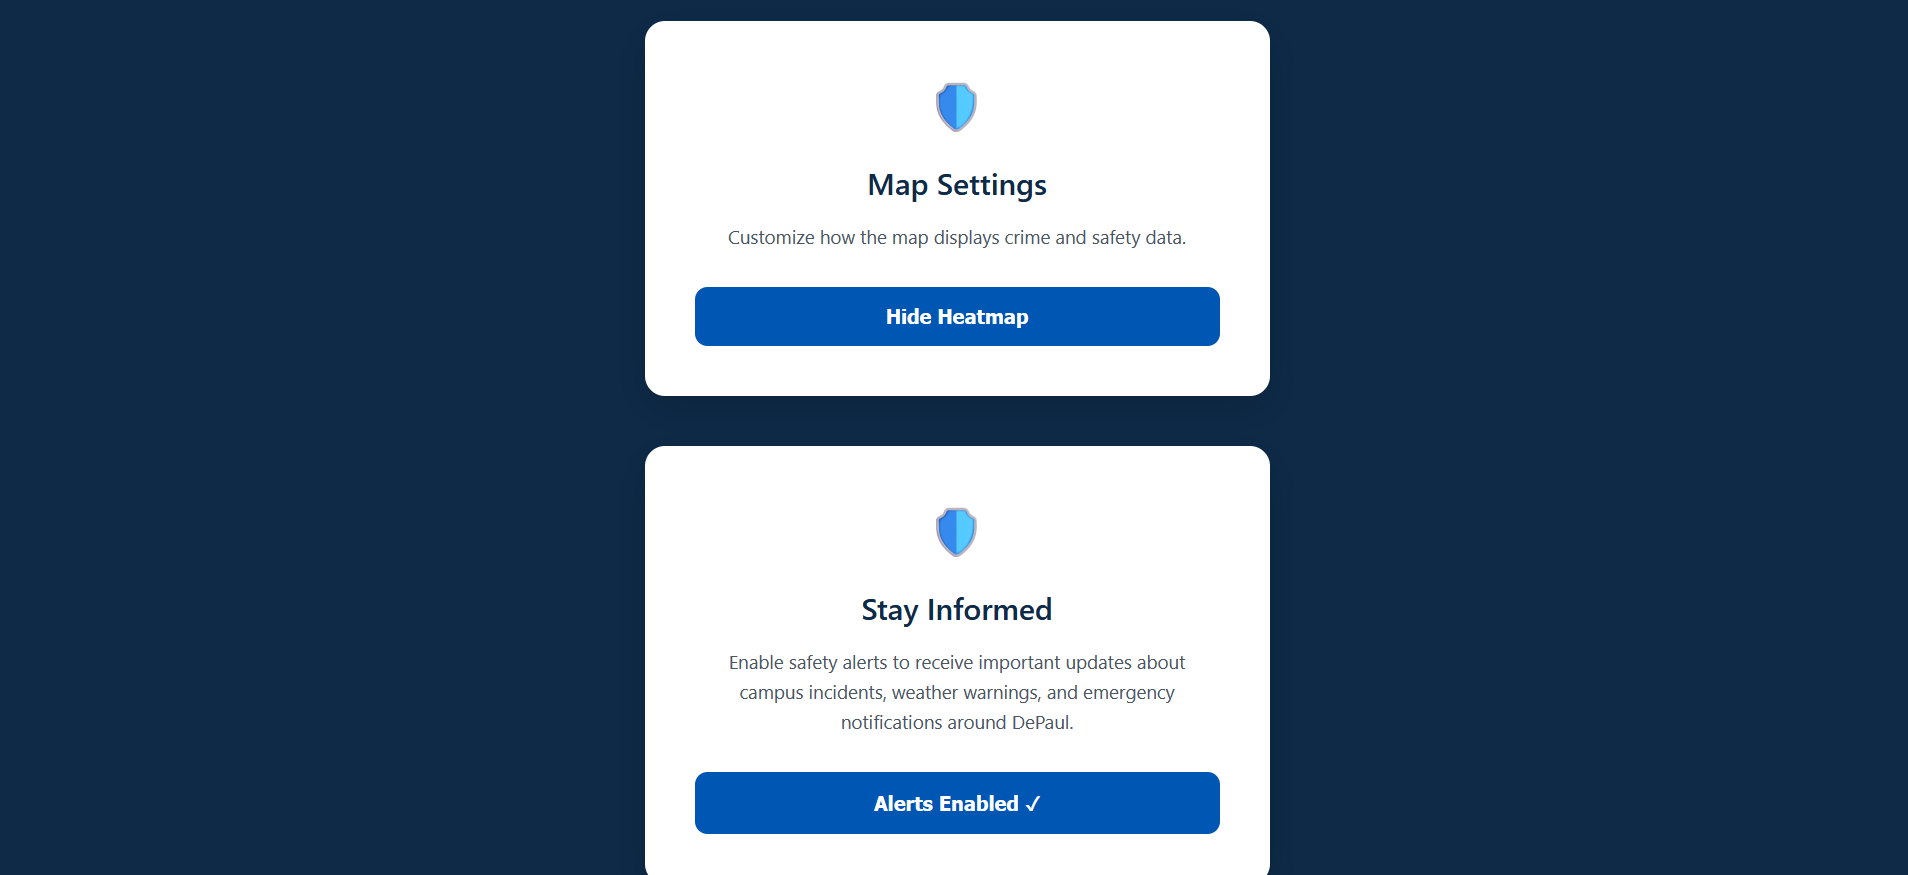
Settings Page
-
-
SafeBlue API
Inspiration
As college students in Chicago, safety is always on our minds. We noticed that critical incident information was scattered across multiple local news sources and RSS feeds, making it hard to stay informed about what's happening near campus. We wanted to build a centralized, real-time safety dashboard that aggregates this data for free — unlike Citizen — and presents it visually on a map so students can make smarter decisions about where they walk, when they commute, and how they stay safe.
What It Does
SafeBlue API is a real-time campus safety dashboard for Chicago university students. It:
- Scrapes crime and incident reports from 7 local Chicago RSS news feeds
- Uses Google Gemini AI to parse unstructured news text into structured incident data (type, severity, location, description)
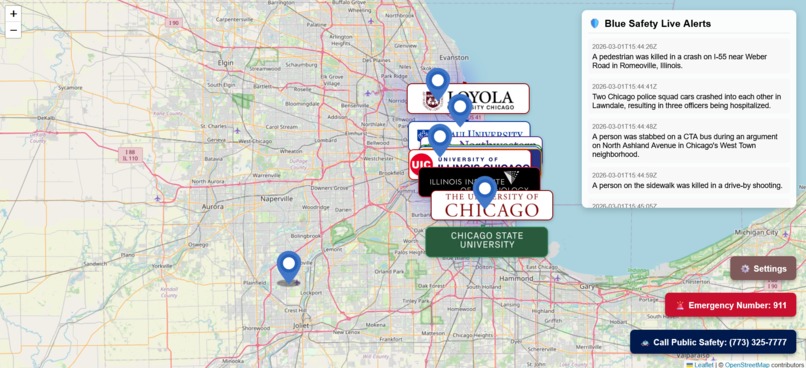
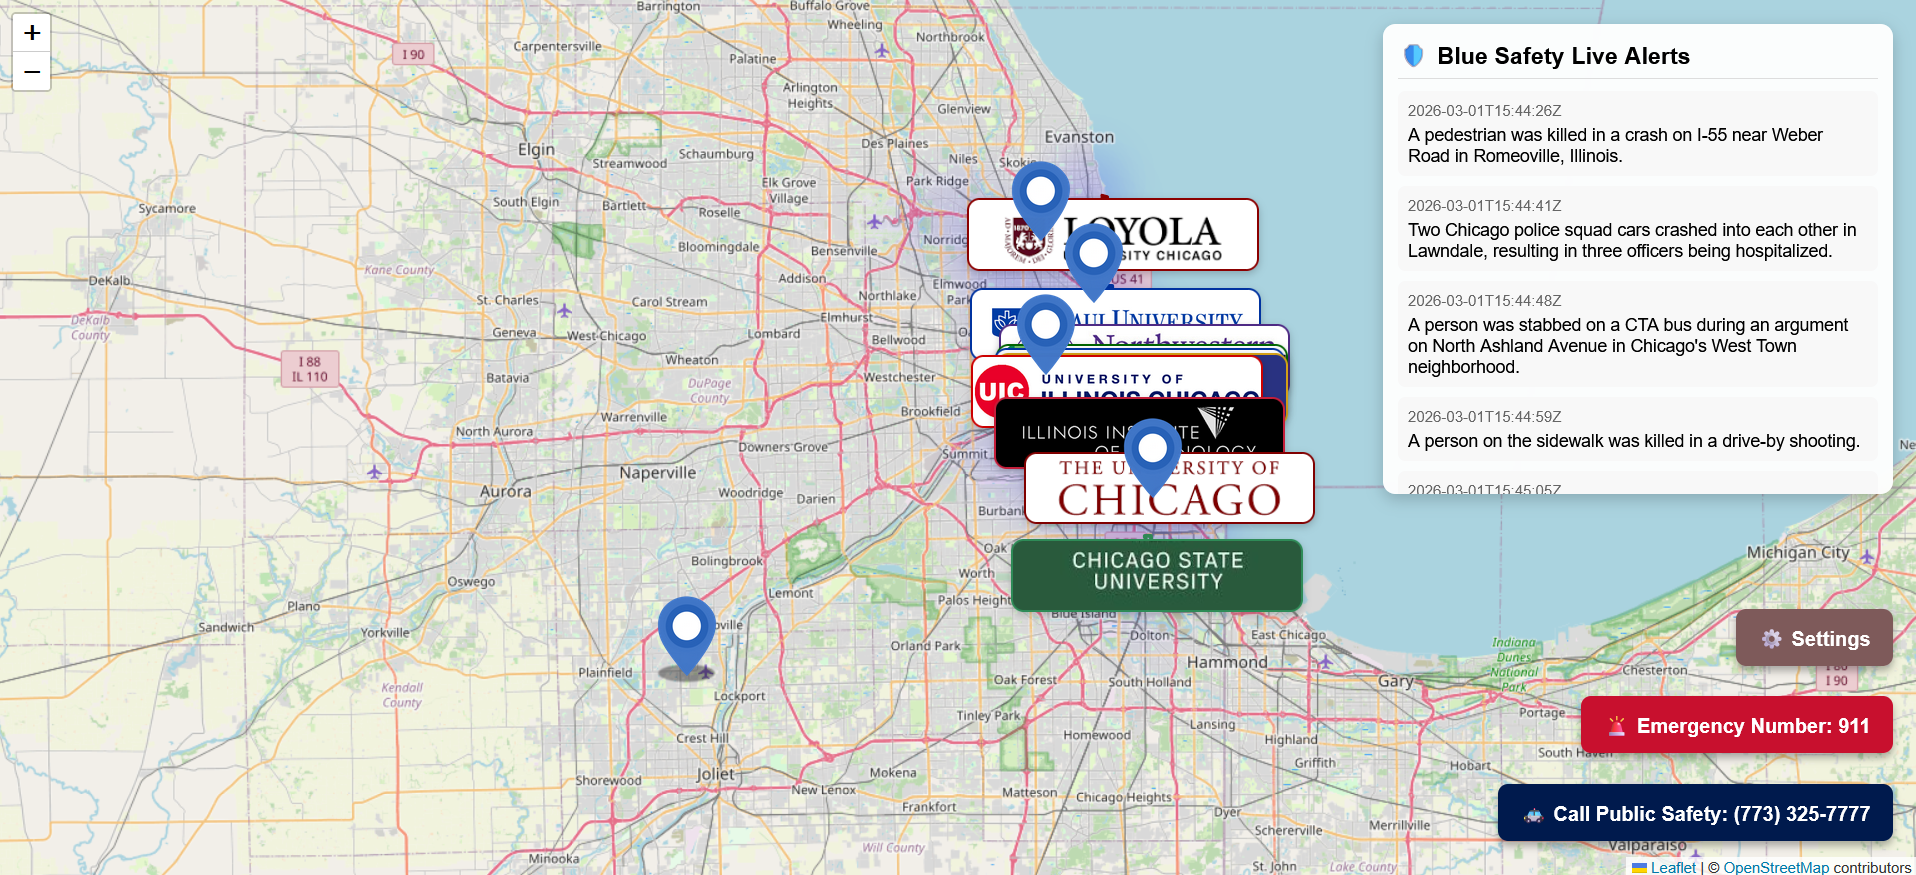
- Displays everything on an interactive Leaflet map with color-coded markers
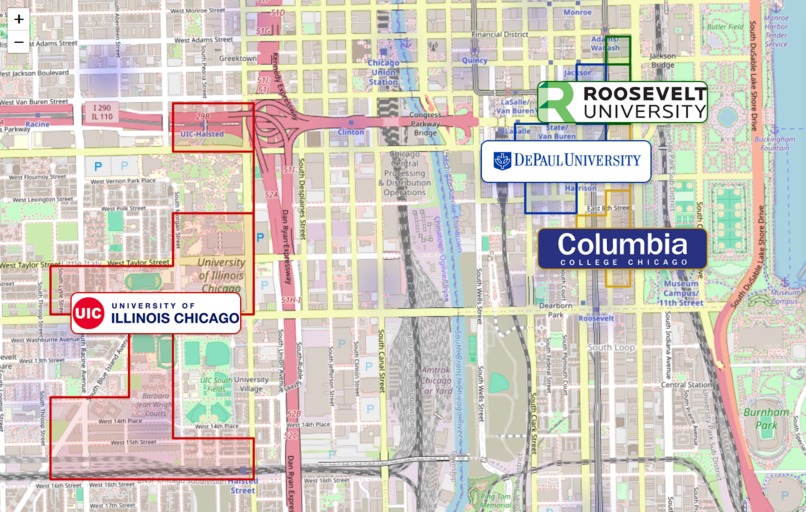
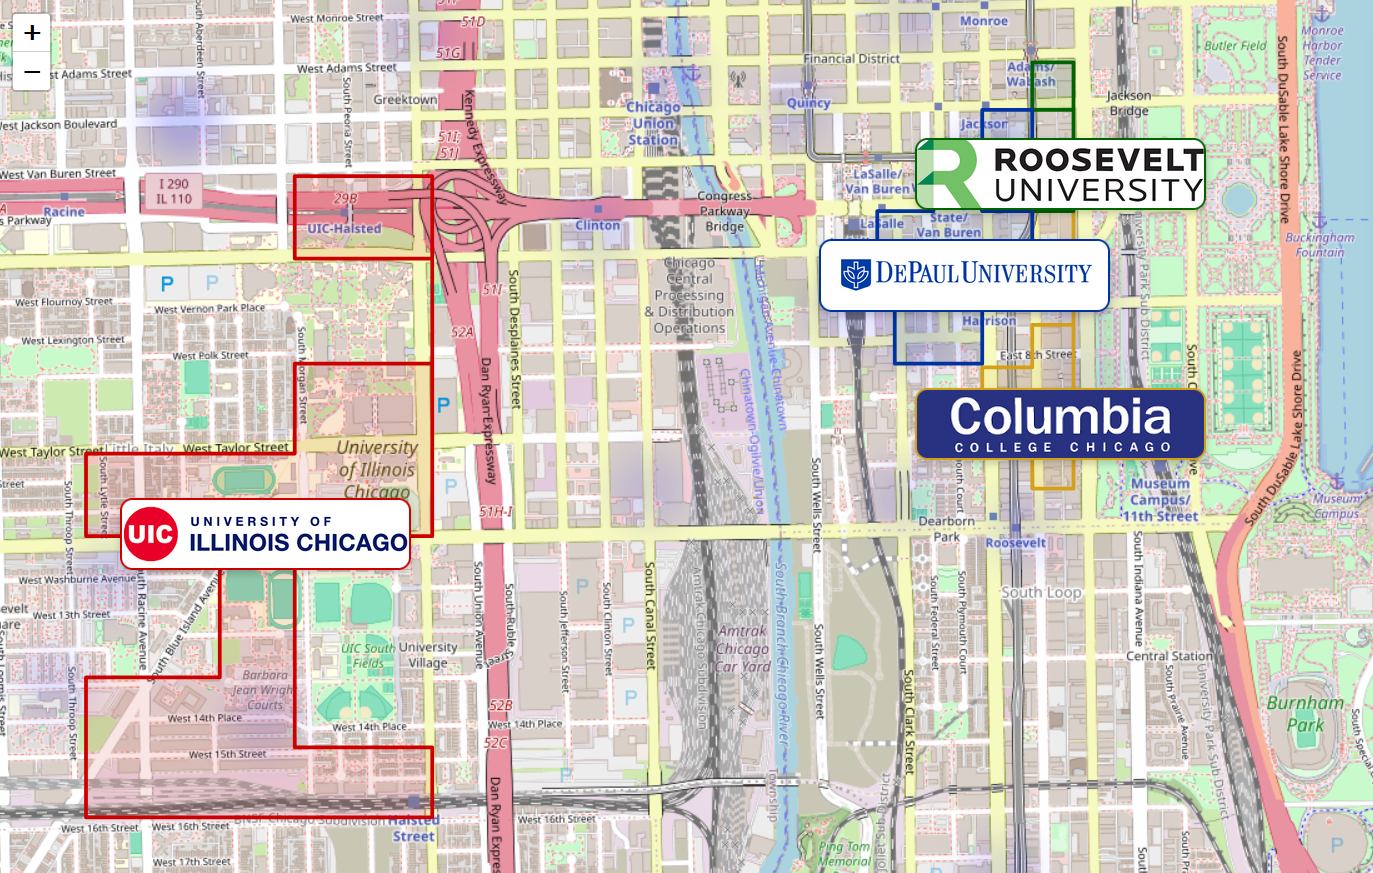
- Visualizes campus boundaries for 10 Chicago universities with color-coded polygons
- Provides a live alert feed — click any alert to fly to its location on the map
- Supports Firebase push notifications so users can subscribe to safety alerts

How We Built It
Backend — Python Flask API
The backend runs a multi-stage pipeline:
- RSS Ingestion —
feedparserscrapes 7 Chicago RSS feeds (CBS Chicago, ABC7, Block Club, etc.) - Filtering — Articles are filtered by safety-related keywords within a 24-hour window
- AI Parsing — Google Gemini 2.5 Flash processes raw news in batches, extracting structured fields
- Storage — Parsed data is stored in SQLite Cloud
# Example: Gemini extracts structured incident data from raw news
{
  "latitude": 41.8781,
  "longitude": -87.6298,
  "incident_type": "armed robbery",
  "severity": "high",
  "description": "Armed robbery reported near Loop campus..."
}
Frontend — React 19
- React Router for navigation between map view, alert feed, and settings
- Leaflet + React-Leaflet for the interactive map with custom markers and campus boundary polygons
- Firebase for web push notification subscriptions
// Example: Flying to an incident on the map
map.flyTo([incident.lat, incident.lng], 16, {
  animate: true,
  duration: 1.5
});
Database
- SQLite Cloud for persistent cloud storage of both raw news and AI-parsed incident data
AI Integration
- Google Gemini 2.5 Flash parses unstructured news articles into structured JSON with geographic coordinates, incident classification, and severity ratings
Challenges We Ran Into
- Gemini coordinate extraction — Getting Gemini to reliably extract accurate latitude/longitude coordinates from news articles that often lack explicit addresses.
- Noisy RSS feeds — Not every article from a Chicago news source is about a local safety incident, so we built keyword filtering and time-window logic to keep data relevant.
- Firebase push notifications — Configuring service workers, handling browser permission prompts, and making the subscription flow seamless took several iterations.
- End-to-end pipeline coordination — Making sure data flowed correctly from RSS scrape → AI parsing → database storage → frontend display.
- Frontend–backend integration — Connecting the React app to our Flask API, ensuring consistent data formats, reducing JS redundancies, and syncing real-time updates so the map reflected the latest parsed incidents without lag.
Accomplishments We're Proud Of
- Built a fully functional end-to-end pipeline that transforms raw, unstructured news into actionable safety data stored in SQLite Cloud — powered by AI
- Interactive map with 10 university campus boundary overlays and a crime heat map giving students immediate spatial context
- Live alert feed — click any incident and the map flies to that exact location
- Integrated 7 different Chicago news sources into a single unified feed for comprehensive coverage
What We Learned
- How to use Google Gemini's API for real-world NLP tasks like extracting structured data from messy, unstructured news text
- Working with geospatial data — plotting polygons for campus boundaries, geocoding incident locations, and building interactive map UIs with Leaflet
- Building a full-stack data pipeline: ingestion (RSS) → processing (AI) → storage (cloud DB) → presentation (React map)
- Configuring web push notifications with Firebase and service workers
What's Next for SafeBlue
| Feature | Description |
|---|---|
| SMS & Email Alerts | Backend integration so subscribed users automatically receive push alerts via SMS and email |
| Live Polling | Automatic refresh so the map and feed update in real-time without page reloads |
| Mobile App | Native mobile experience with location-based alerts |
| Historical Trends | Analytics to show incident trends over time — helping students and campus security identify patterns |

Log in or sign up for Devpost to join the conversation.