Inspiration
Walkability scores as flat numbers are difficult to understand - what does it mean for a person if the place they live has a walkability score of 4.5 or 5.6? We wanted to create an app that represents walkability in a more tangible way, showing what the experience of walking is really like based on user preferences.
What it does
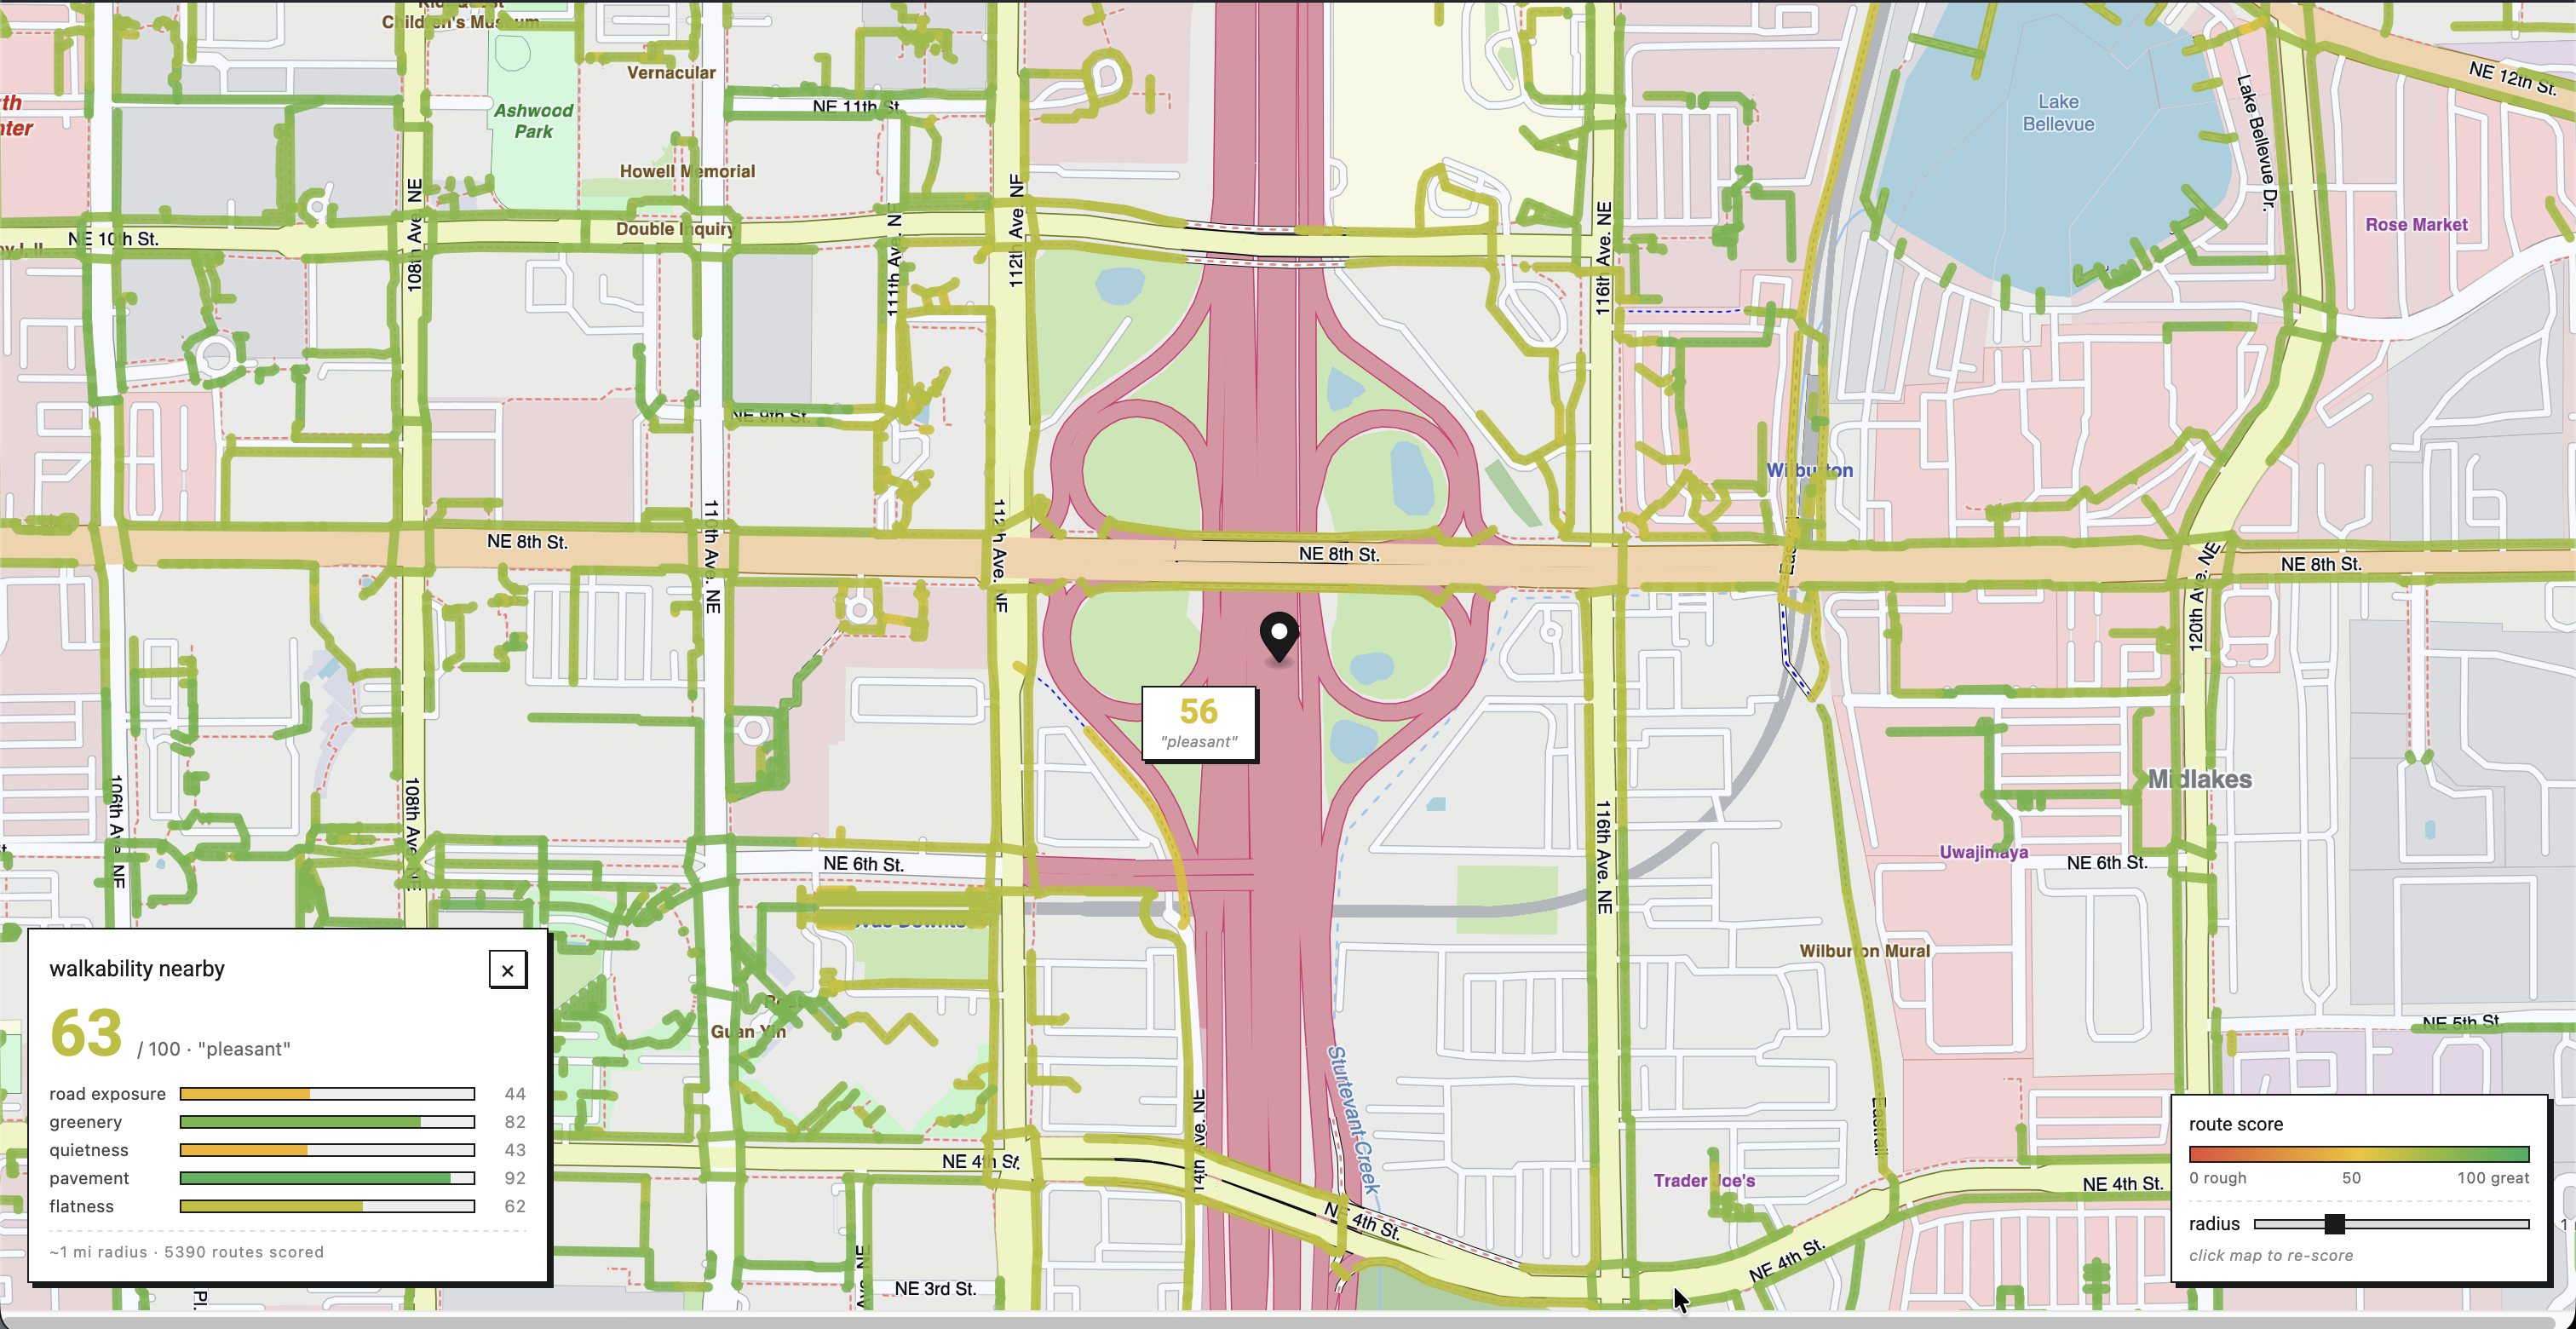
Our app takes real world map data and color-codes potential walking routes from a chosen location based on user selected parameters.
How we built it
We worked with Claude Code to prototype and then refine an interface, using OSM data as a backend. We then added support for a scoring system and a map layer to display that data to the user on a per-route basis.
Challenges we ran into
As we were planning for this project, we had many project ideas but due to the time constraints we had to ask ourselves how much time we had to execute the ideas. We came up with many ideas to equip the map for better user experience, but we realized that a lot of them would be better for a long-term project. We struggled figuring out how to split up the work among team members with varying experience
Accomplishments that we're proud of
We’re proud of how we problem-solved various aspects of the project such as the architecture of the app.
What we learned
We significantly developed our skills in prototyping and planning an app. We learned how to use LLMs and AIs to get significant work done
What's next for Safe Travels
We would like to add more features to it such as storing a user’s favorite route, pedestrian infrastructure, and more to improve the user experience and the experience of people taking walks.


Log in or sign up for Devpost to join the conversation.