-
-
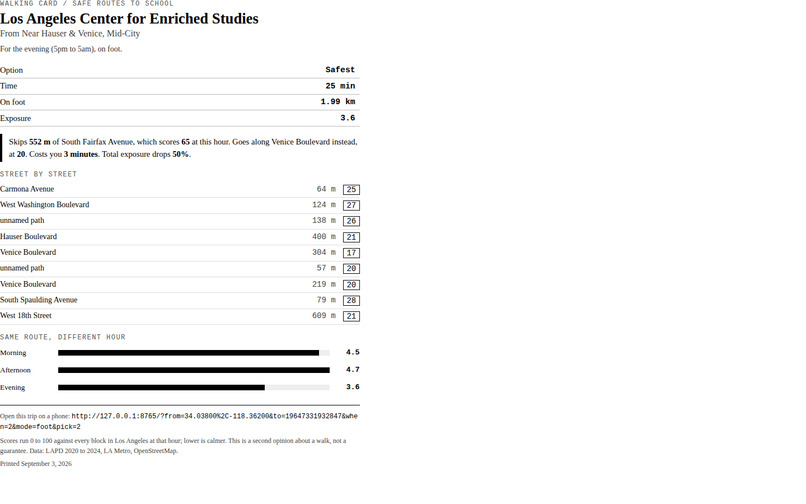
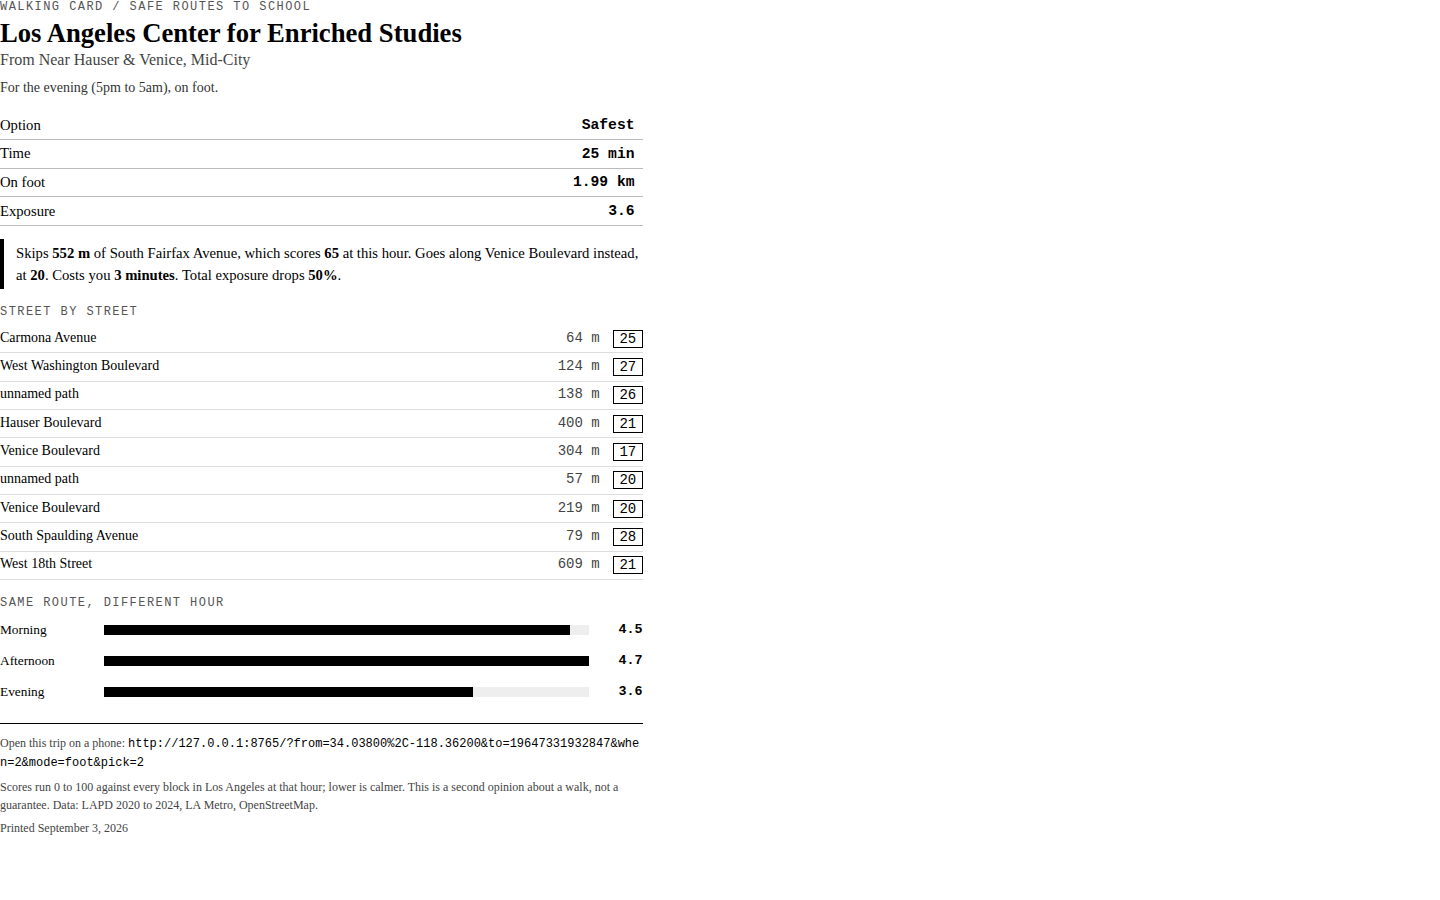
A printable walking card for a student without a phone.
-
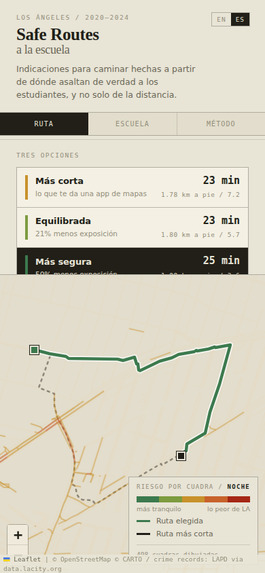
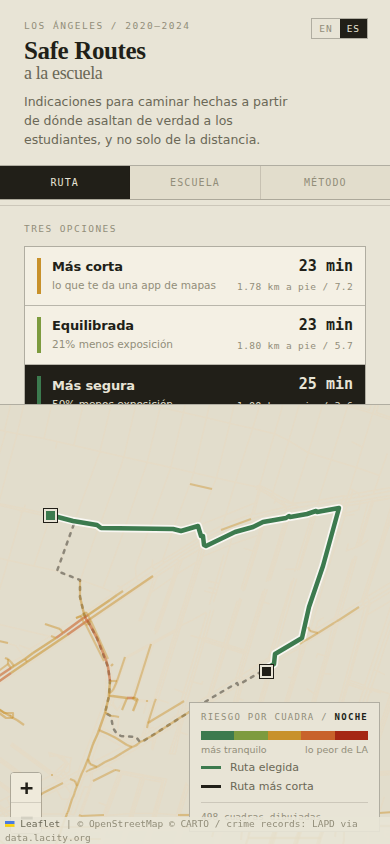
On a phone, installed to the home screen and working offline.
-
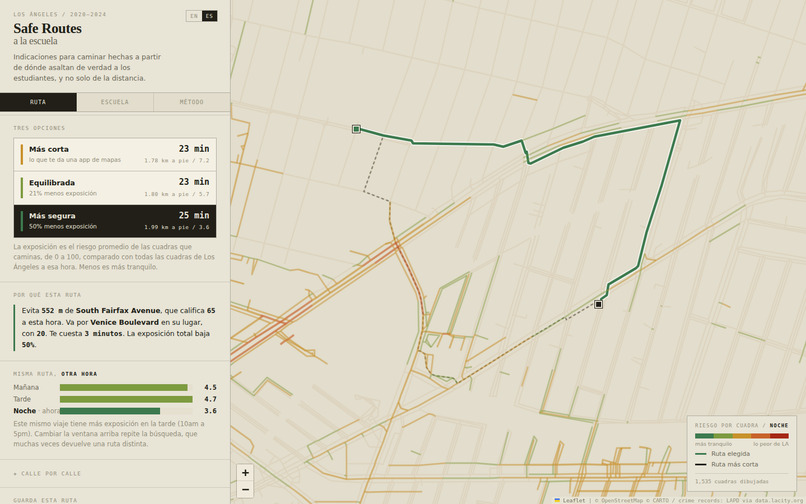
Safe Routes LA: three routes to school, each with the tradeoff spelled out.
-
One tap to Spanish, for families who speak it at home.
-
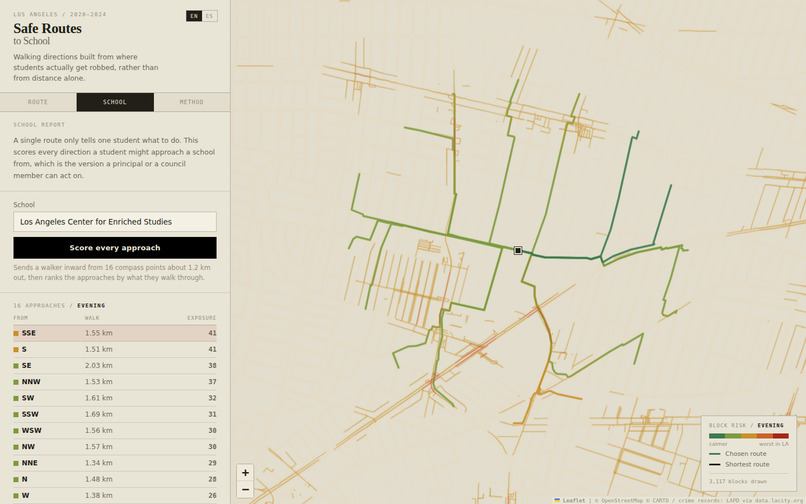
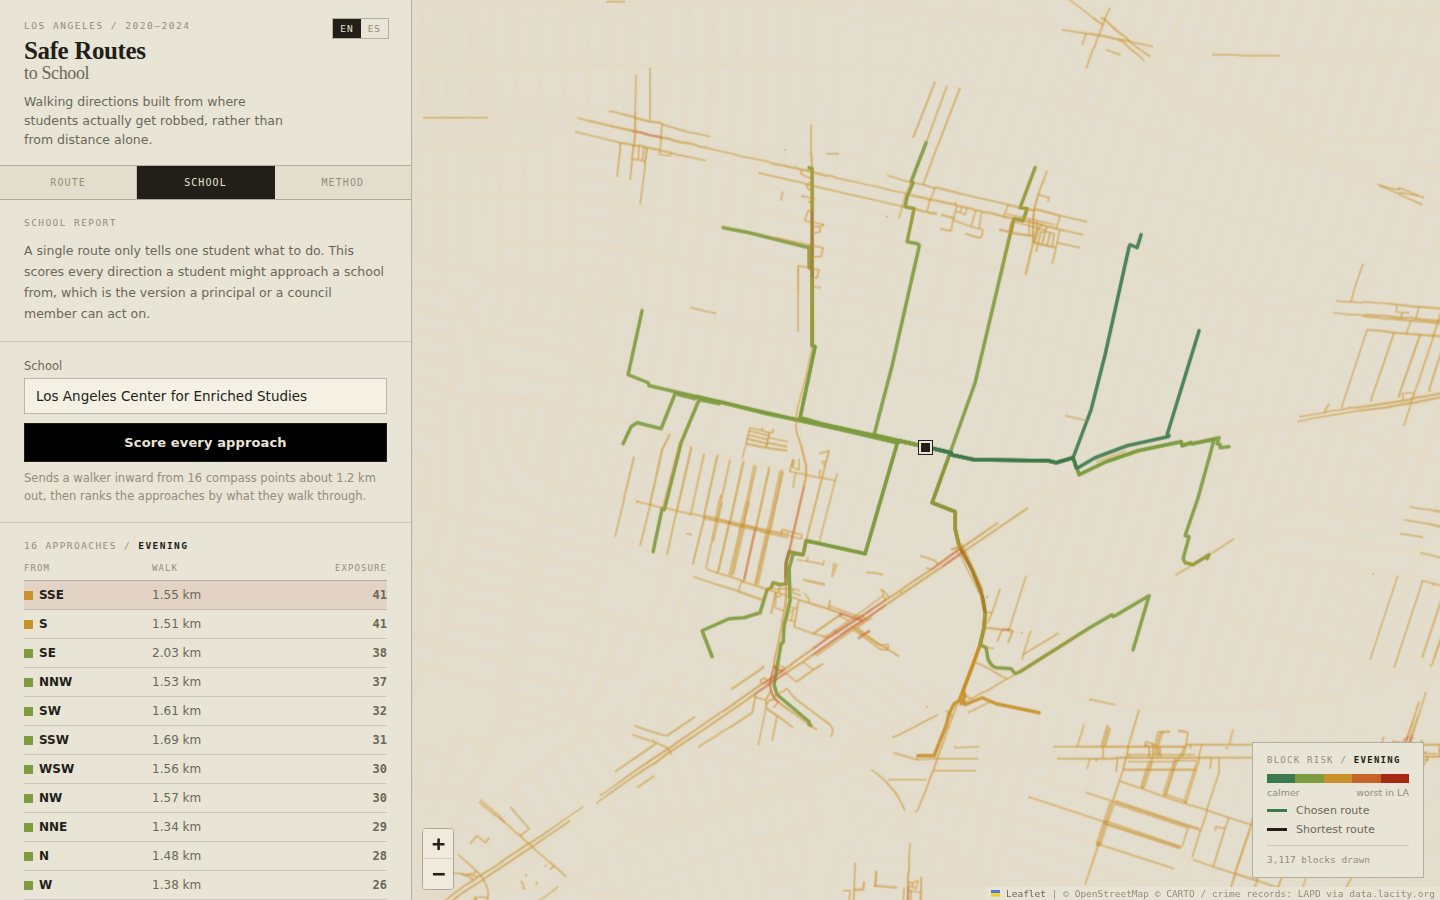
School report: exposure from all sixteen directions into a school.
-
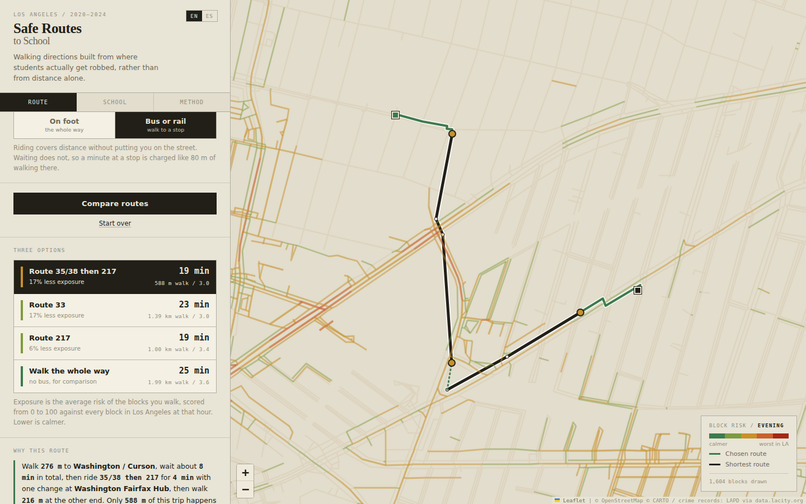
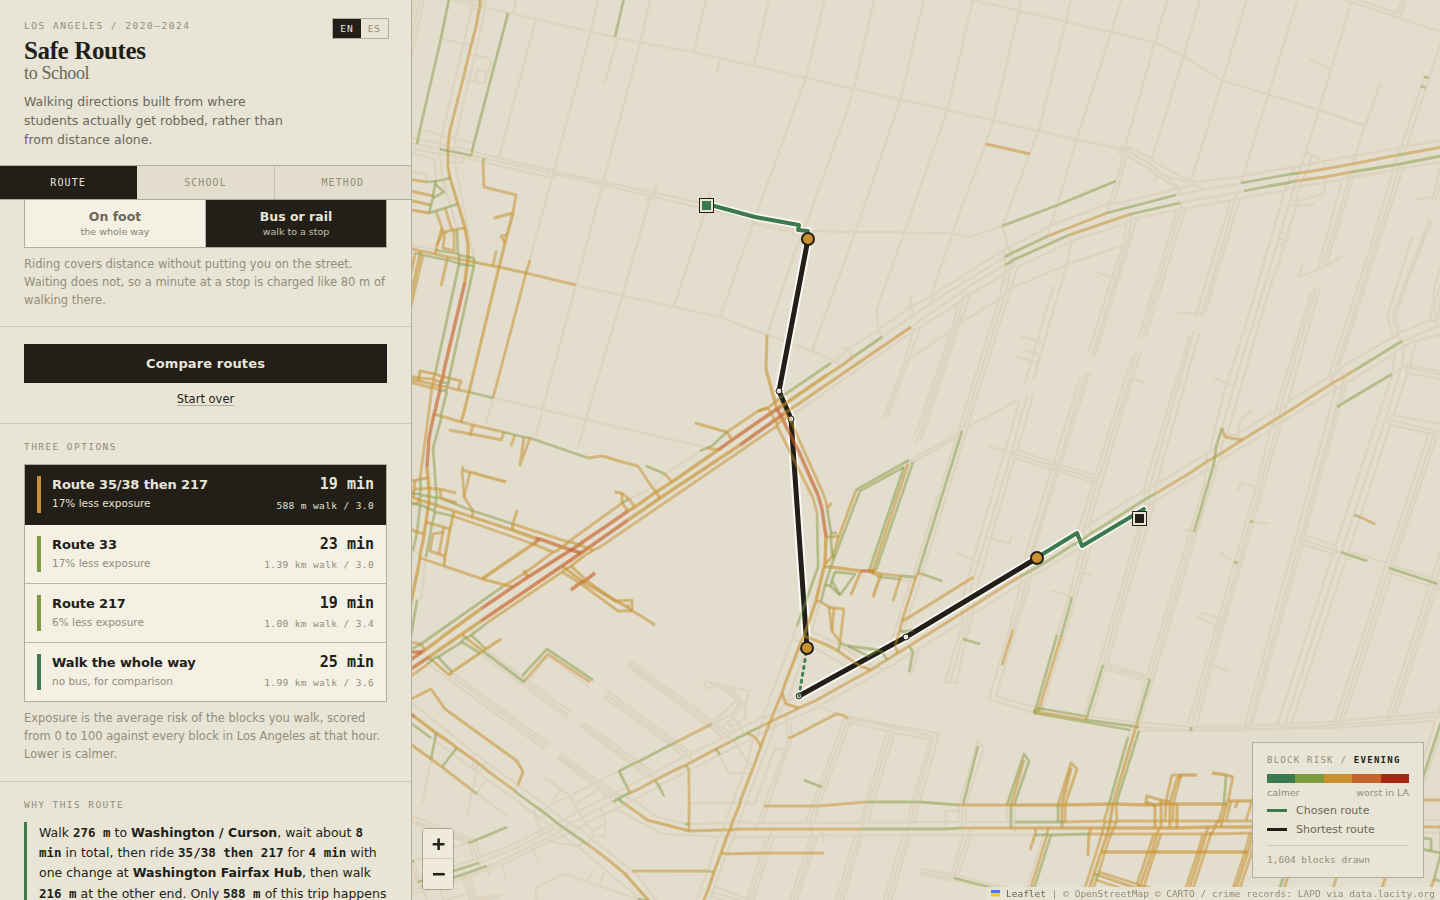
Bus and rail: minutes on board are minutes off the street.
Inspiration
Between 2020 and 2024, 1,838 children aged 10 to 18 were robbed on the streets of Los Angeles. 1,026 of those robberies happened during school commute hours: 56% of them packed into about five hours of the day.
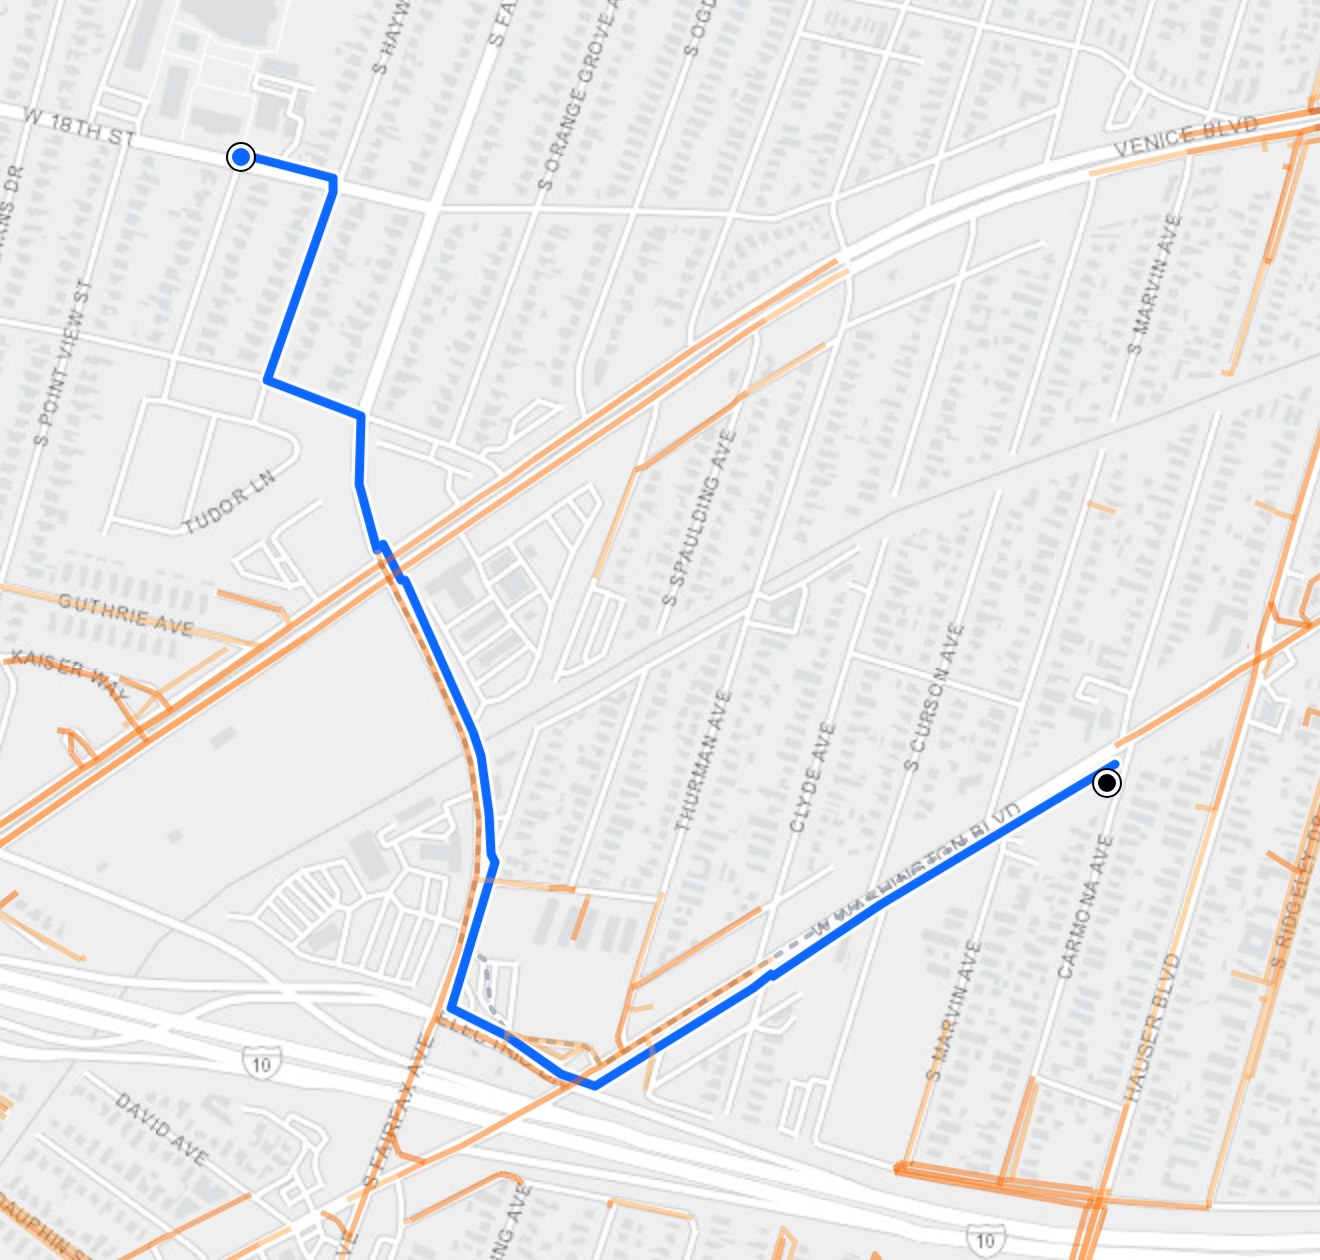
Those robberies repeat in specific places, and every one of those places is already in the city's open data. No map app routes around them. The federal Safe Routes to School program deals almost entirely with cars (crosswalks, speed bumps, crossing guards). Ask an LA student what worries them on the walk home and traffic is rarely the answer. We built for the thing they do name.
What it does
Pick a school, type where you start, and Safe Routes LA offers three walking routes:
- Shortest: what a map app hands you.
- Balanced: the most calm per extra step.
- Safest: the lowest exposure the model can find.
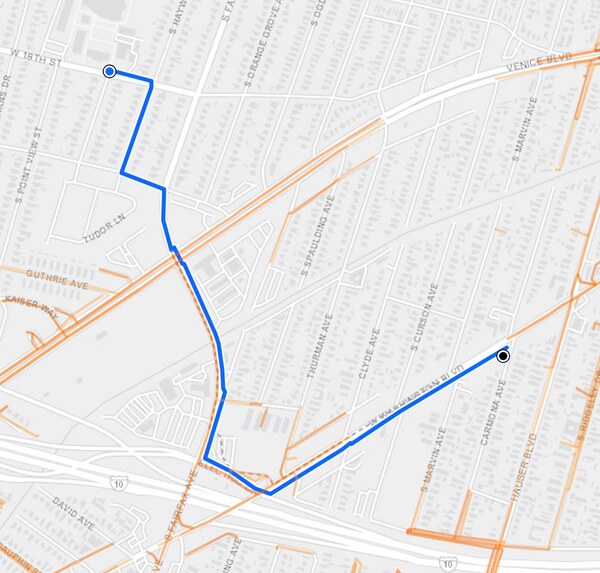
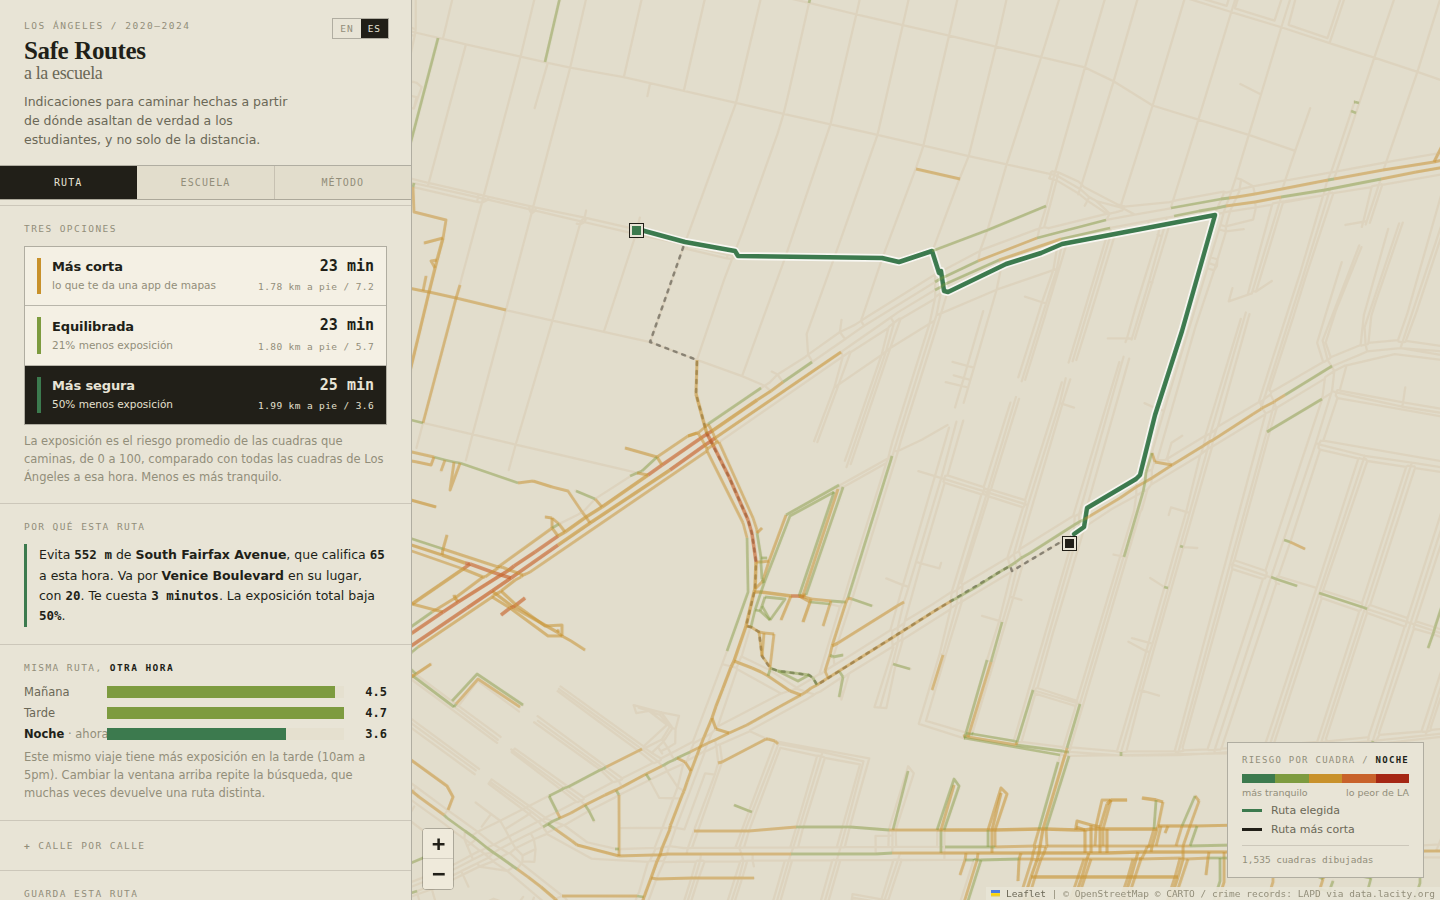
Then it explains the tradeoff in one line. A real result, walking to LACES in Mid City after dark:
Skips 552 m of South Fairfax Avenue, which scores 65 at this hour. Goes along Venice Boulevard instead, at 20. Costs you 3 minutes. Total exposure drops 50%.
It also:
- Plans bus and rail trips, with at most one change. Minutes on board are minutes off the street. From Exposition & Normandie to LACES in the evening, walking takes 118 minutes and 9.34 km on foot; Route 206 changing to Route 33 takes 40 minutes with 726 m on foot and 80% less modeled exposure on that one trip. Waiting at a stop is counted as exposure, because a bad corner is not a safe place to stand for eight minutes.
- Speaks Spanish with one tap, because most LAUSD families speak Spanish at home and a safety tool a parent can't read isn't a safety tool.
- Prints a one-page walking card for a student without a phone.
- Works offline after the first visit and installs to a home screen, so no data plan is needed. Cross streets and map clicks work offline; map tiles and full-address search need a connection.
- Scores a whole school. The school report scores all sixteen directions a student might approach from. For LACES in the evening, walking in from the south-southeast means 2.5 times the exposure of walking in from the east-northeast. That's something a principal or council member can act on.
- Lets people correct it. Every route links to a pre-filled report for the student or parent who knows a block better than the data does.
A safer outcome
Six random evening trips, safest route vs. shortest: exposure dropped on all six, by 19% to 59%, for 1% to 21% more walking. The LACES trip above trades 3 minutes for half the exposure.
How we built it
| Source | What we use | Records |
|---|---|---|
| LAPD crime data, 2020 to 2024 | Violent incidents in public pedestrian space | 85,634 |
| LA Bureau of Street Lighting | Streetlight locations | 128,534 |
| California Department of Education | Public schools | 668 in area |
| OpenStreetMap | Walkable street network | 431,599 blocks |
| LA Metro GTFS (bus and rail) | Stops, ride times, headways | 5,395 stops |
- Filtering mattered most. We keep only offences that threaten someone walking down a street (robbery, assault, threats, brandishing a weapon), and only ones in public space. That drops about 81,000 indoor records. Counting domestic violence would have marked ordinary residential blocks as dangerous to walk through, which is wrong in a way that does real damage.
- Scoring a block. Each incident is weighted by severity, recency (2.5-year half-life) and whether the victim was a child (triple weight), then spread with a 120 m Gaussian kernel to match how coarsely LAPD records locations. Streetlights take up to 35% off a block's score. The build script now scales that by how dark each time window is, but the graph the site serves was built before that change and still gives the same credit at every hour.
- Rates, not counts. Per hour, the afternoon walk home (10am to 5pm) is the worst window of a student's day, worse than after dark. We weren't looking for that.
- Routing. A* over every block, minimizing length x (1 + lambda x risk^1.5). The three options are the same search at different lambdas. The heuristic is admissible, so each route is provably the cheapest under this cost, and a Python check confirms A* matches Dijkstra exactly.
- In the browser. 431,599 blocks pack into typed arrays: 5.2 MB gzipped, usable the moment it lands. No server.
Trust and responsible design
- No accounts, no tracking, no server. Everything runs on the device.
- It never says a street is "safe." It says how much calmer one route is than another, and by how much time.
- Our README states plainly what hasn't been tested yet (below), and CI fails if our evaluation ever stops reporting a null result on random data.
Limitation
The routes are provably optimal under our own risk score, but we haven't yet shown that the score predicts where crime happens next. A holdout test (fit on 2020 to 2023, check against 2024) is written and checked against synthetic fixtures, but we haven't run it on real LA data yet. The route also turns on seven constants chosen by judgment; the kernel bandwidth alone can move more than half of a route.
Earlier work and what's new
- August 2026: the first version, which placed third in Young Coders' Sphere's Code for Transportation challenge.
- September 2026: Spanish, printable walking cards, school pages and embeds, cross-street lookup, offline mode, bus and rail routing, and the validation work.
- October and November 2026: a new light interface and logo, link previews that show the real map, and a CI fix.
- November 12, 2026: a testing pass. Bus trips with a change are scored the same on every card, every control works from the keyboard, the route sits above the phone sheet, "now" uses Los Angeles time, shared links reopen the same card and hour, and the street graph starts downloading as the page opens.
Team and credits
Adrian Erlikhman and Michael Tarekegn, with Ryan Erlikhman on the original team. We used Claude Code as a coding assistant and reviewed its work. Data from LAPD, the LA Bureau of Street Lighting, the California Department of Education, OpenStreetMap contributors and LA Metro. Map by Leaflet.
Try it
Built With
- github
- gtfs
- javascript
- leaflet.js
- openstreetmap
- python
- service-worker
