-
-
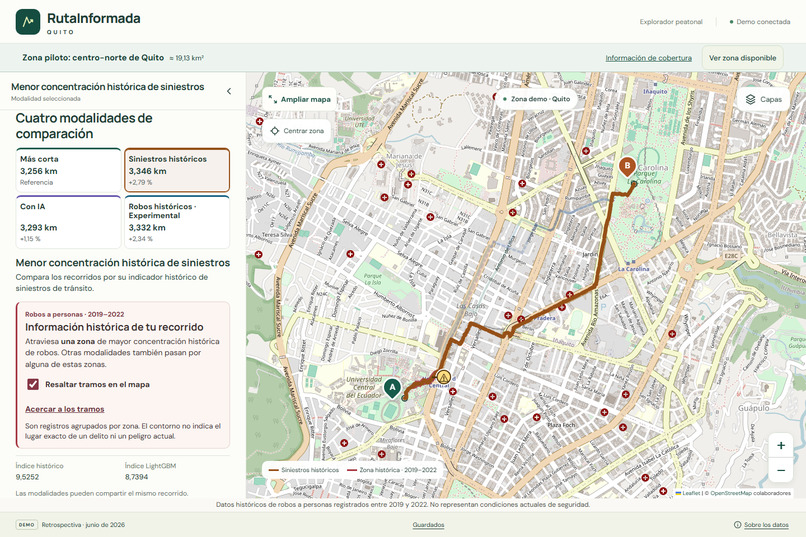
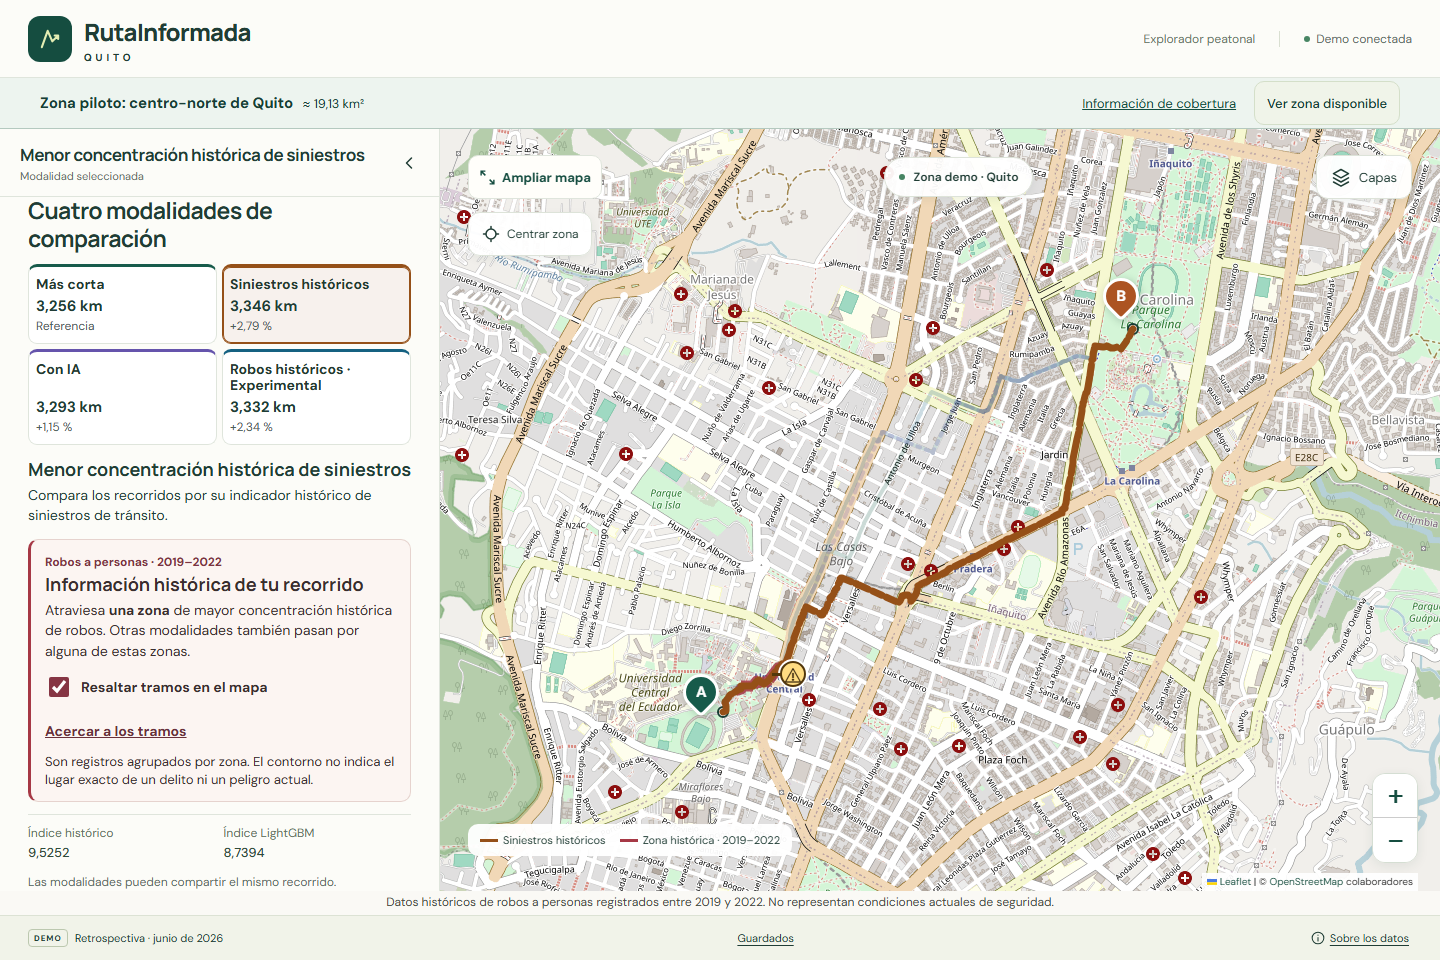
Compare four walking routes based on distance, historical traffic incidents, AI estimates, and robbery records.
-
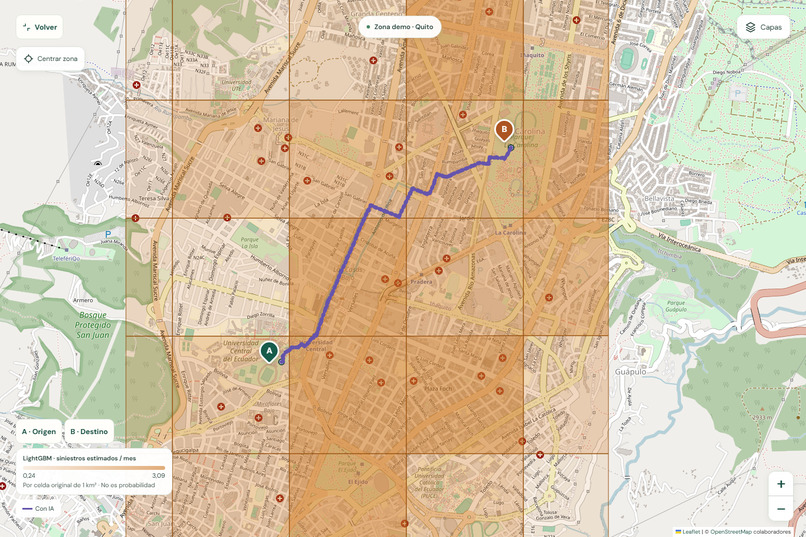
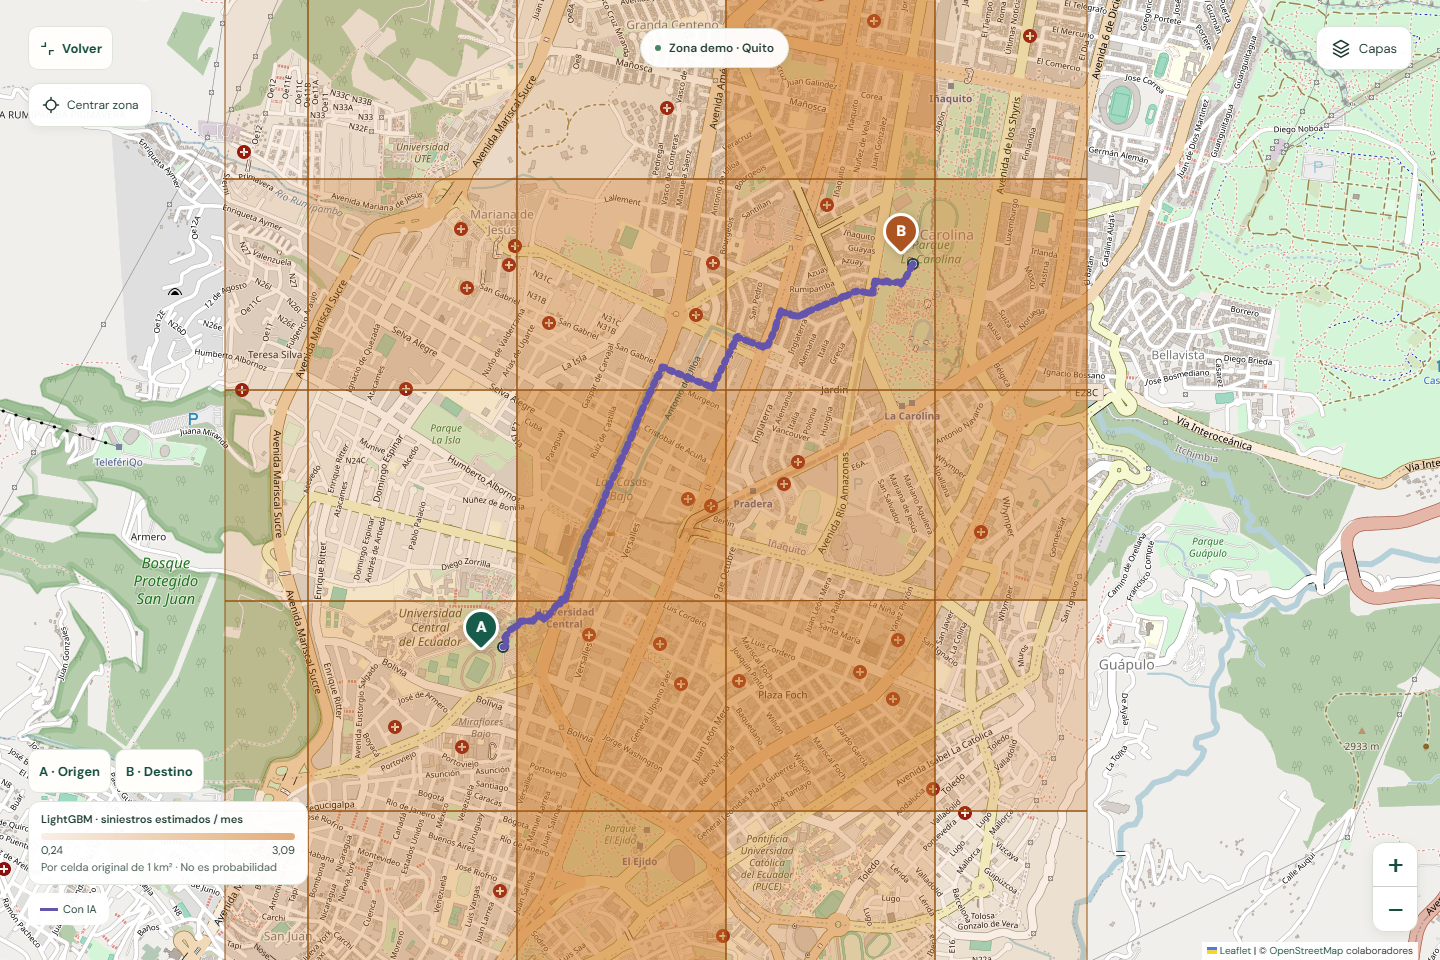
LightGBM estimates monthly traffic incident counts across geographic cells using historical data.
-
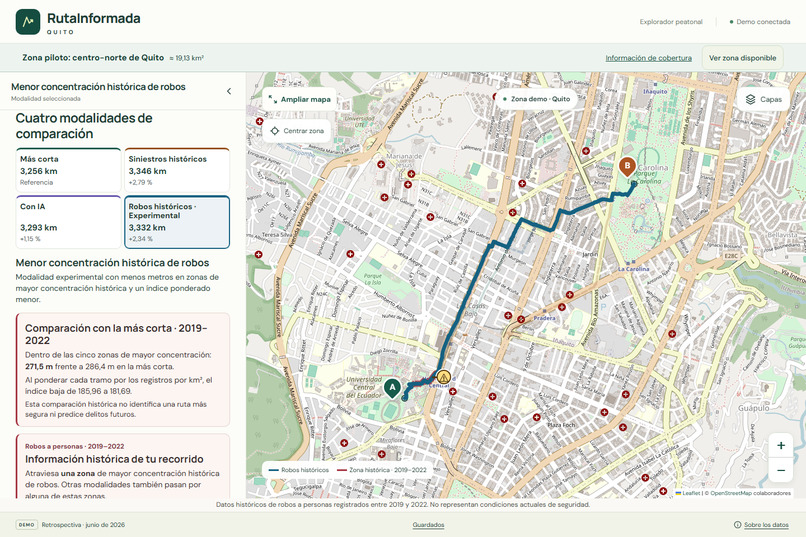
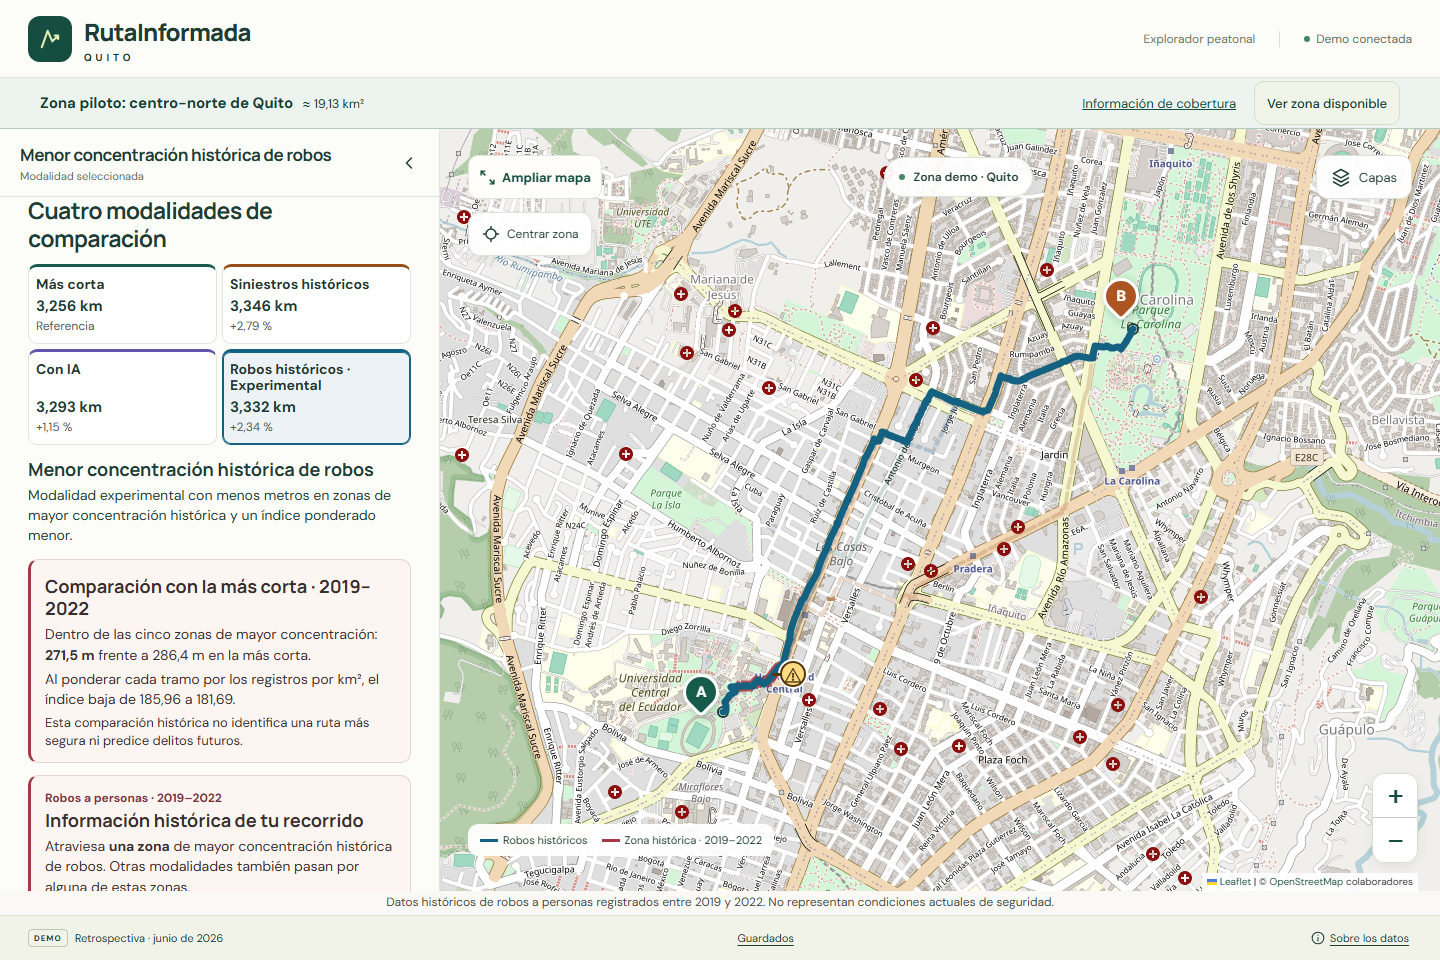
Experimental route comparison using historical robbery concentrations recorded between 2019 and 2022.
-
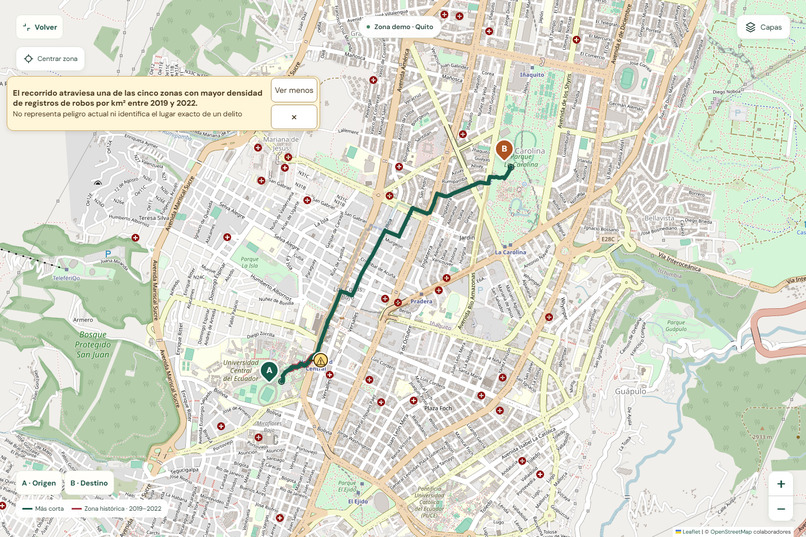
Historical warning markers highlight route segments crossing areas with higher recorded robbery concentrations.
-
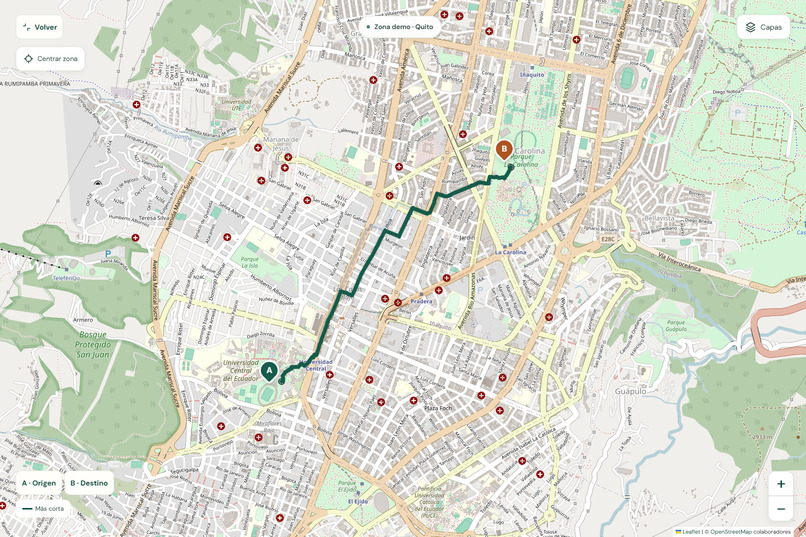
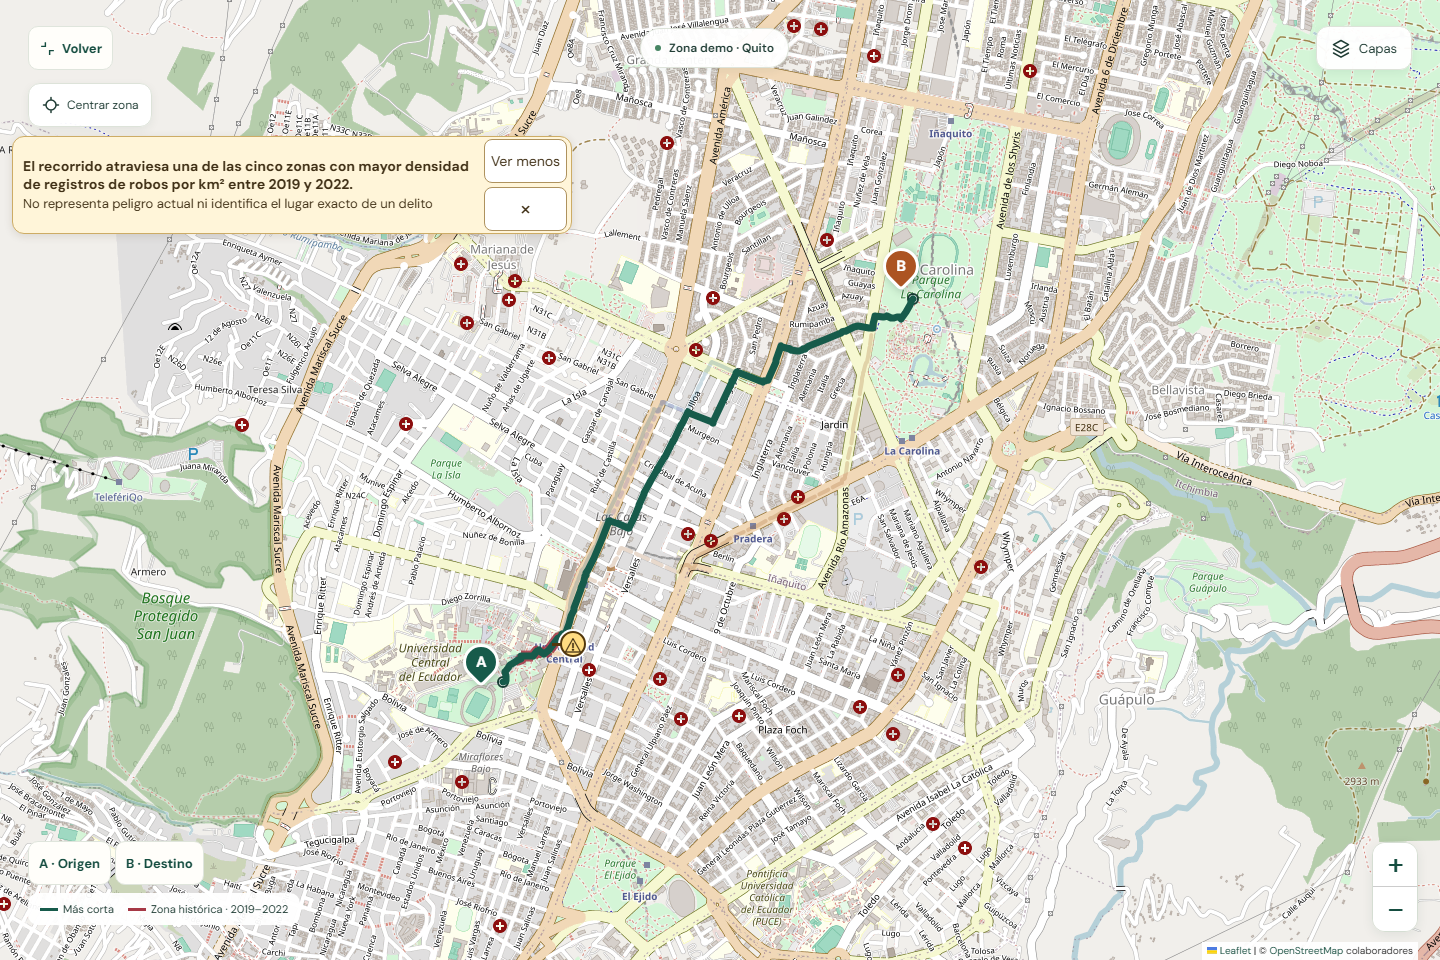
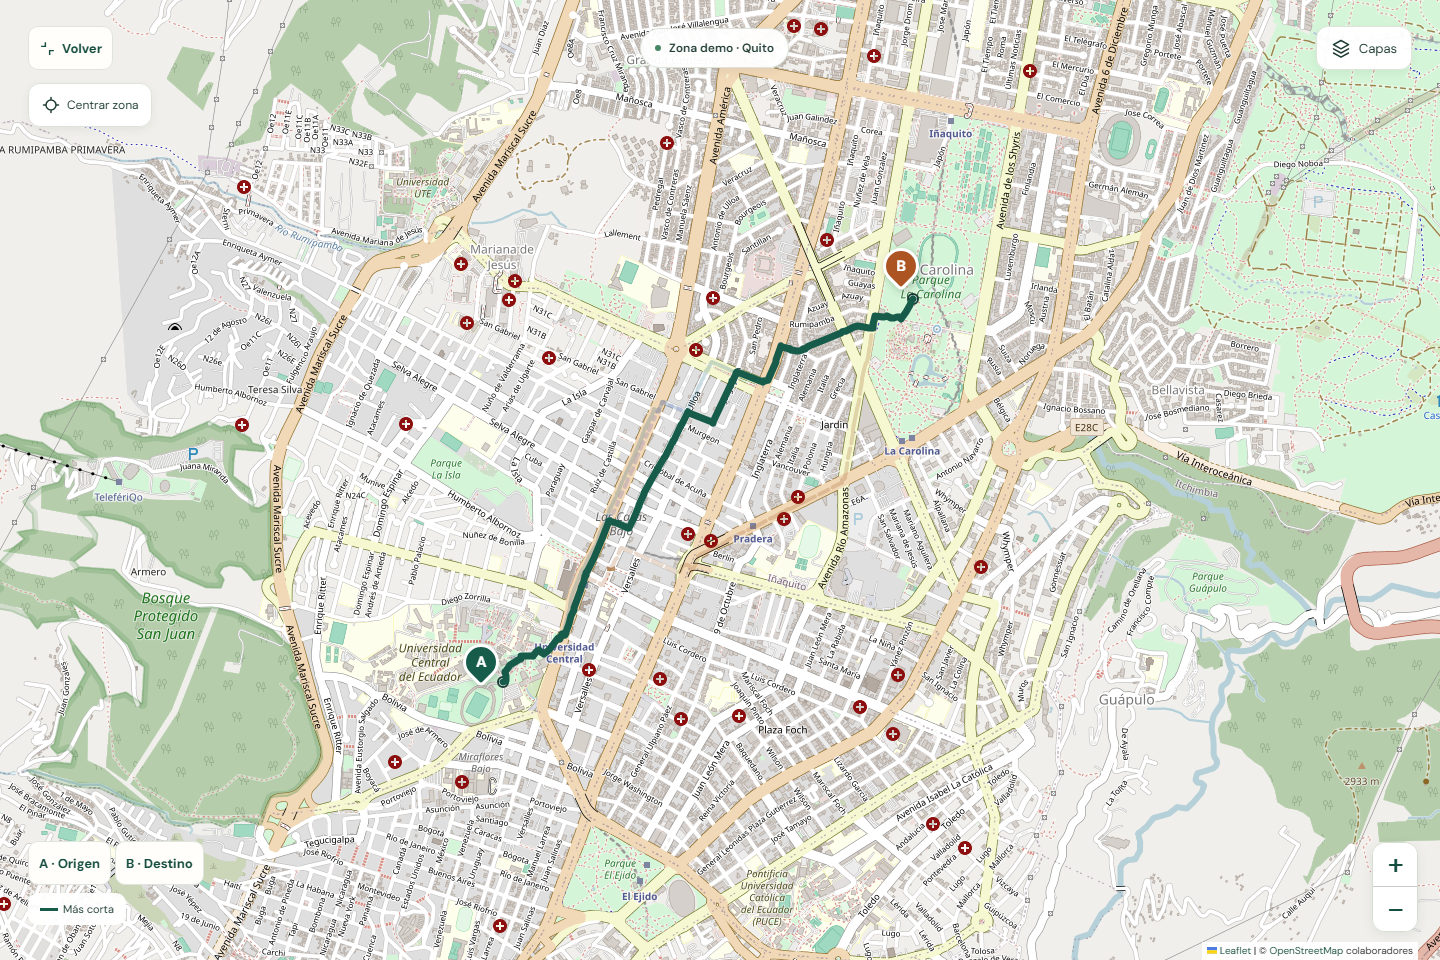
Expanded interactive map showing walking routes, geographic data layers, and origin and destination markers.
-
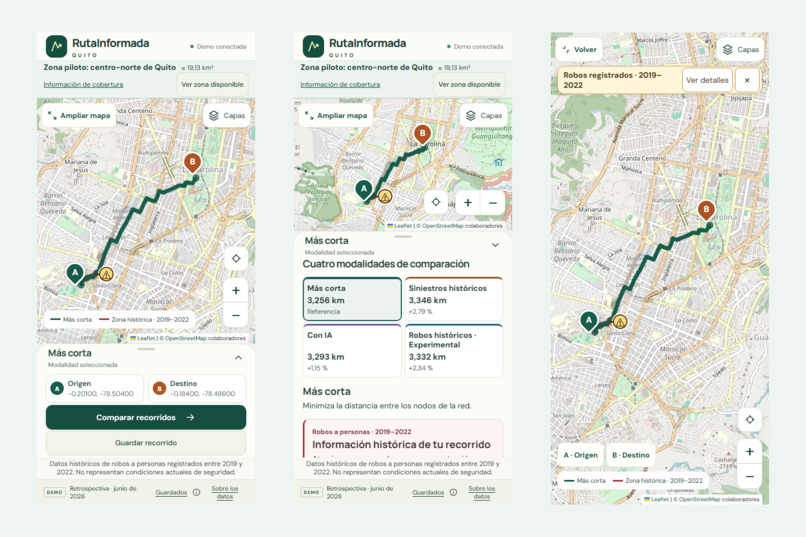
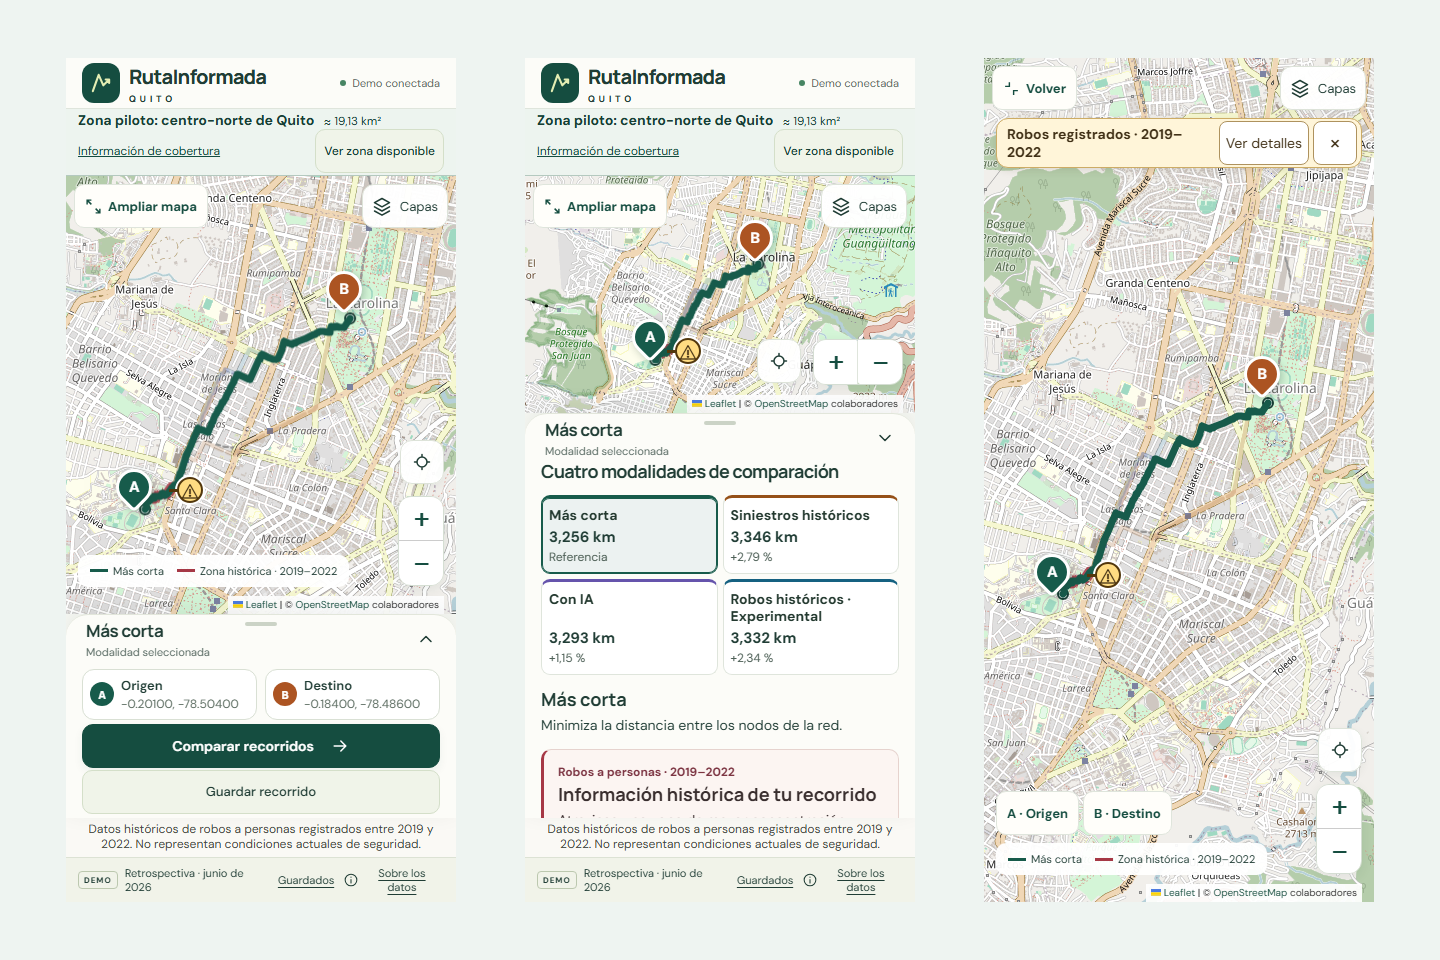
Mobile-friendly interface with four route comparison modes and historical warning markers.
-
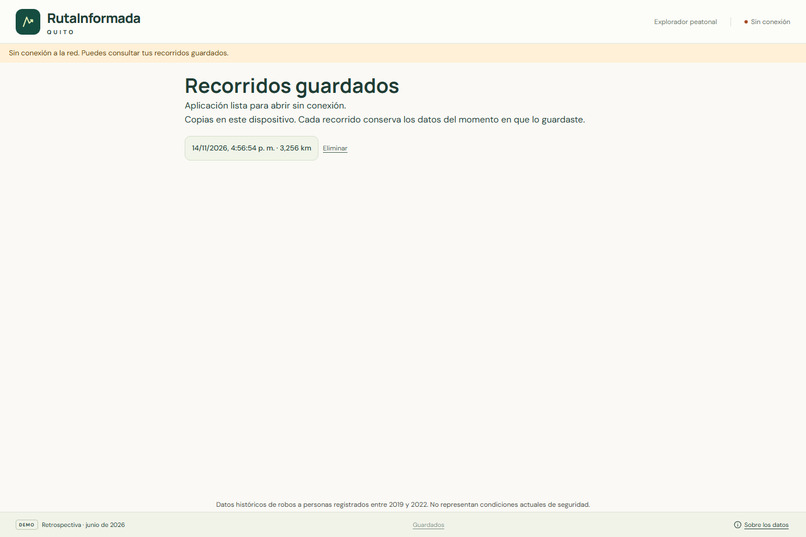
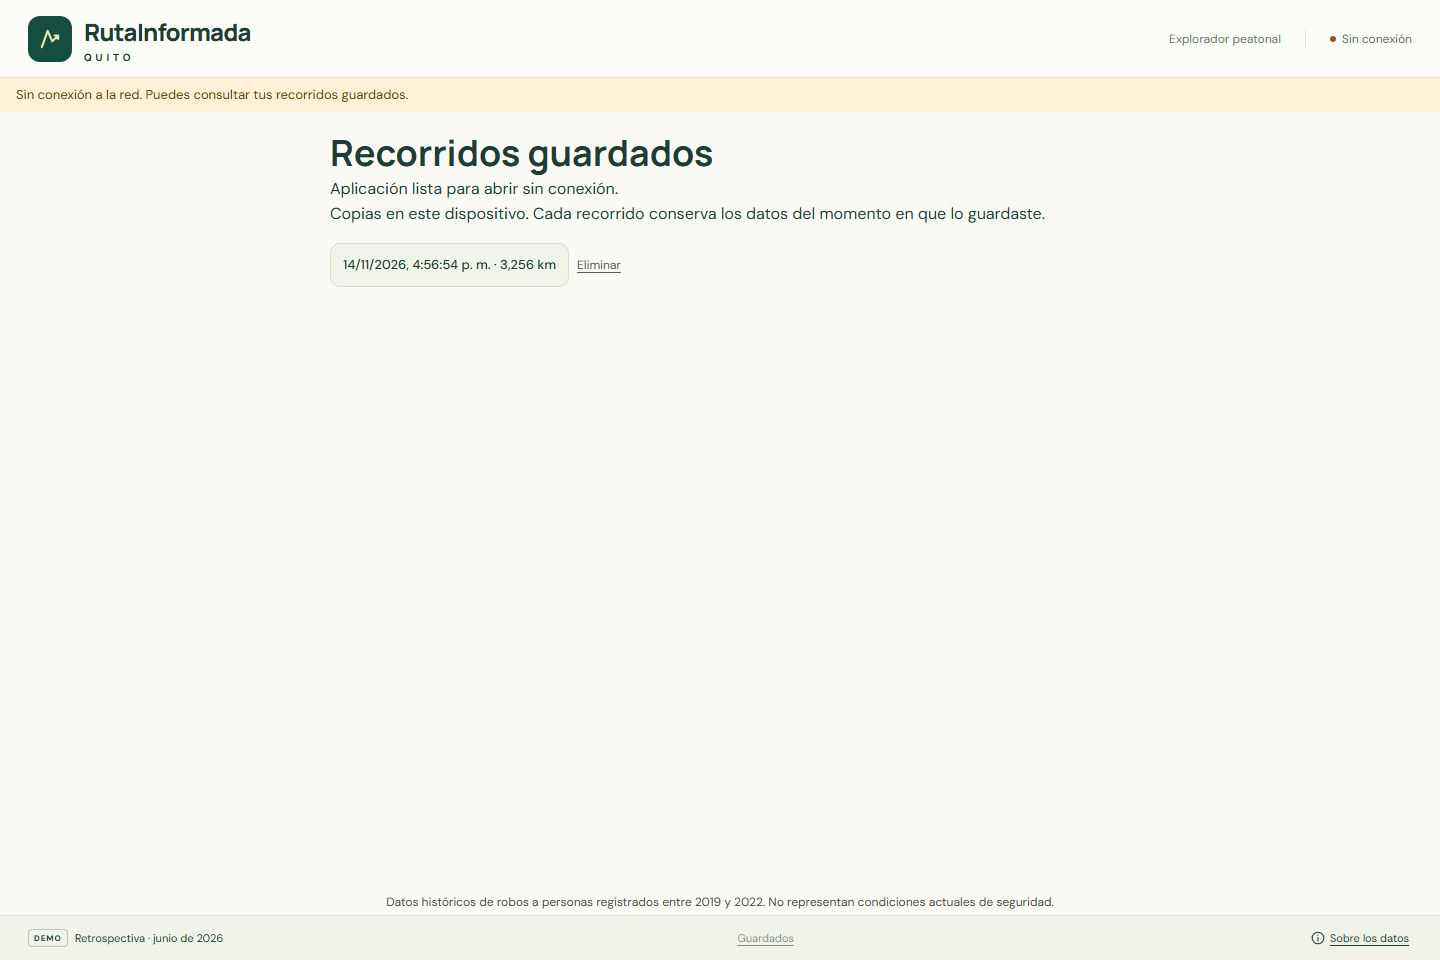
Saved routes library allows users to reopen previously stored routes on their device.
-
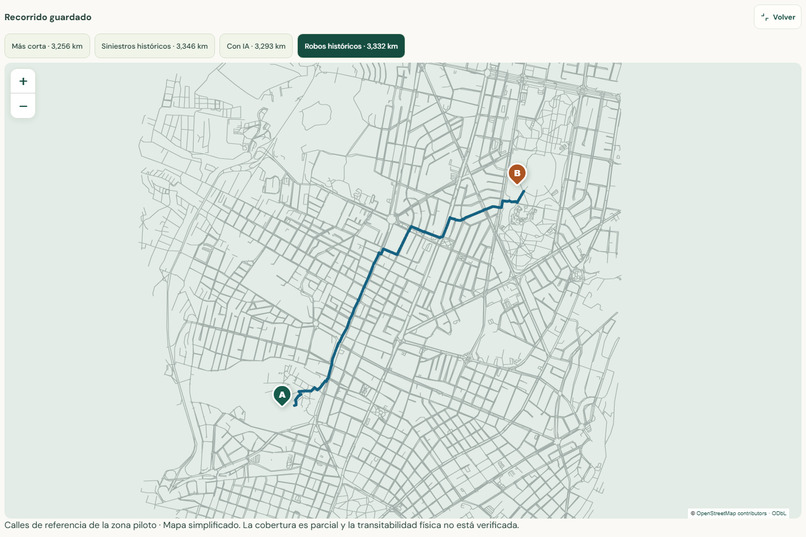
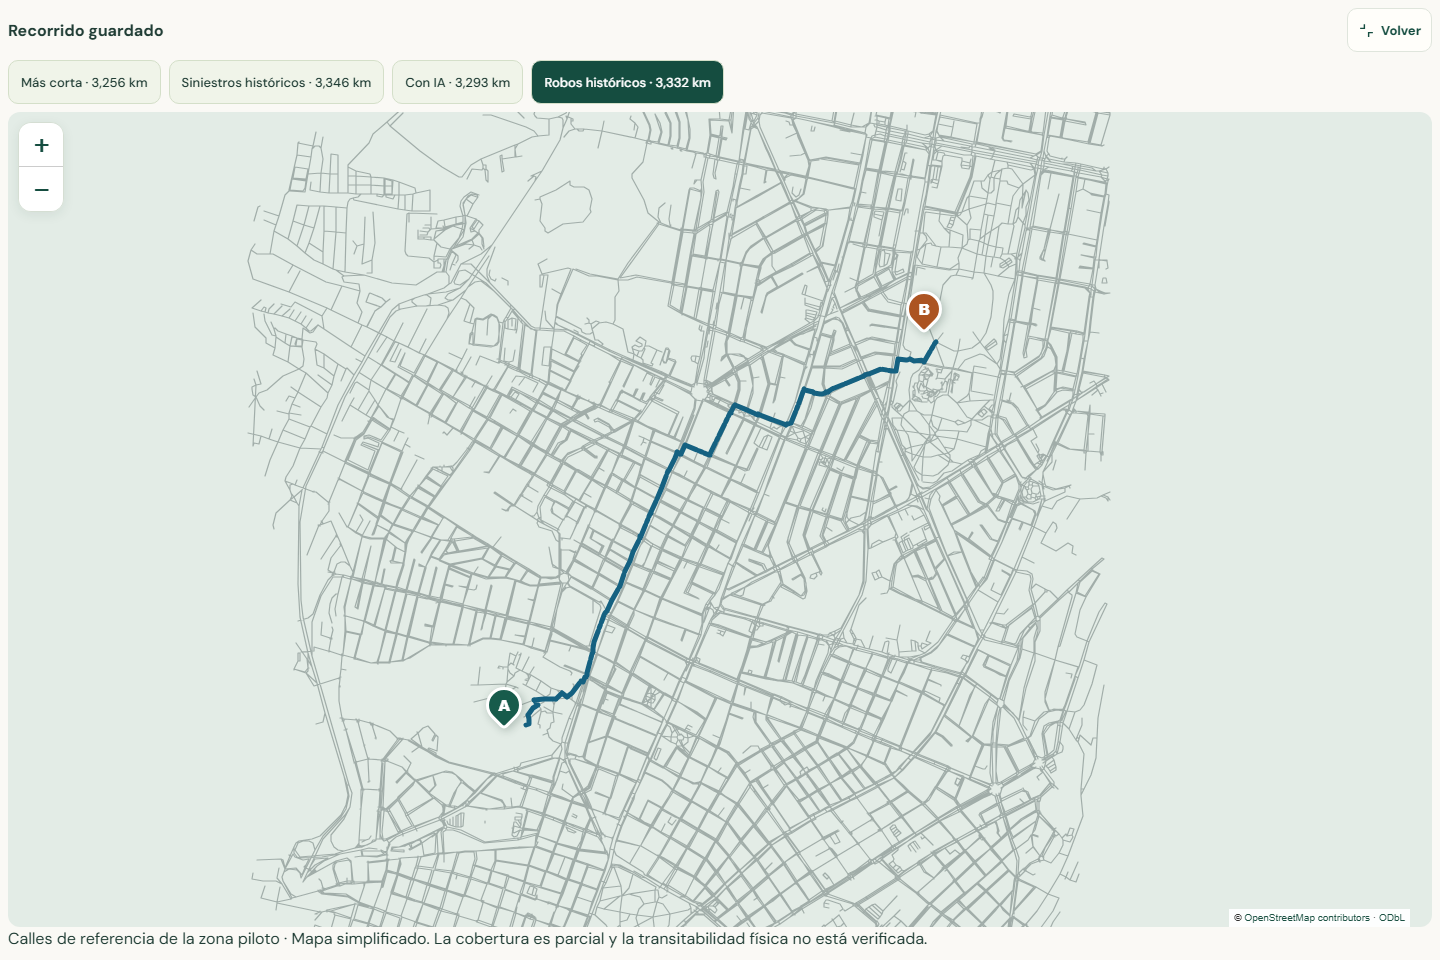
Offline access to four saved route alternatives and a simplified local street map without an internet connection.
Inspiration
When walking through a city, the shortest route is not always the only option worth considering. Most navigation applications focus on distance and travel time, but they do not always provide information about historical road incidents or other factors that pedestrians might want to consider.
For STEMergent Hacks 2026, our team wanted to explore how technology, geographic data, and artificial intelligence could help people make more informed decisions when planning their walking routes.
We chose Quito, Ecuador, because we wanted to work on a problem related to our community. This led us to develop RutaInformada Quito, a functional web application focused on a pilot area in the north-central part of the city.
Our goal was not to replace traditional navigation applications, but to offer an additional way to compare walking routes using historical information and machine learning.
What it does
RutaInformada Quito is a web application that allows users to select an origin and destination on an interactive map and compare different walking routes.
The application supports four route comparison modes:
- Shortest route: Finds the shortest walking route between the selected points.
- Historical road incidents: Compares alternative routes using the historical concentration of recorded traffic incidents.
- AI-based estimation: Uses estimates generated by our LightGBM machine learning model to compare routes according to estimated traffic incident counts.
- Historical robberies (Experimental): Uses robbery records from 2019 to 2022 to explore alternative routes that reduce the distance traveled through areas with higher historical concentrations of recorded robberies. This mode requires an additional local dataset and may not produce a different route for every origin and destination.
The application also displays historical warning markers when a selected route crosses highlighted areas associated with robbery records. Users can open these warnings to read more information about the historical data. The warnings work independently of the selected route comparison mode.
Users can expand the map, compare route distances, explore information layers, and save their routes for later use.
We also implemented offline functionality. Previously saved routes can be reopened without an internet connection, using locally stored street geometry and route information.
The current prototype covers approximately 19.13 km² of north-central Quito, including areas around the Universidad Central del Ecuador and La Carolina.
The application uses historical records and retrospective estimates. It does not provide real-time crime predictions, calculate individual risk, or guarantee that a route is safe.
How we built it
We developed the frontend using React, TypeScript, and Leaflet to create an interactive map that works on desktop and mobile devices.
For the backend, we used Python and FastAPI. We worked with OpenStreetMap, OSMnx, and NetworkX to prepare the pedestrian street network and calculate walking routes between selected points.
For our machine learning model, we used georeferenced traffic incident records from Quito provided through REDSA GeoJSON datasets derived from Ecuador's National Transit Agency (ANT).
We used historical data from 2024 and 2025 for model development and records from January to June 2026 for retrospective evaluation. After filtering the study area and checking the quality of the data, we organized the traffic incidents into 99 geographic cells of approximately 1 km².
We then created temporal and spatial features based on previous incident counts, time periods, and neighboring areas. Using these features, we trained a LightGBM model with a Poisson objective to estimate monthly traffic incident counts.
We compared its performance with a historical baseline. Although LightGBM performed slightly better at identifying cells with higher concentrations according to our top-20% metric, the baseline achieved lower overall prediction errors. This helped us understand the limitations of our model.
For the experimental historical robbery mode, we used publicly accessible records from the ArcGIS Robo_personas_view service, covering 2019 to 2022. We processed the information into aggregated geographic cells to compare historical concentrations along different routes.
The LightGBM model was trained using traffic incident data, not robbery records. These two sources are used for different purposes in the application.
All four route comparison modes can now be reproduced from a clean GitHub clone on Windows by following the documented setup process. The experimental historical robbery mode uses an aggregated GeoJSON dataset generated locally from the publicly accessible ArcGIS service. Our repository includes the generation script, data validation checks, and step-by-step instructions to reproduce this functionality.
The derived robbery GeoJSON is not redistributed in the repository because the rights associated with the original records have not been fully established. Reproducing this experimental feature depends on access to the external data source and its applicable terms.
To support offline use, we implemented Progressive Web App (PWA) functionality, allowing users to reopen saved routes and access simplified local street geometry without connecting to the server.
We also developed automated tests for the backend and frontend, including route calculations, API responses, interface behavior, and offline functionality. We tested different screen sizes and reviewed the application on an iPhone.
During development, we used AI-assisted tools, including ChatGPT and Codex, to support research, coding, debugging, documentation, and testing. Our team reviewed the generated code, integrated the components, checked the results, and tested the final prototype.
The main technologies used were Python, FastAPI, React, TypeScript, Leaflet, OSMnx, NetworkX, LightGBM, and OpenStreetMap.
Historical robbery data source: https://services1.arcgis.com/UOl0yzPDLol8nS3m/ArcGIS/rest/services/Robo_personas_view/FeatureServer/0
Challenges we ran into
One of our biggest challenges was working with real geographic data. Different datasets had different periods, coverage, and quality issues, so we had to be careful about how we processed and presented the information.
For example, some traffic incident records from December 2024 had inconsistent geographic coordinates. We decided to treat that period as missing spatial information instead of incorrectly counting it as zero incidents.
Another challenge was connecting the machine learning results to the pedestrian street network. We needed to ensure that route comparisons used the correct geographic information while keeping alternative routes within the established distance limit of 15% compared with the shortest route.
Working with historical robbery records was also challenging. We had to distinguish between areas with higher historical concentrations and current safety conditions. We added explanations and warning messages to avoid giving users a misleading interpretation of the data.
We also spent time adapting the interface to mobile screens, especially the map controls, route comparison cards, and warning markers.
Offline functionality was another challenge because online map tiles are not always available. We addressed this by storing route information and providing simplified local street geometry for saved routes.
Accomplishments that we're proud of
We are proud that we were able to build a working application rather than only presenting an idea.
Our prototype combines pedestrian route calculations, historical data visualization, machine learning, and offline functionality in one application.
We implemented four route comparison modes, including an experimental mode based on historical robbery concentrations. We also developed warning markers that provide additional information when a route crosses a historically highlighted area.
Another important achievement was training our LightGBM model, evaluating it against a historical baseline, and integrating its estimates into the route comparison process.
We developed automated tests for the backend and frontend and checked that the main features worked on different screen sizes.
One of the most satisfying moments was seeing the application calculate routes, display them on the map, and reopen saved routes without an internet connection.
What we learned
This project helped us improve our knowledge of web development, geographic information systems, machine learning, and software testing.
We learned how to prepare geographic datasets, train and evaluate a predictive model, and connect its results to a working web application.
We also learned that training a machine learning model is only one part of the process. It is equally important to evaluate its performance, compare it with simpler approaches, and understand the limitations of the available data.
Another important lesson was that historical data must be presented carefully, especially when it relates to road incidents or crime. A route with a lower historical indicator is not necessarily safer in real life.
Working as a team helped us organize tasks, solve technical problems, and make decisions throughout development.
What's next for RutaInformada Quito
We would like to expand the geographic coverage so users can compare walking routes in more areas of Quito.
We also want to improve the quality and recency of the available data, continue evaluating our machine learning model, and explore ways to make the application more useful and accessible.
As part of our research, we investigated robbery records from 2023 to 2026 around university areas in Quito. However, these records have different geographic coverage and require additional validation before they can be incorporated into route comparisons.
Another priority is improving the documentation and reproducibility of the experimental historical robbery mode, including confirming the conditions for redistributing its supporting dataset.
Our long-term goal is to continue developing RutaInformada Quito as a tool that gives pedestrians additional information when planning their walking routes.
Built With
- css3
- fastapi
- git
- github
- html5
- javascript
- leaflet.js
- lightgbm
- machine-learning
- networkx
- openstreetmap
- osmnx
- playwright
- pwa
- python
- react
- typescript
- vite

