
Inspiration
During Hurricane Ida in 2021, Route 18 went underwater a mile from campus. Students stranded on campus couldn’t tell which roads were safe to walk, while the people trying to help them had no shared picture of what was flooding where.
In a flood, the first thing that breaks isn’t the roads, it’s the flow of information. The tools already exist: river gauges, weather forecasts, road alerts, and emergency systems. But they don’t talk to each other.
RU Afloat brings that scattered information together. By connecting these sources, we can anticipate flooding on the Raritan hours ahead and help coordinators prepare a response before the water rises.
And when conditions worsen, students and coordinators share an up-to-date picture of what’s happening, so students can find a safer route and coordinators can get help where it’s needed.
What it does
RU Afloat connects eight live data sources in one place, helping students find safer routes and coordinators respond to flooding.
- Predict: Our machine-learning model uses river-gauge data to forecast water levels 3, 6, 12, and 18 hours ahead. Weather alerts, radar rainfall, and the National Water Model provide additional context.
- Detect: Gemini checks river-camera images for signs of flooding. ESP32 street sensors measure water depth and automatically mark roads closed at 15 centimeters.
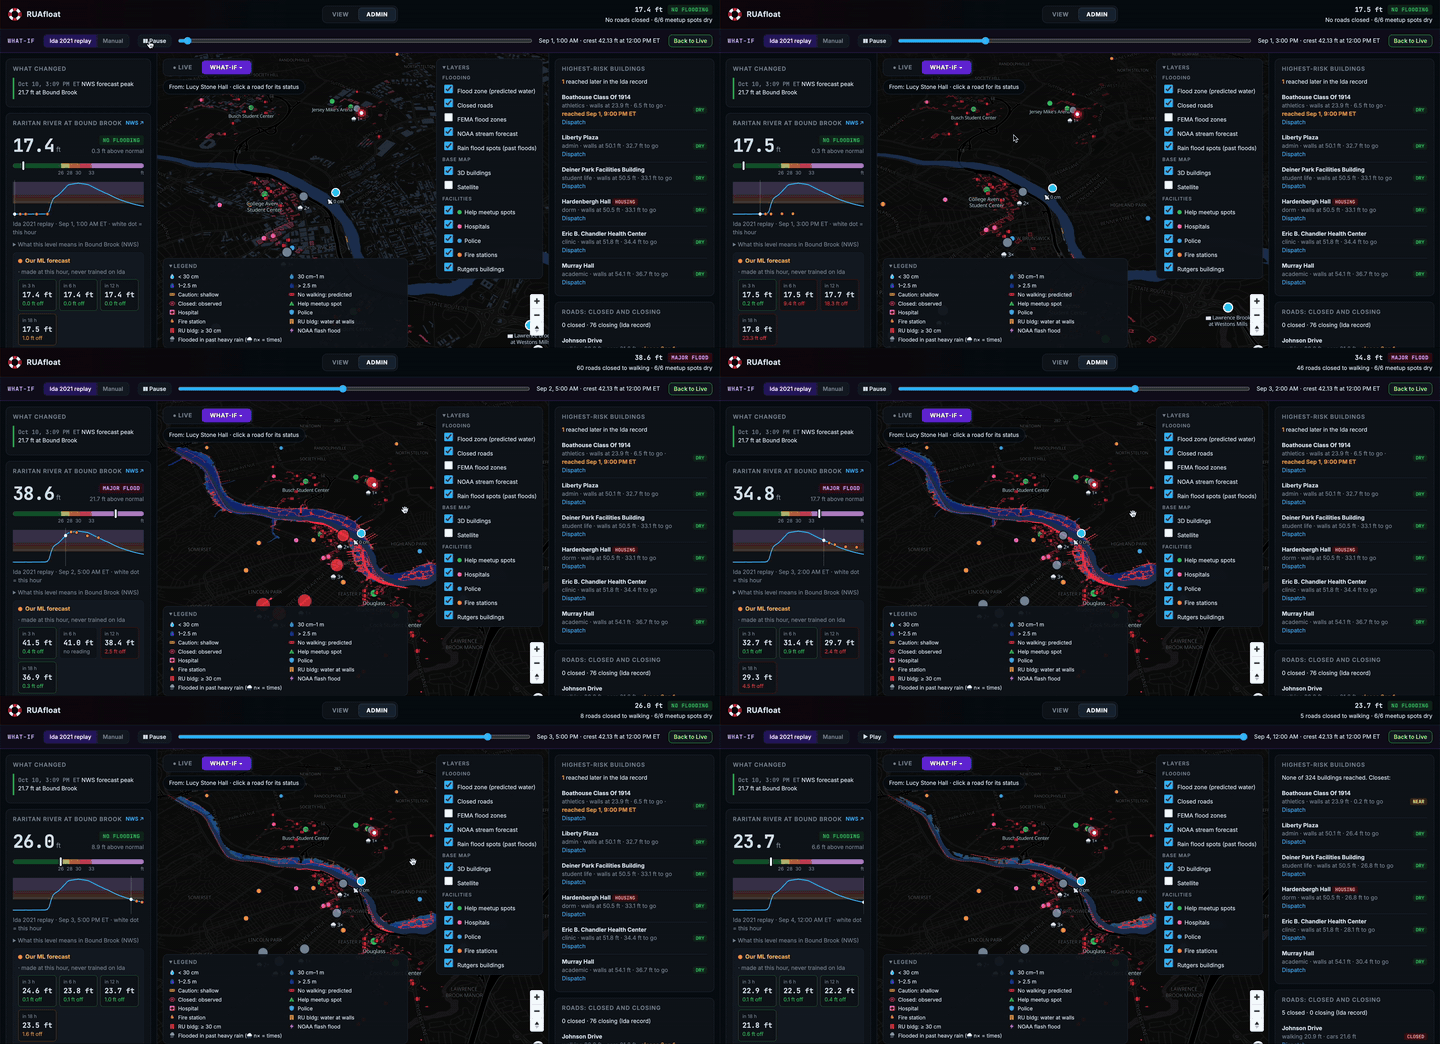
- Map: See estimated flood exposure across roughly 40,000 street segments and 324 Rutgers buildings, alongside FEMA flood zones. Replay seven historical floods, including Hurricane Ida.
- Navigate: Students get walking routes that avoid flooded streets. Gemini writes directions from the calculated route, safety checks verify them, and ElevenLabs reads them aloud.
- Report: Students upload flood photos. Gemini checks for visible water and estimates its depth, giving coordinators more information to review.
- Respond: Coordinators confirm reports and assign the nearest police, fire, or medical unit. Responders receive assignments and update their status through a separate console.
How we built it
- We built RU Afloat with TypeScript, Vite, and MapLibre, using OpenStreetMap for the roads and walking paths.
- To estimate where flooding would happen, we used USGS elevation data to connect rising river levels to roads and buildings. The app then removes paths from walking routes when the estimated water gets too deep.
- We calculate routes directly on the student’s phone, so they don’t have to send us their location to get directions.
- We trained our scikit-learn forecast on readings from seven river gauges dating back to 2012, along with local rainfall. We kept some years out of training, including 2021, so we could test it on storms it hadn’t seen.
- We brought together data from USGS, NWS, NOAA, and FEMA. Gemini helps interpret camera images and student photos, and turns routes into plain-language directions that we check against the actual path.
- ElevenLabs reads those directions aloud.
Challenges we ran into
- Getting a route to look right on a map wasn’t enough. Some early routes went through buildings or took unnecessary detours because starting points connected to the wrong paths. We had to rebuild those connections and test every campus starting point.
- We couldn’t let the AI invent a shelter or give directions that didn’t match the route. We added checks against our own data so its guidance stays grounded in what the app actually knows.
- Finding reliable shelter information was harder than expected. Some records were outdated, and we couldn’t confirm which nearby shelters were open. We chose to show dry meetup spots and clearly explain that they aren’t confirmed emergency shelters.
Accomplishments that we're proud of
- We tested the forecast on Hurricane Ida without using it in training. We wanted to see how the model handled a major flood it hadn’t already learned from.
- We brought information that normally lives in separate systems onto one shared map. Students can look for a safer route while coordinators see the reports and conditions behind it.
- We’re especially proud that we thought about blind and low-vision students from the start. A flood map isn’t useful if you can’t see it, so we included voice interaction, screen-reader support, and spoken, step-by-step directions. We also added readability checks to help keep instructions clear for anyone trying to use the app under stress.
What we learned
- A forecast is only as useful as the data behind it. We spent a lot of our time fixing road connections and cleaning flood data, and those details mattered just as much as training the model.
- How we tested the model mattered too. Holding out entire years helped us avoid giving it information from the same storms we later used to judge its performance.
- Designing for blind users pushed us to make the experience simpler for everyone. Clear cards and one instruction at a time are helpful when someone is stressed, distracted, or unfamiliar with campus.
- We learned to give AI specific jobs and check its output. It can help interpret a photo or explain a route, but the app still needs reliable data and core features that work when AI is unavailable.
What's next for RU Afloat
- We want to test the forecast against more storms and see what it would take to adapt it to other rivers.
- We’d like to work with an emergency agency to turn our dispatch demo into something responders could use in practice.
- We want to add SMS alerts and explore an RU Alert integration, so students with limited mobile data can still receive updates.
- Finally, we want to pilot our sensors on flood-prone roads near the Raritan and test how they hold up outside our demo.
Built With
- arduino
- c++
- css
- elevenlabs
- esp32
- fema
- gemini
- html
- javascript
- maplibre
- national-weather-service
- noaa
- node.js
- numpy
- openstreetmap
- python
- scikit-learn
- typescript
- usgs
- vite
- web-speech-api

Log in or sign up for Devpost to join the conversation.