-
-
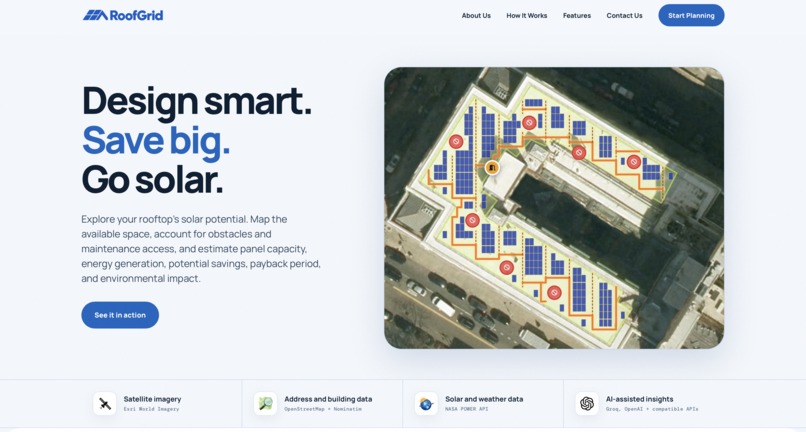
Homepage
-
Contact Us
-
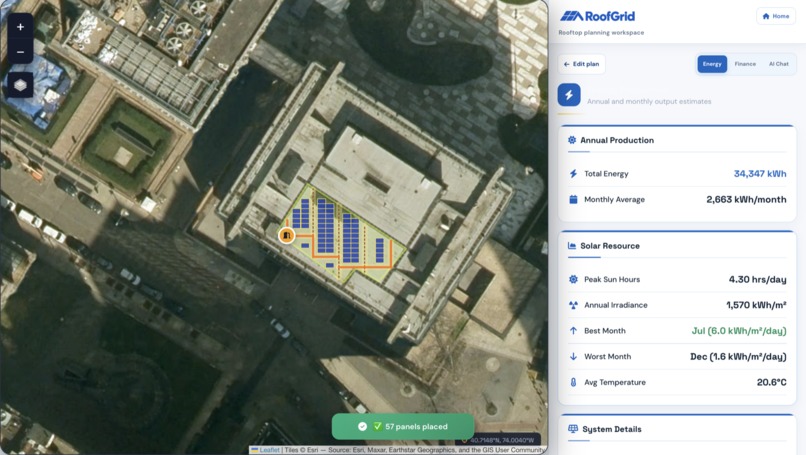
Preview of the UI
-
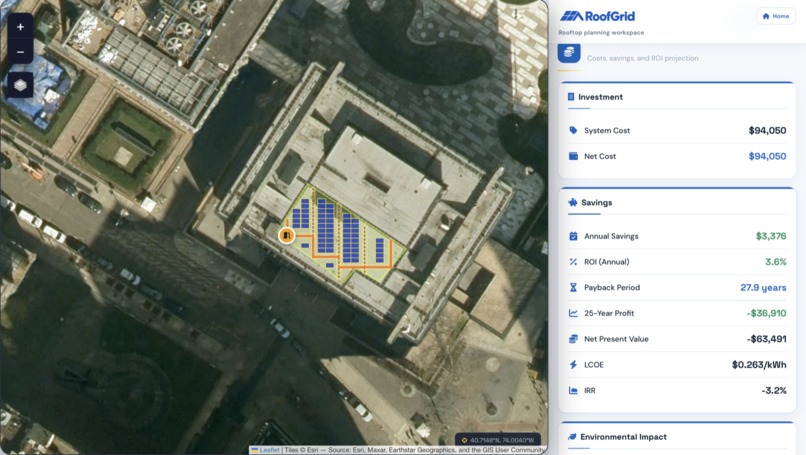
Energy Analysis
-
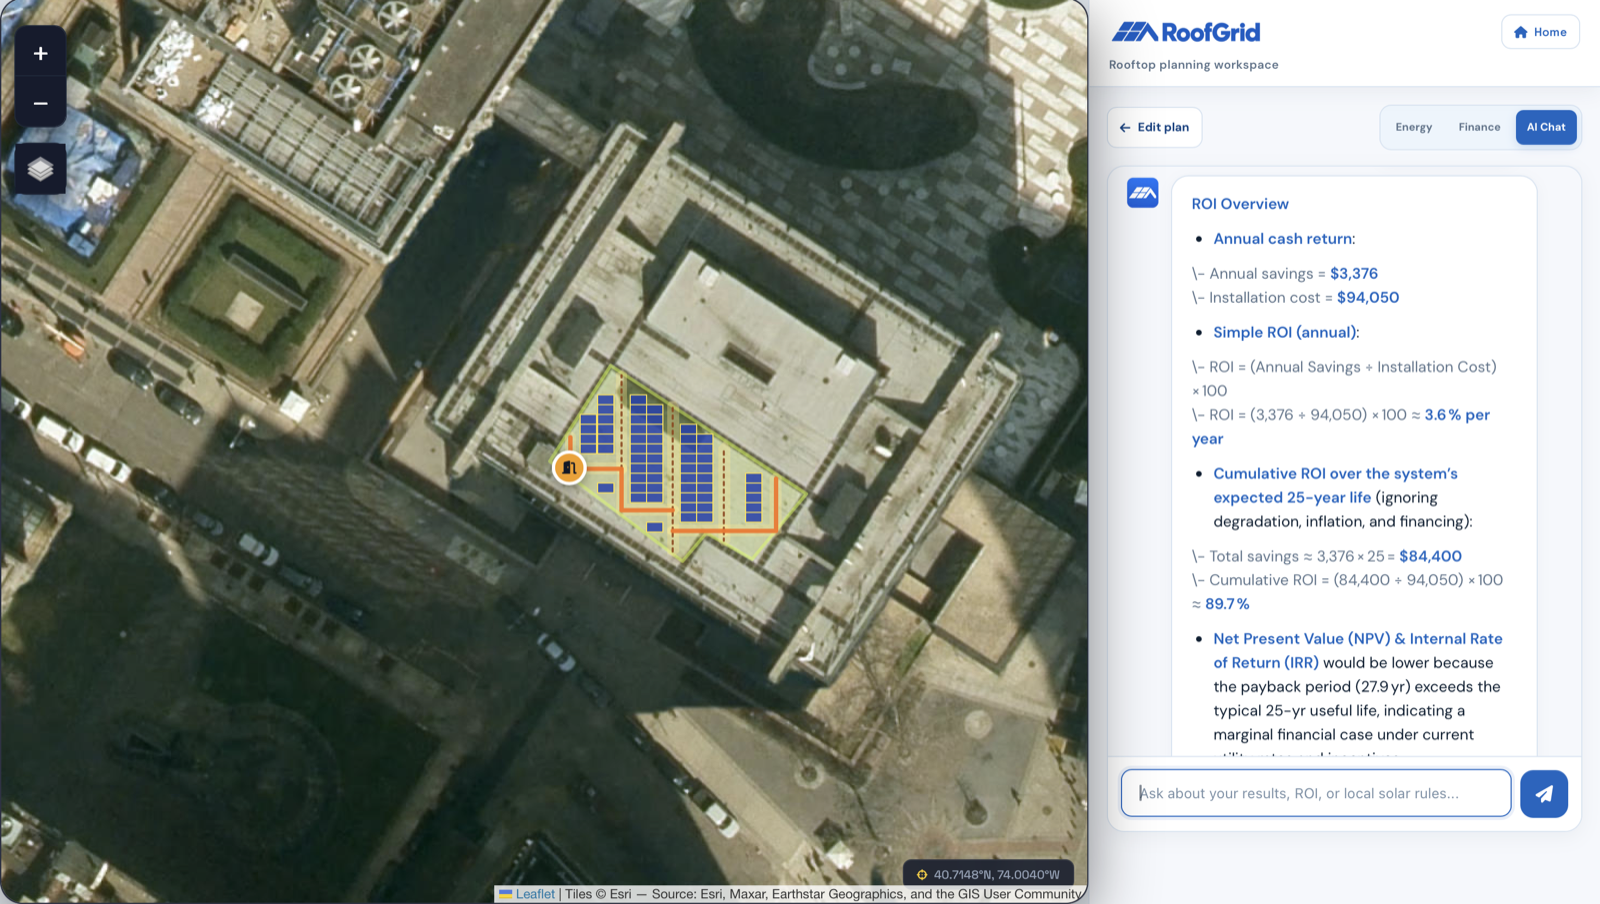
AI Chat

Inspiration
Rooftop solar planning often starts with a deceptively simple question: how many panels can fit on this roof?
But a roof is not just an empty rectangle.
Real installations have roof boundaries, stair or ladder access points, AC units, vents, skylights, maintenance requirements, irregular geometry, and different local energy economics. A layout that maximizes panel count but blocks the only maintenance route is not a very useful layout.
That gap inspired RoofGrid.
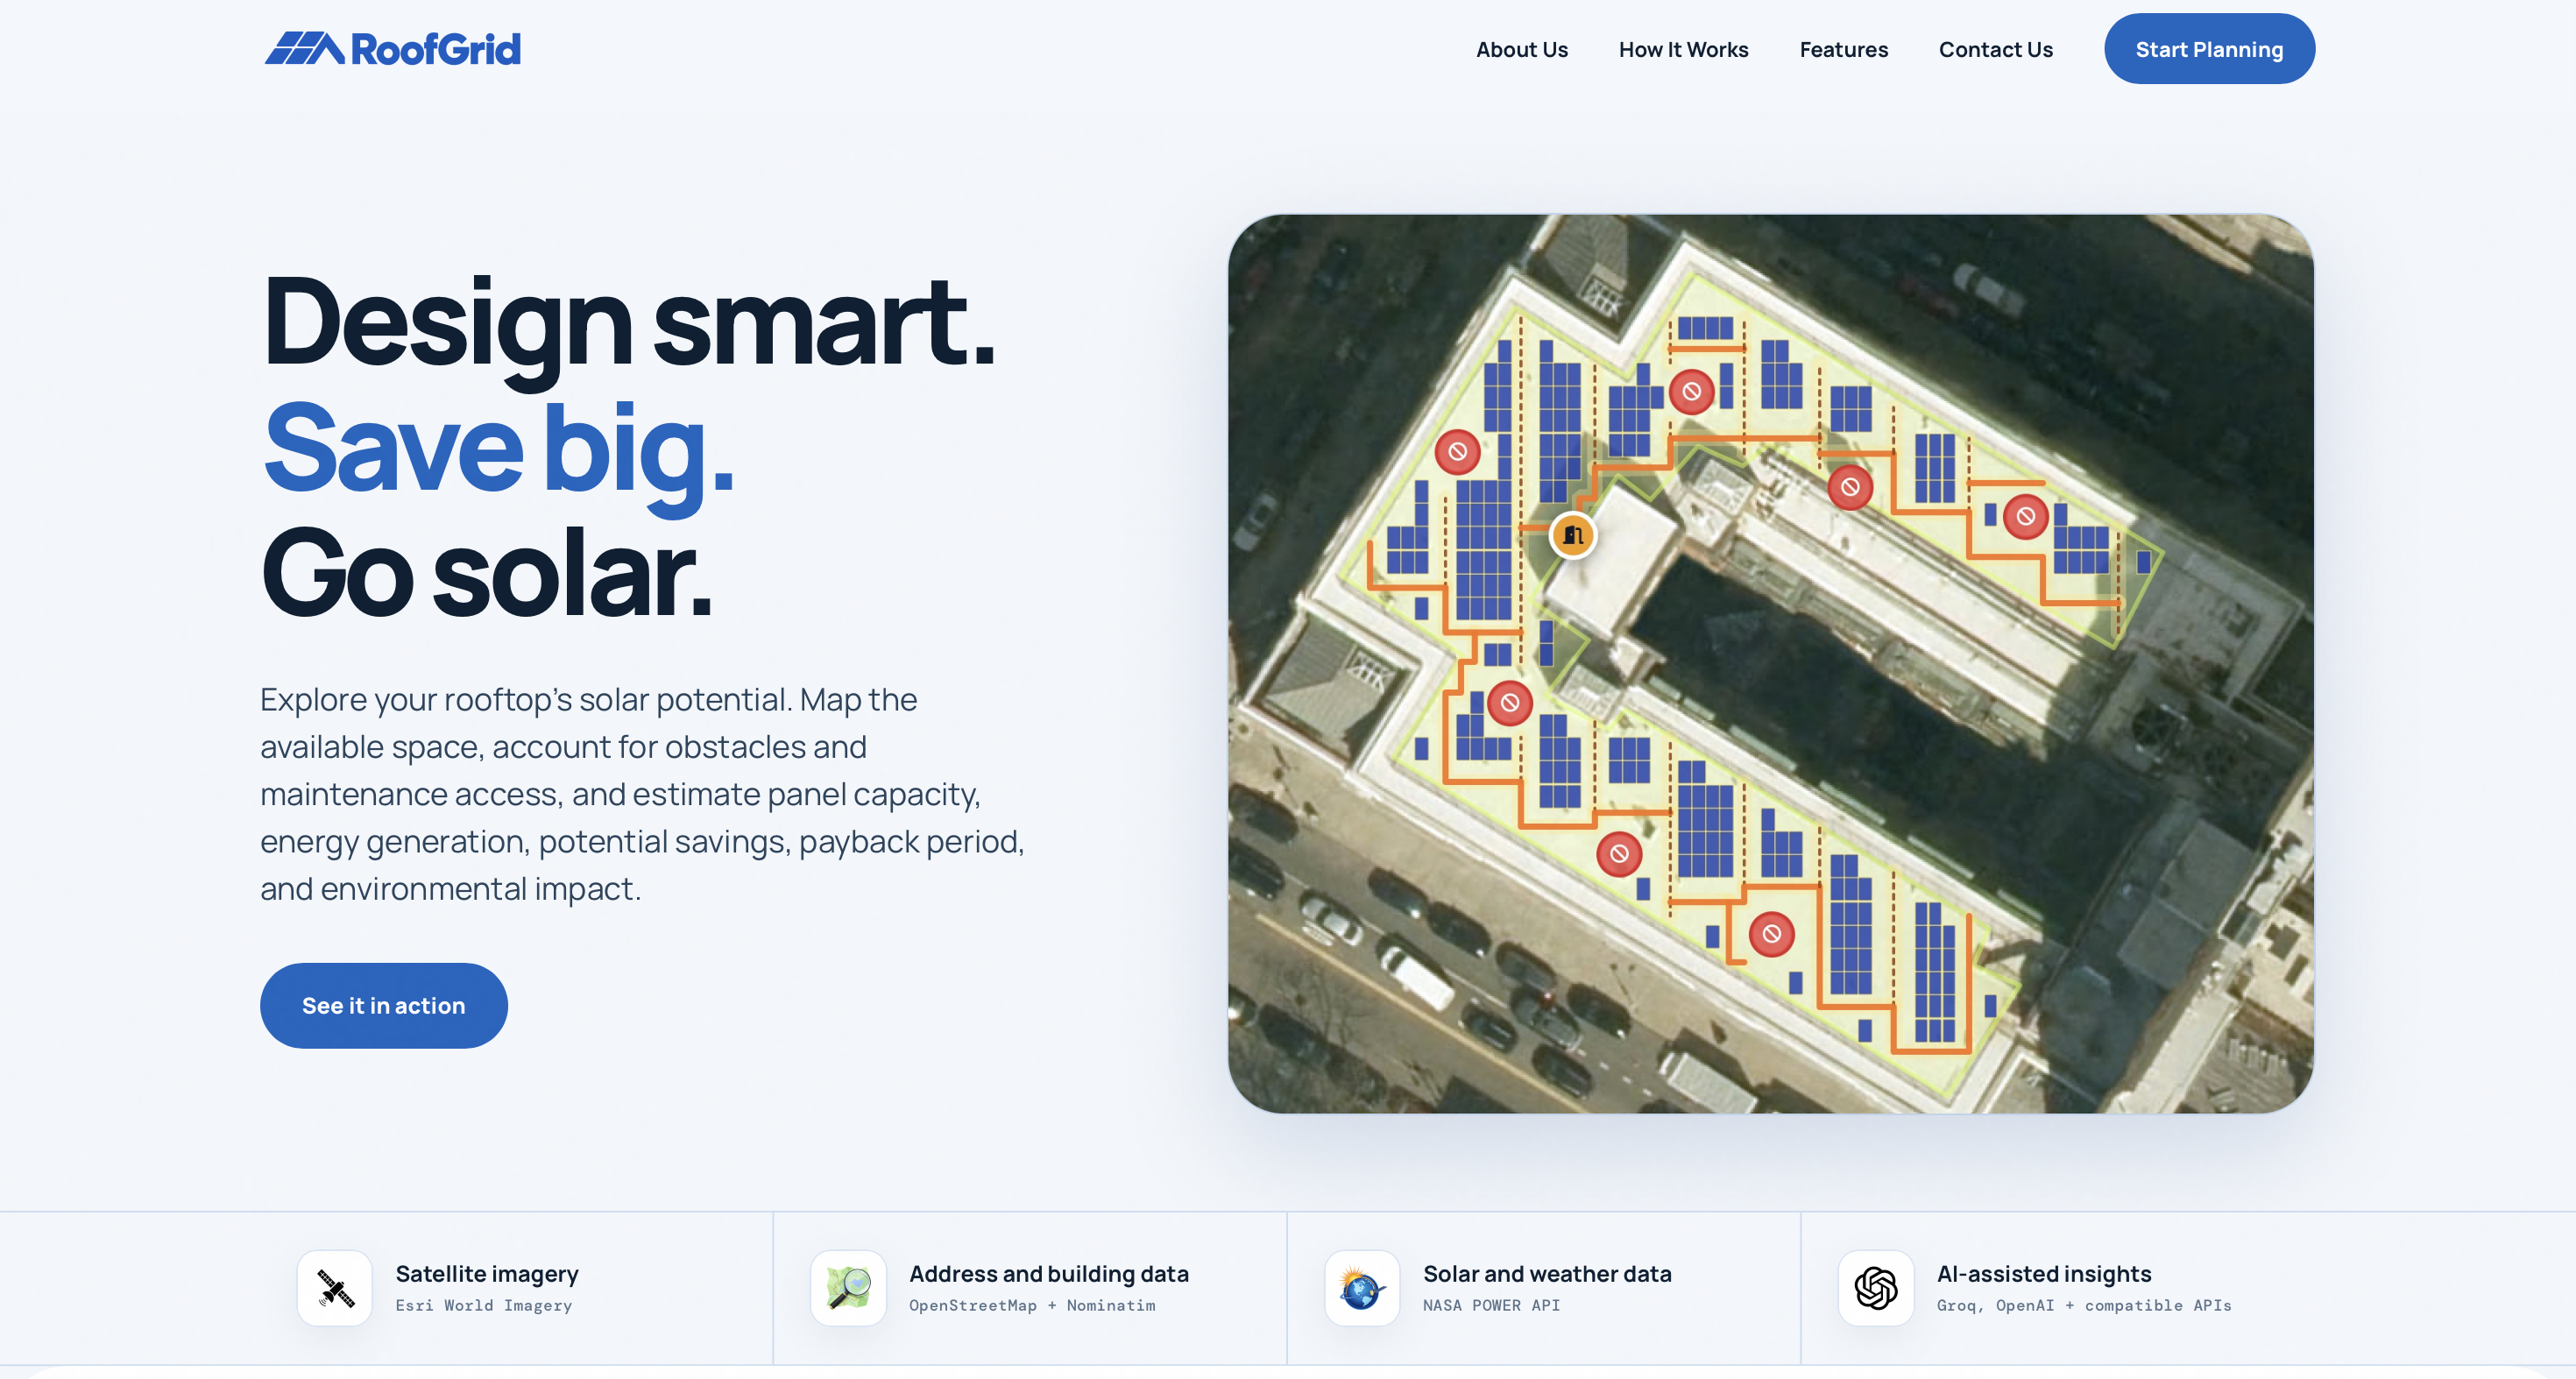
We wanted to build a tool that goes beyond a basic solar calculator and connects the entire early-stage planning process: find a real rooftop, understand its usable geometry, preserve access, place panels around constraints, estimate generation, evaluate the economics, understand the environmental impact, and turn the result into something a user can actually act on.
The goal was not to replace an engineer or installer. It was to make the first stage of solar planning much more visual, accessible, and realistic.
What it does
A user can:
1. Search for any location or use their current location.
2. Explore the property using satellite imagery.
3. Automatically detect available OpenStreetMap building footprints, or manually draw the rooftop boundary.
4. Review and refine the roof outline to ensure the usable area is accurate.
5. Mark the real rooftop access point, such as a staircase, hatch, or ladder.
6. Generate a connected maintenance-access network that keeps the rooftop safely navigable.
7. Identify and mark rooftop obstacles such as AC units, vents, water tanks, and skylights.
8. Automatically generate a solar panel layout that accounts for:
- roof geometry
- obstacles
- maintenance pathways
- service accessibility
- panel orientation
- required spacing
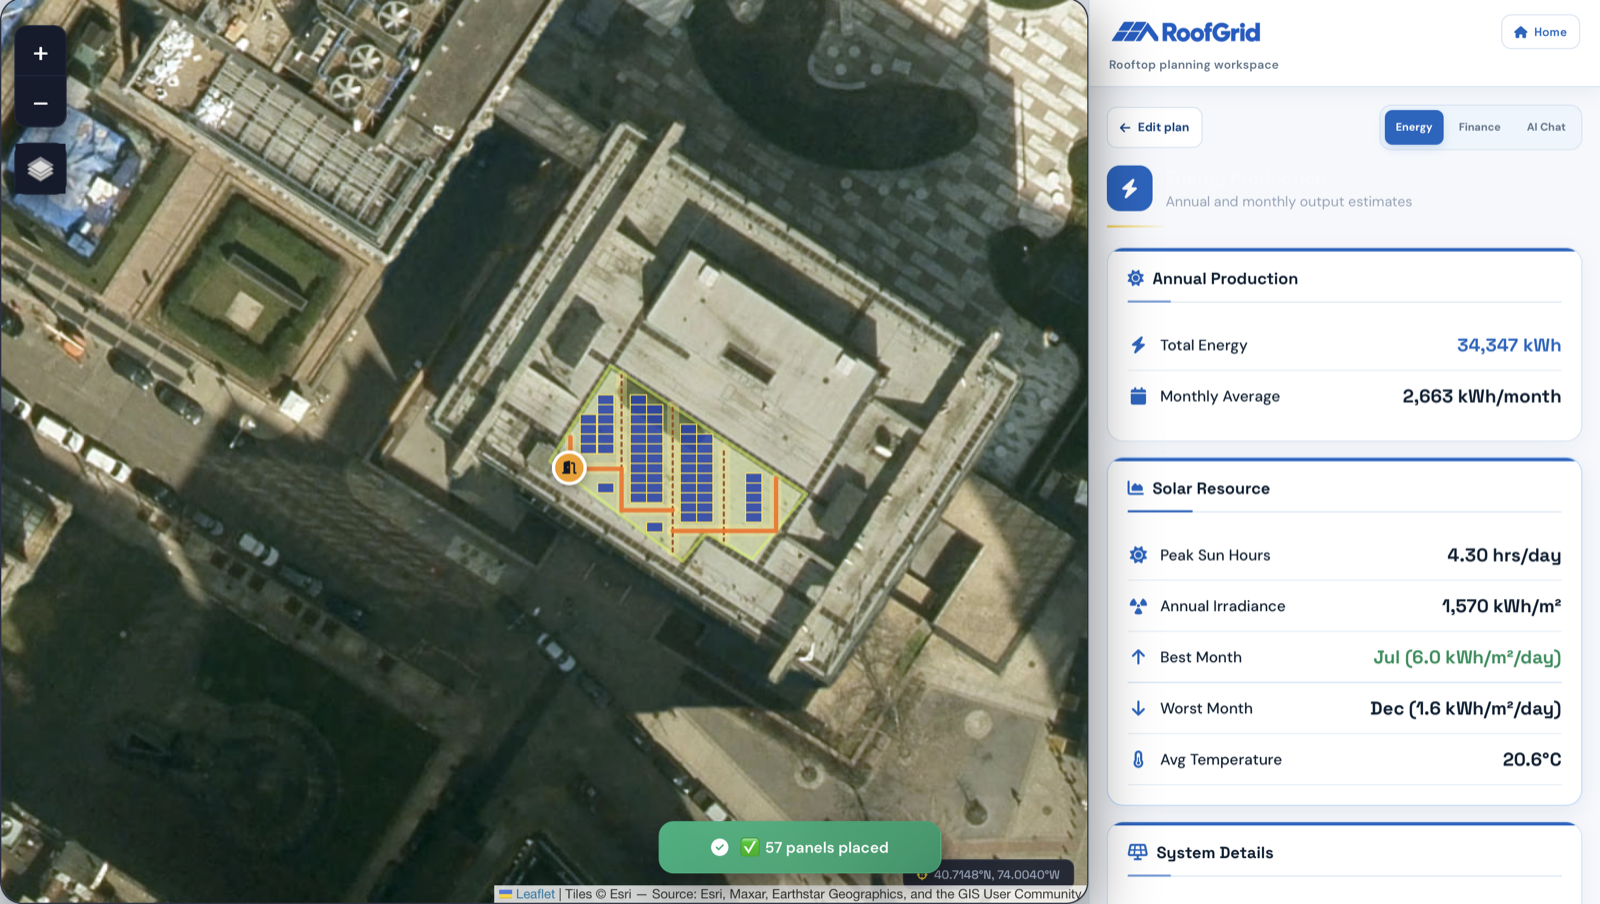
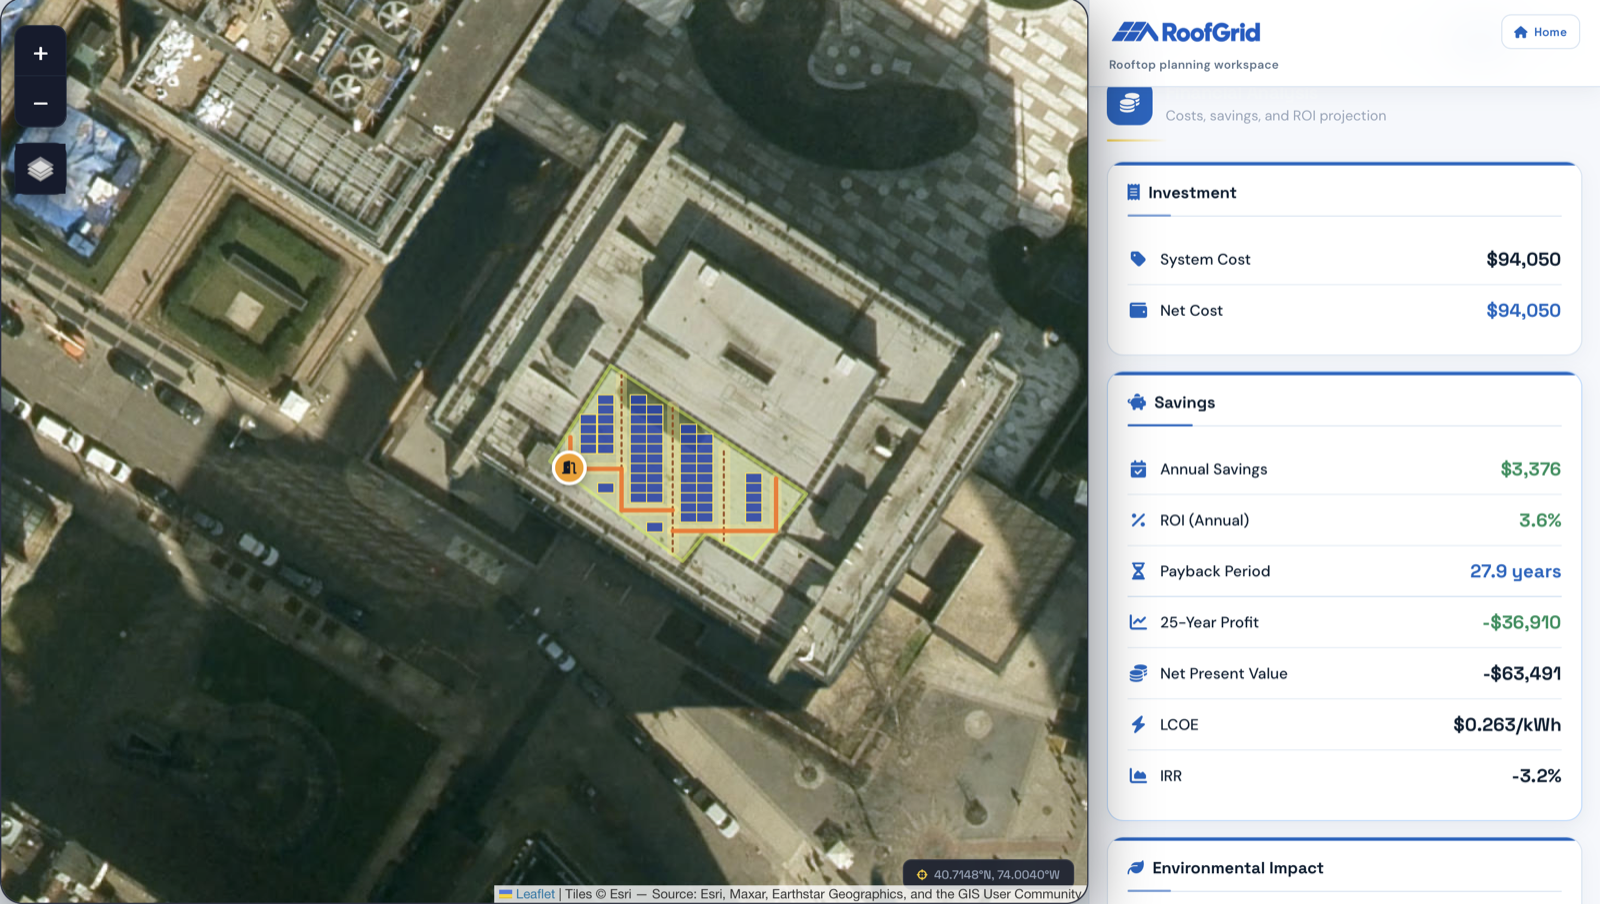
9. Analyze the proposed installation across technical, financial, and environmental metrics, including:
- system capacity
- monthly and annual energy generation
- installation cost
- electricity savings
- payback period
- ROI
- NPV
- IRR
- LCOE
- environmental impact
10. Ask RoofGrid AI questions about the generated layout, calculations, assumptions, and projected system performance.
11. Export the complete analysis as a PDF solar planning report.
RoofGrid also keeps the underlying assumptions transparent. Users can edit variables such as electricity price, export tariff, installation cost, annual electricity consumption, self-consumption rate, soiling losses, currency, and grid-emissions intensity, rather than relying on hidden constants.
The result is an interactive rooftop solar planning workflow that goes beyond simply estimating how many panels can fit—it considers real rooftop constraints, safe maintenance access, energy performance, financial viability, and environmental impact in one place.
How we built it
RoofGrid is built as a lightweight web application with most of the spatial planning happening directly in the browser.
Mapping and rooftop geometry
We used Leaflet as the mapping layer with Esri World Imagery for satellite views and OpenStreetMap as an alternate map source.
Address search uses Nominatim, while building footprints are requested from OpenStreetMap through the Overpass API. If the available building data is incomplete or inaccurate, the user can simply draw and edit the rooftop manually.
For geographic calculations, we use Turf.js.
Once a roof has been selected, RoofGrid converts its geographic polygon into a local meter-based coordinate system and searches for possible panel layouts.
Instead of estimating panel capacity from:
roof area / panel area
RoofGrid actually attempts to place panels.
For each candidate orientation, it creates a grid of possible panels and checks whether every corner of every panel lies inside the roof polygon.
It also tests multiple grid offsets so that a slightly shifted layout is not accidentally rejected when it could fit additional panels.
Candidate rotations are generated partly from the orientation of the roof's longest edges, allowing the layout to adapt to irregular buildings.
The best valid configuration becomes the proposed layout.
Making the roof access-aware
This became one of the most interesting parts of the project.
We did not want to simply subtract a fixed percentage of roof area for maintenance.
Instead, the user marks the actual rooftop entry point.
RoofGrid then builds a grid representation of the usable roof and checks which cells are:
- inside the roof,
- outside marked obstacles, and
- reachable from the entrance.
From that grid, we use a breadth-first search based connectivity model to construct maintenance lanes connected back to the entry point.
The system then buffers those paths into physical walkway exclusion zones.
When evaluating a panel, RoofGrid checks whether it:
- intersects an obstacle,
- intersects a maintenance walkway, or
- falls beyond the configured maintenance/service reach.
If any of those checks fail, that panel is rejected.
This means adding or moving an obstacle can dynamically change both the access network and the number of panels that can actually be installed.
Solar and energy analysis
Once the physical layout is complete, RoofGrid queries the NASA POWER API for location-specific solar climatology.
We use values including:
- all-sky solar irradiation,
- clear-sky irradiation, and
- temperature.
Instead of treating the solar resource as identical throughout the year, RoofGrid calculates production from monthly irradiation values.
The estimate incorporates factors such as:
- system size,
- panel efficiency,
- temperature derating,
- soiling loss,
- shading allowance,
- panel tilt,
- orientation,
- system losses, and
- first-year degradation.
We calculate annual generation using multiple approaches and combine the monthly irradiation model with irradiation- and capacity-based estimates.
This gives the user not only a single annual number but also a monthly production profile.
Financial and environmental analysis
Solar potential is only useful if the user can understand what it means financially.
RoofGrid therefore combines predicted production with editable assumptions for:
- electricity tariff,
- exported-energy compensation,
- installation cost per watt,
- annual electricity consumption,
- self-consumption percentage, and
- local currency.
From those values, we calculate simple payback and annual savings, as well as longer-term metrics including 25-year cash flow, NPV, IRR, and levelized cost of energy (LCOE).
The lifetime model also accounts for panel degradation, maintenance costs, cost escalation, inflation, discounting, and an inverter replacement assumption.
We also estimate avoided grid emissions using an editable grid-emissions factor and translate that into easier-to-understand environmental equivalents.
The important design decision was to keep these assumptions visible and editable. Electricity tariffs, installation costs, export policies, and grid emissions vary enormously between locations, so pretending one universal number is correct would make the result misleading.
RoofGrid AI
We also built an AI assistant directly into the analysis workflow.
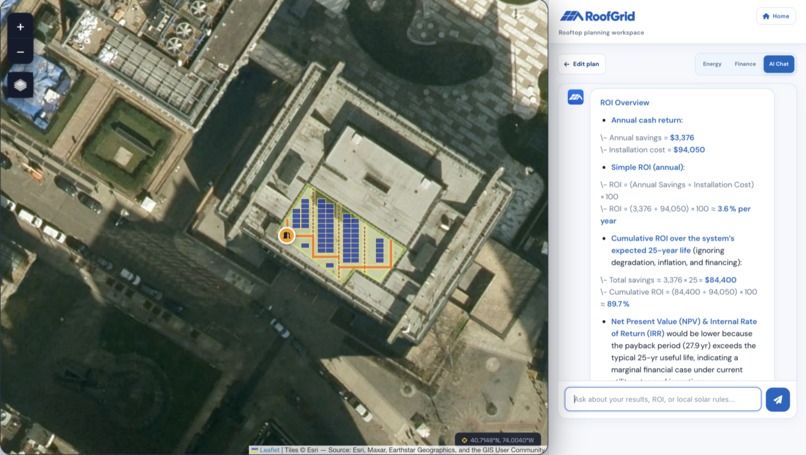
Instead of being a generic chatbot, it receives context from the user's current RoofGrid calculation, including system size, roof area, expected production, cost, savings, and payback period.
That allows users to ask questions such as:
- Why is my payback period this long?
- What happens if electricity prices increase?
- Would reducing the number of panels make sense?
- What does this production estimate mean for my electricity usage?
The AI integration goes through a server-side OpenAI-compatible proxy, with Groq configured as the default provider, so API credentials are not exposed in the frontend.
Challenges we faced
1. Panel placement was a geometry problem, not an area problem
Our first major realization was that knowing the roof area does not tell us how many panels actually fit.
Irregular boundaries, rotation, spacing, obstacles, and access routes can make two roofs with the same area support very different layouts.
We solved this by moving from area-based estimation to actual polygon-based panel placement, testing candidate rotations and offsets and validating each proposed panel against the roof.
2. Preserving maintenance access without wasting the roof
Simply reserving a giant strip through the middle of every roof wastes usable area.
At the same time, maximizing panel density without preserving access creates unrealistic plans.
Building the connected access network became a graph problem. We had to ensure maintenance paths remained inside the roof, avoided obstacles, connected back to the entrance, and still kept the rest of the roof available for panels.
3. Working with imperfect real-world map data
OpenStreetMap building outlines can be missing, simplified, or slightly misaligned with satellite imagery.
Instead of pretending automatic detection is always correct, RoofGrid treats detected footprints as a starting point. Users can review the outline, modify it, or draw the roof manually.
That combination turned out to be much more practical than relying entirely on automation.
4. Making global estimates without pretending local assumptions are universal
Solar irradiation can be obtained globally, but financial conditions cannot.
Electricity rates, installation prices, grid emissions, export compensation, and consumption patterns can vary even within the same country.
We added geographic presets to make the first experience easier, but kept the important assumptions editable so users can replace defaults with values relevant to their own situation.
5. Keeping the application responsive
Panel placement involves testing many candidate polygons against other polygons.
For larger rooftops this can become expensive very quickly.
We added limits, caching, debounced calculations, optimized layout searches, and different visualization strategies. For very large arrays, RoofGrid can avoid rendering thousands of individually interactive panel objects and instead display a simplified coverage visualization.
What we learned
Building RoofGrid taught us that the hardest part of renewable-energy software is often connecting physical reality with software abstractions.
A solar calculator can produce an answer from a few multiplication formulas. A useful planning tool has to understand geometry, accessibility, uncertainty, climate data, financial assumptions, and user interaction at the same time.
We also learned the importance of transparent assumptions.
Displaying an impressive ROI number is easy. Explaining where the electricity tariff, installation cost, production estimate, degradation rate, and emissions factor came from is much more important.
Another major lesson was that automation should not remove user control. OpenStreetMap detection saves time, but manual drawing and editing are essential when geographic data is incomplete.
Finally, we learned to design external integrations defensively. Mapping, Overpass, NASA POWER, and AI services can all fail or time out, so the application needs validation, server-side proxies, sensible error states, caching, and alternative user flows.
Accomplishments that we're proud of
We are especially proud that RoofGrid became more than a solar-output calculator.
It now combines:
- real satellite maps,
- building-footprint detection,
- manual roof editing,
- computational geometry,
- automatic panel-layout optimization,
- obstacle exclusion,
- connected rooftop maintenance planning,
- NASA POWER solar data,
- monthly energy modeling,
- localized financial assumptions,
- long-term investment analysis,
- environmental-impact estimates,
- contextual AI assistance, and
- downloadable PDF reports
into one continuous rooftop-to-decision workflow.
The feature we are most proud of is the access-aware layout engine. It forces the planner to answer a more realistic question:
Not “How many panels can theoretically cover this roof?” but “How many panels can we place while still keeping the roof usable?”
What's next for RoofGrid
RoofGrid is currently an early-stage planning and decision-support tool, not an engineering or permitting product.
The next step would be to move closer to engineering-grade planning by adding:
- higher-resolution roof and elevation data,
- 3D shadow and obstruction modeling,
- roof pitch and multiple roof-plane detection,
- configurable fire and safety setbacks,
- structural-load inputs,
- local utility and permitting datasets,
- battery-storage simulation,
- scenario comparison,
- verified tariff and incentive integrations, and
- installer or engineer handoff workflows.
Long term, the vision is for RoofGrid to become a bridge between “Could solar work here?” and “Here is a practical plan worth taking to a professional.”
Built with
JavaScript · Python · HTML/CSS · Leaflet · Leaflet Draw · Turf.js · OpenStreetMap · Overpass API · Nominatim · Esri World Imagery · NASA POWER · Chart.js · jsPDF · Groq / OpenAI-compatible APIs · Vercel


Log in or sign up for Devpost to join the conversation.