

Inspiration
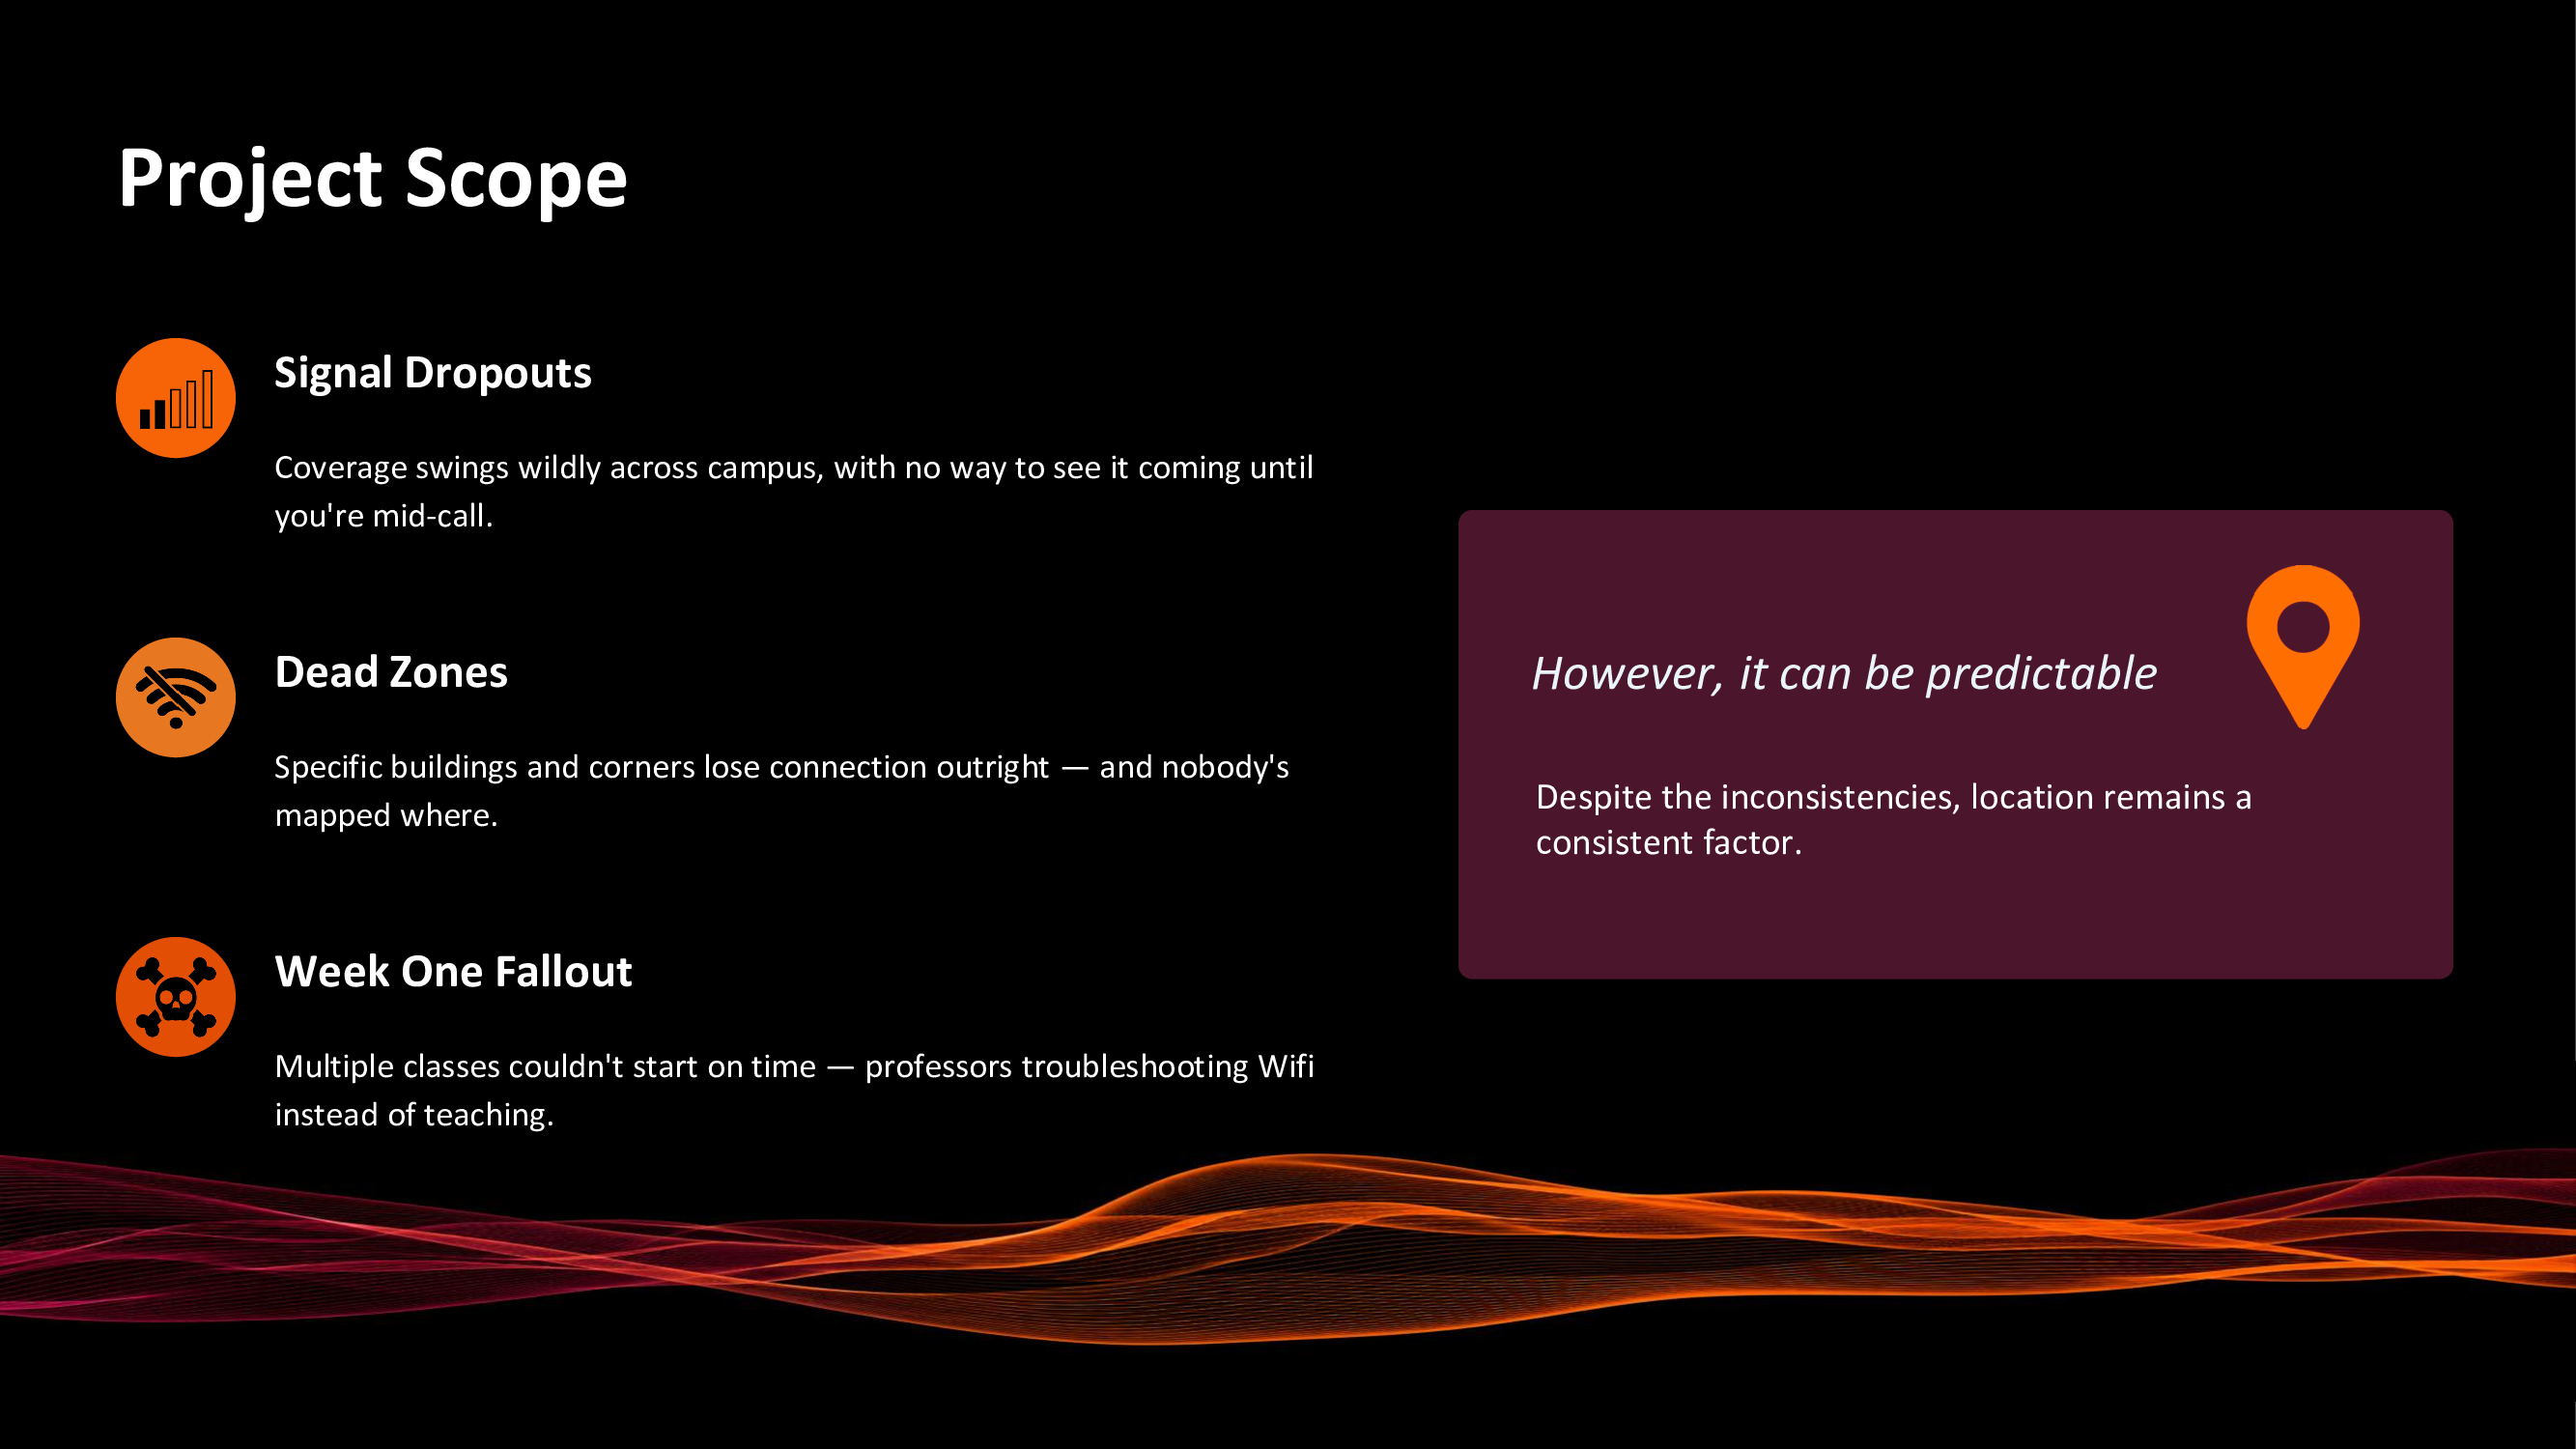
The first week of the semester, Eduroam let us down as multiple classes couldn't start on time because professors were stuck fighting Wi-Fi instead of teaching. That's not a rare fluke as it's a symptom of something nobody actually measures. Everyone on campus has a story about a dead zone, but there's no map, no data, and no warning system. We had a network engineering background on the team and realized: the network is already generating the signal that would answer this. Nobody's reading it. That became RoamRadar.
What it does
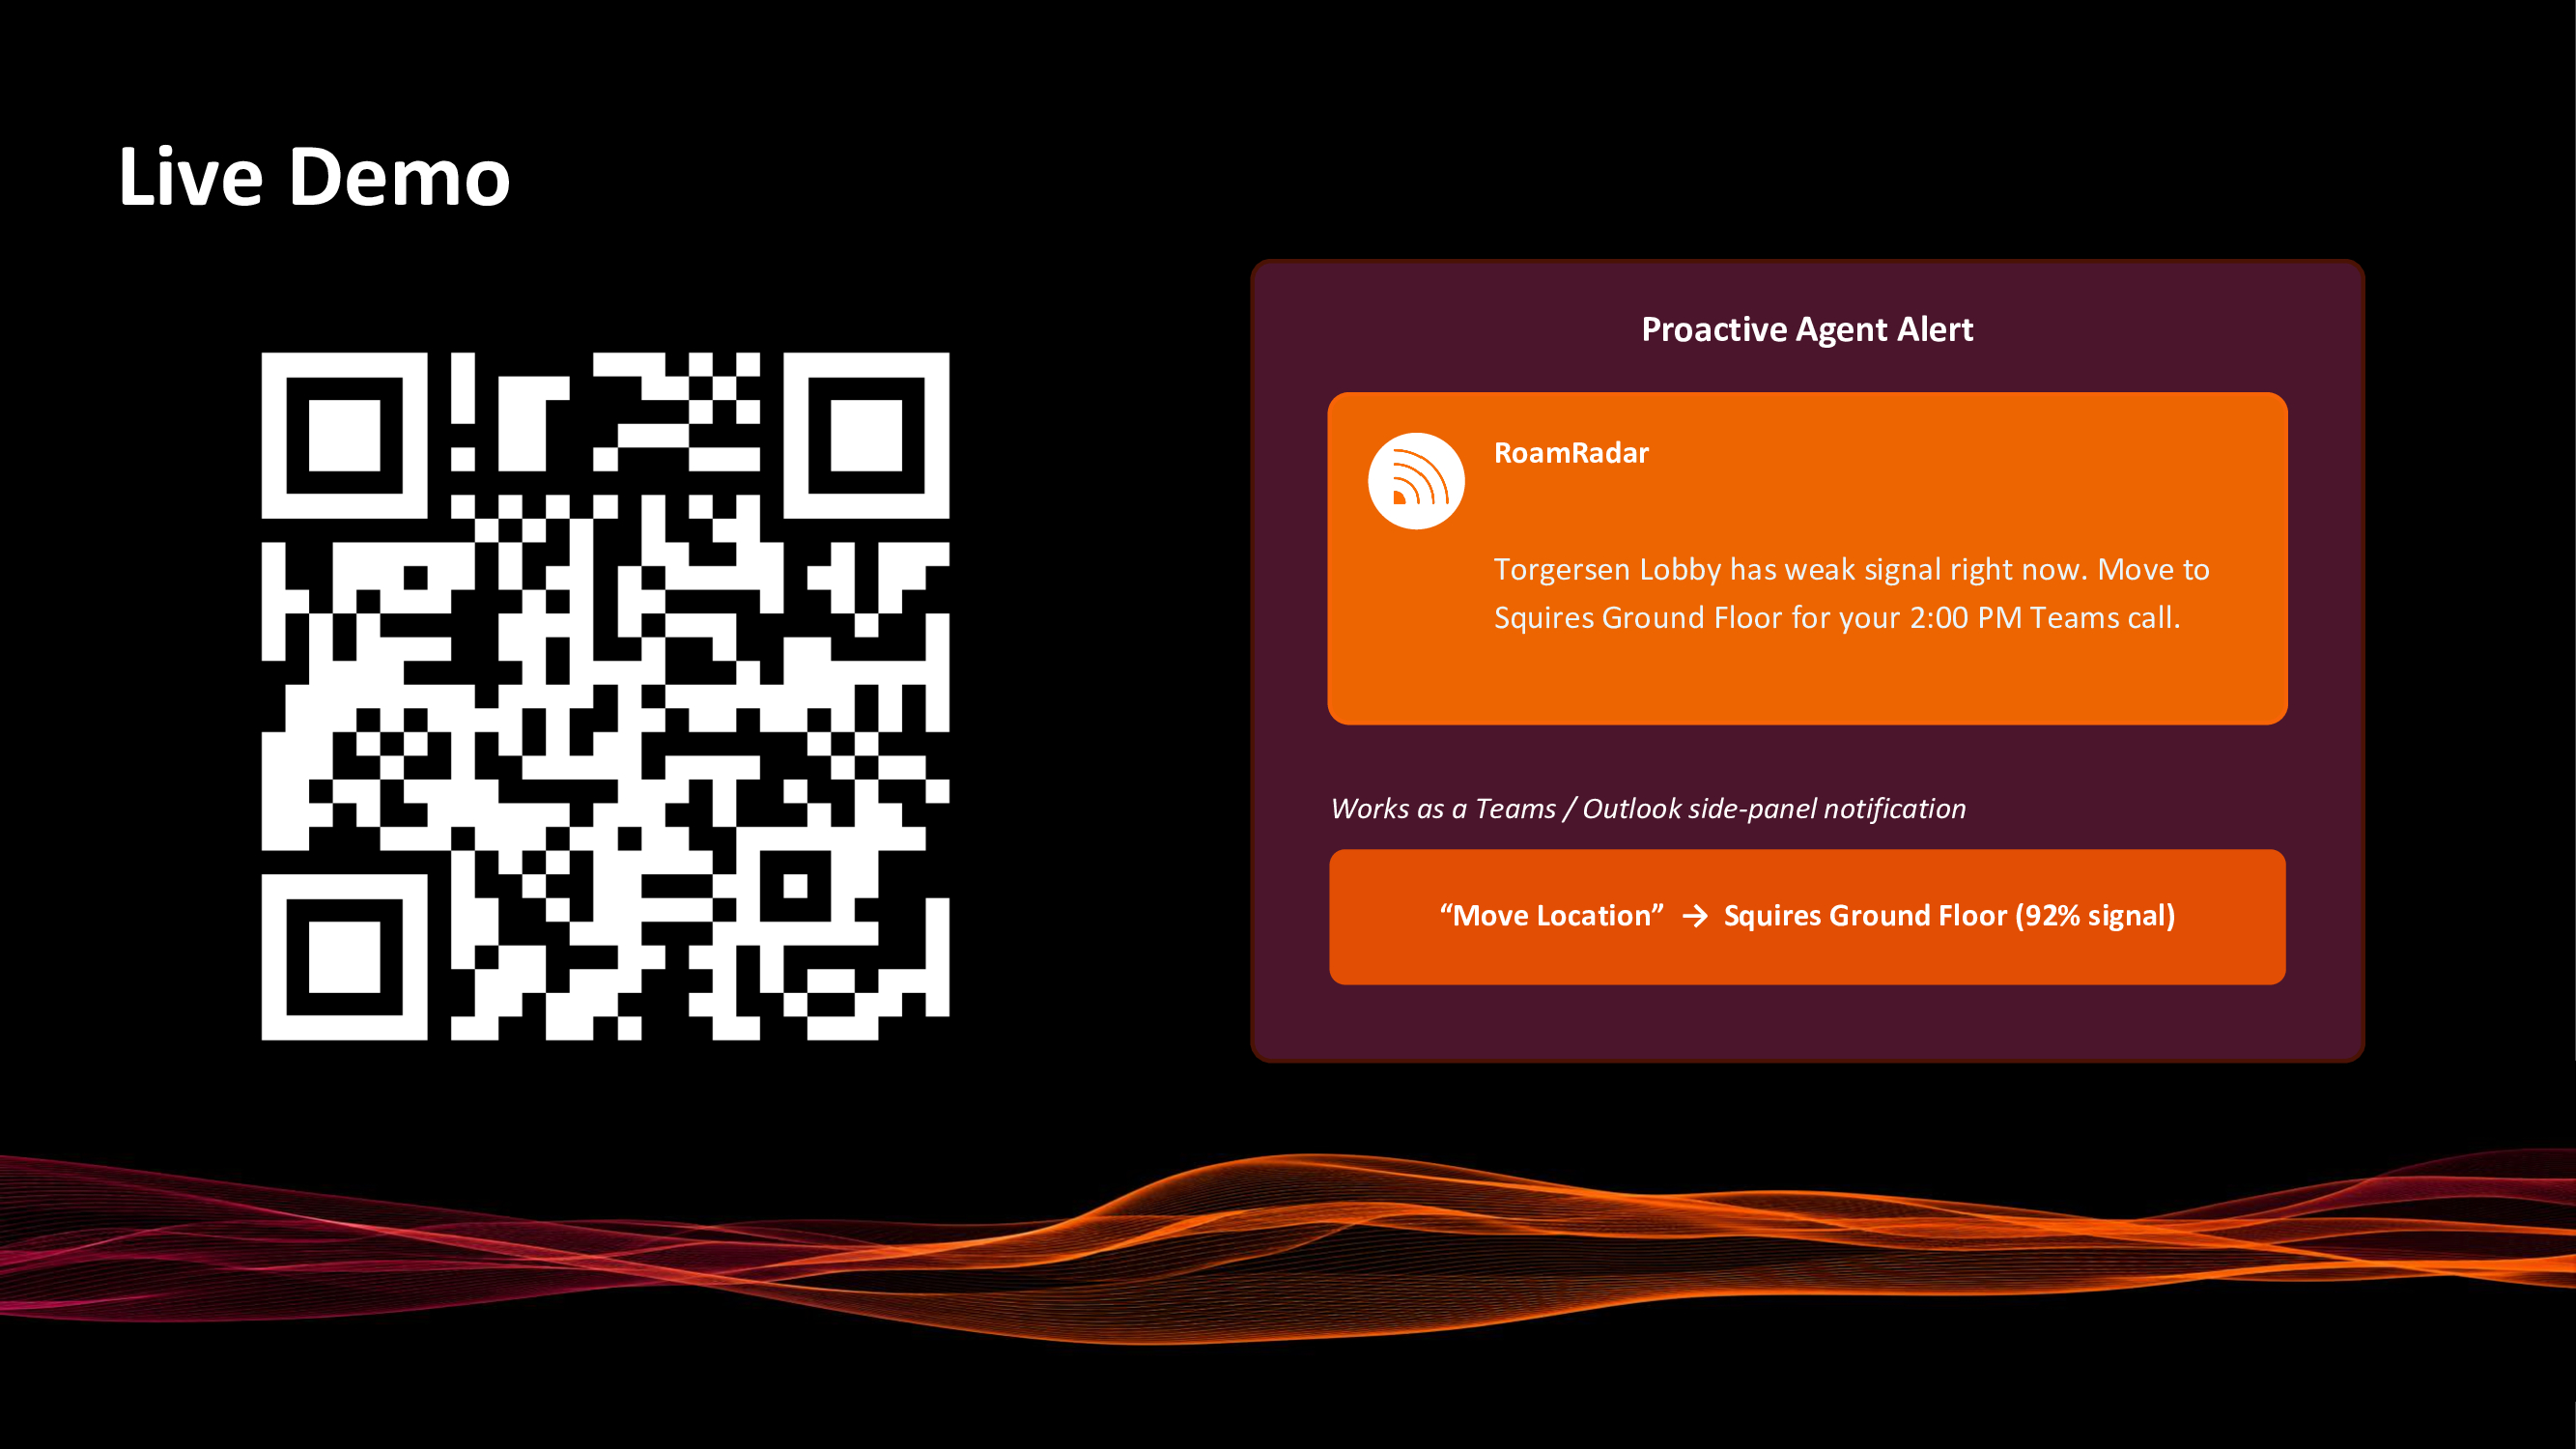
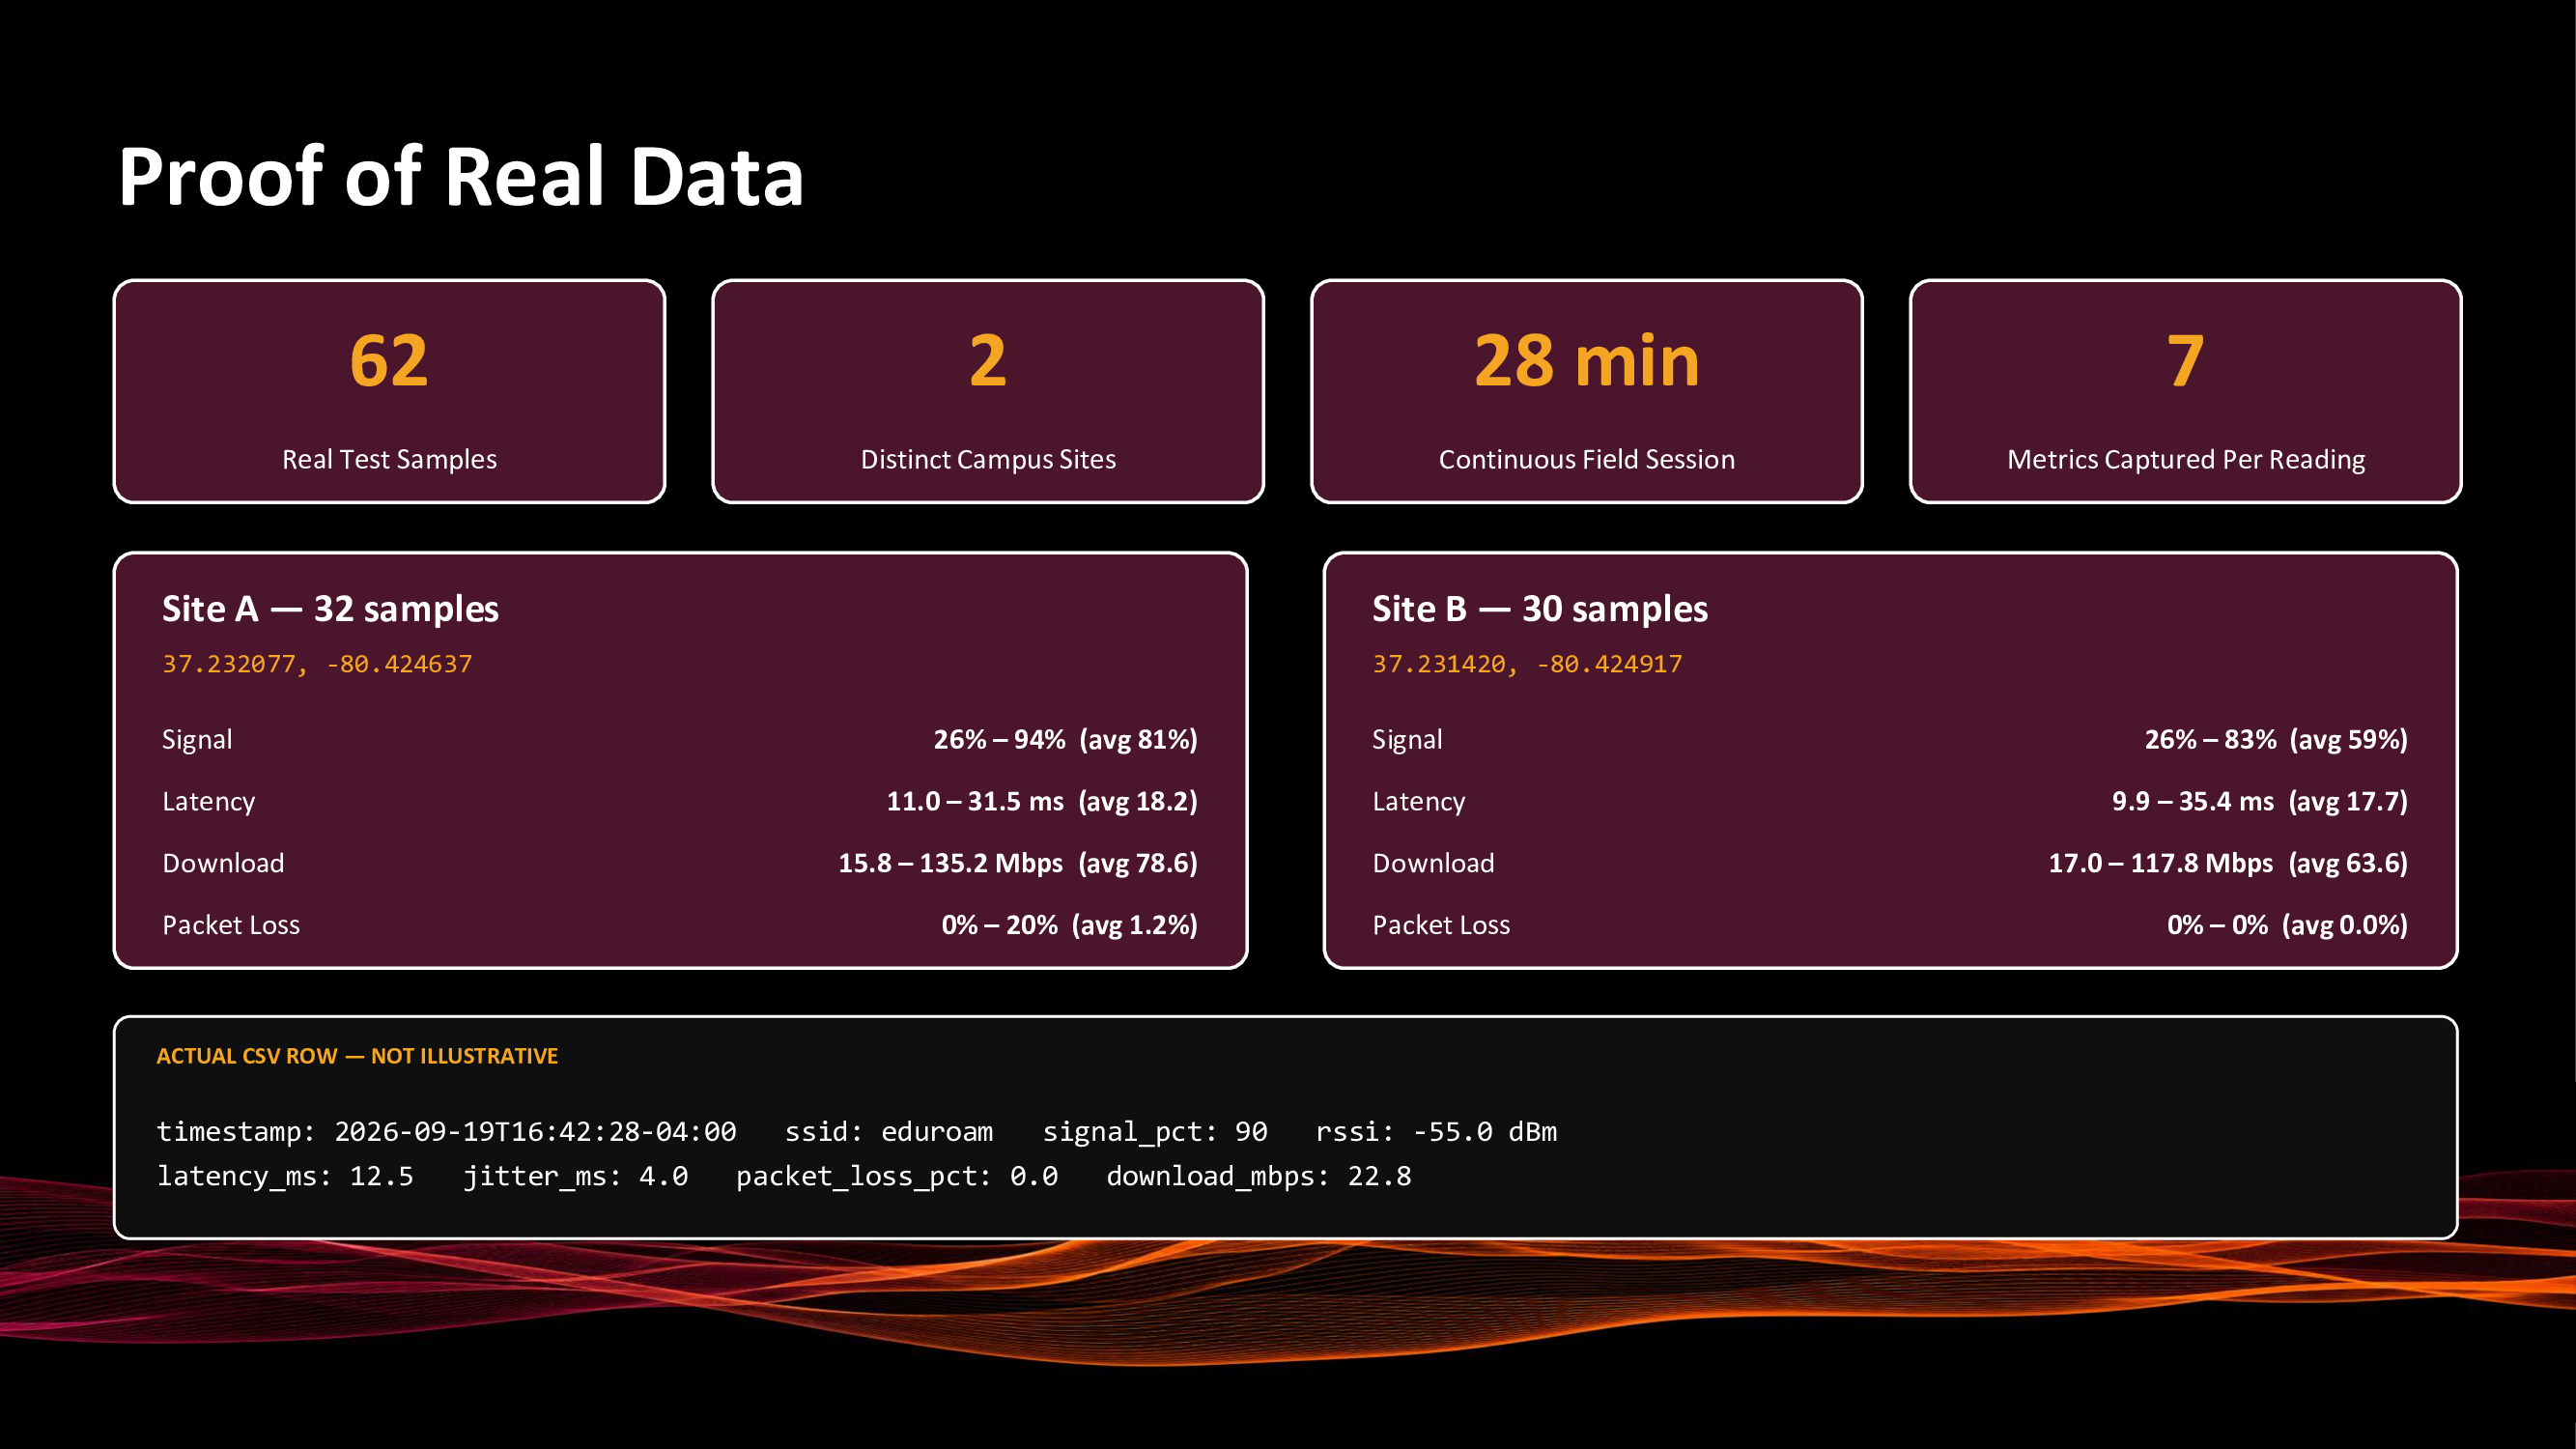
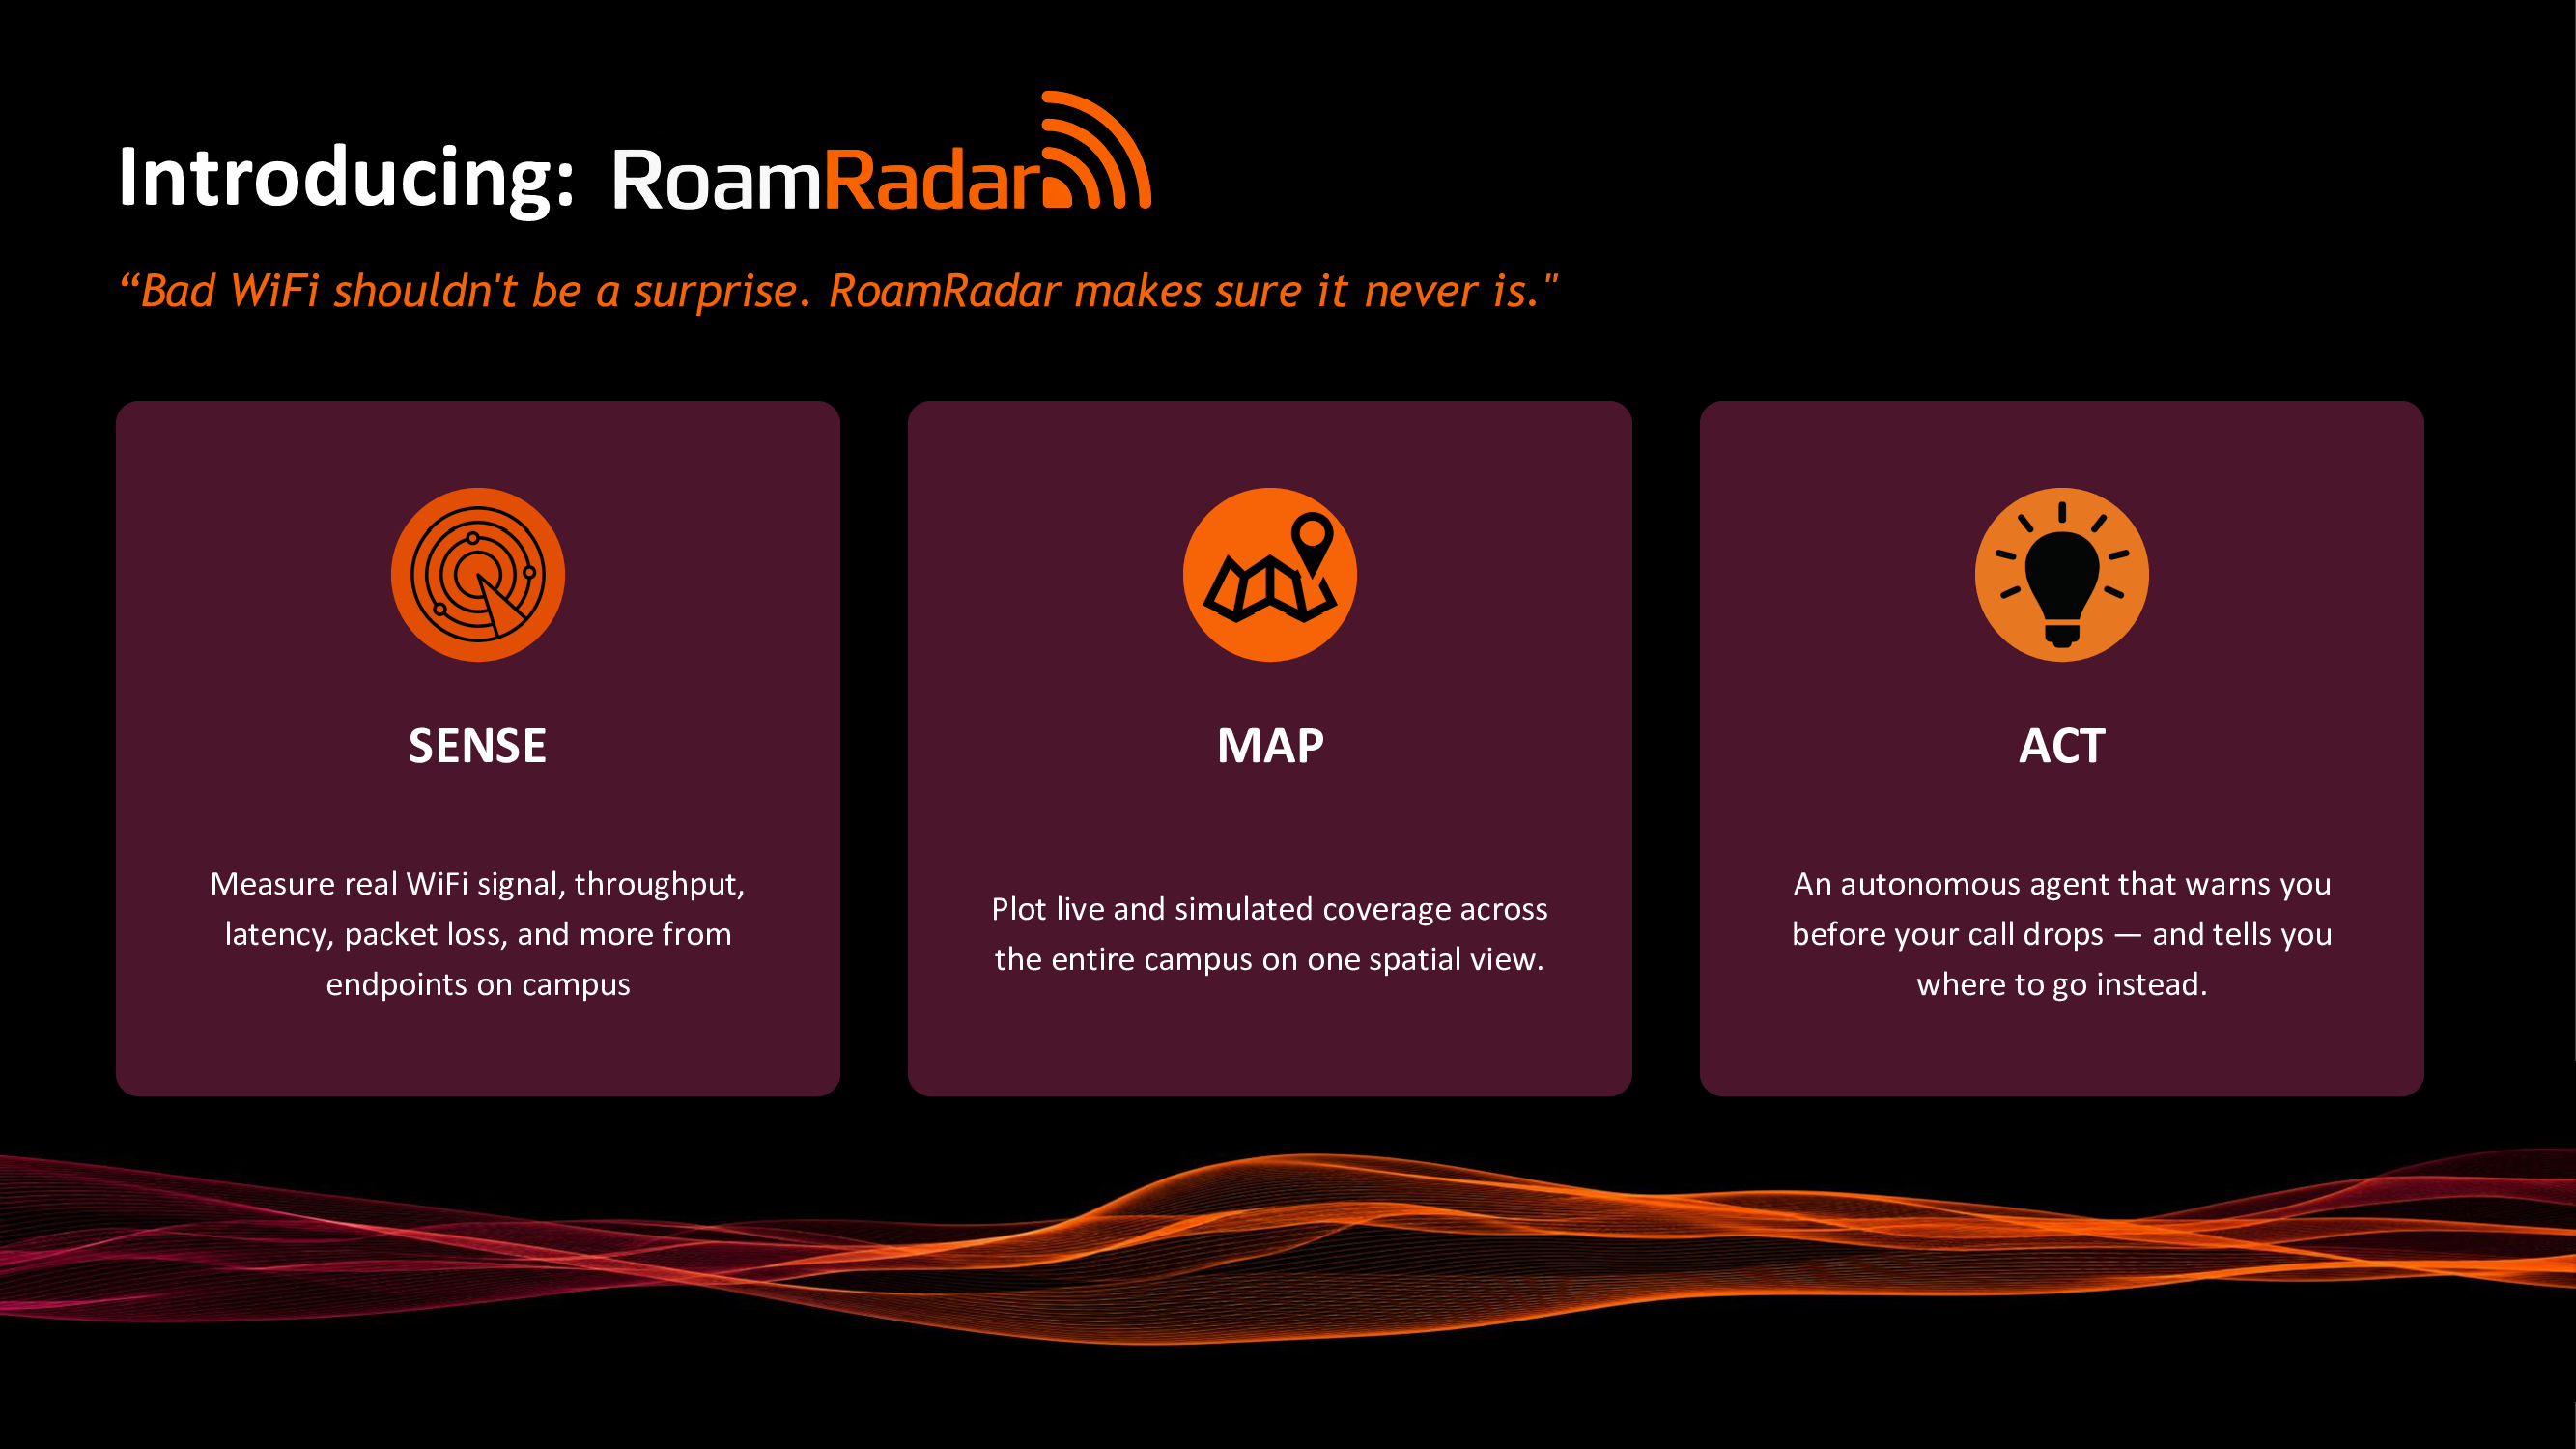
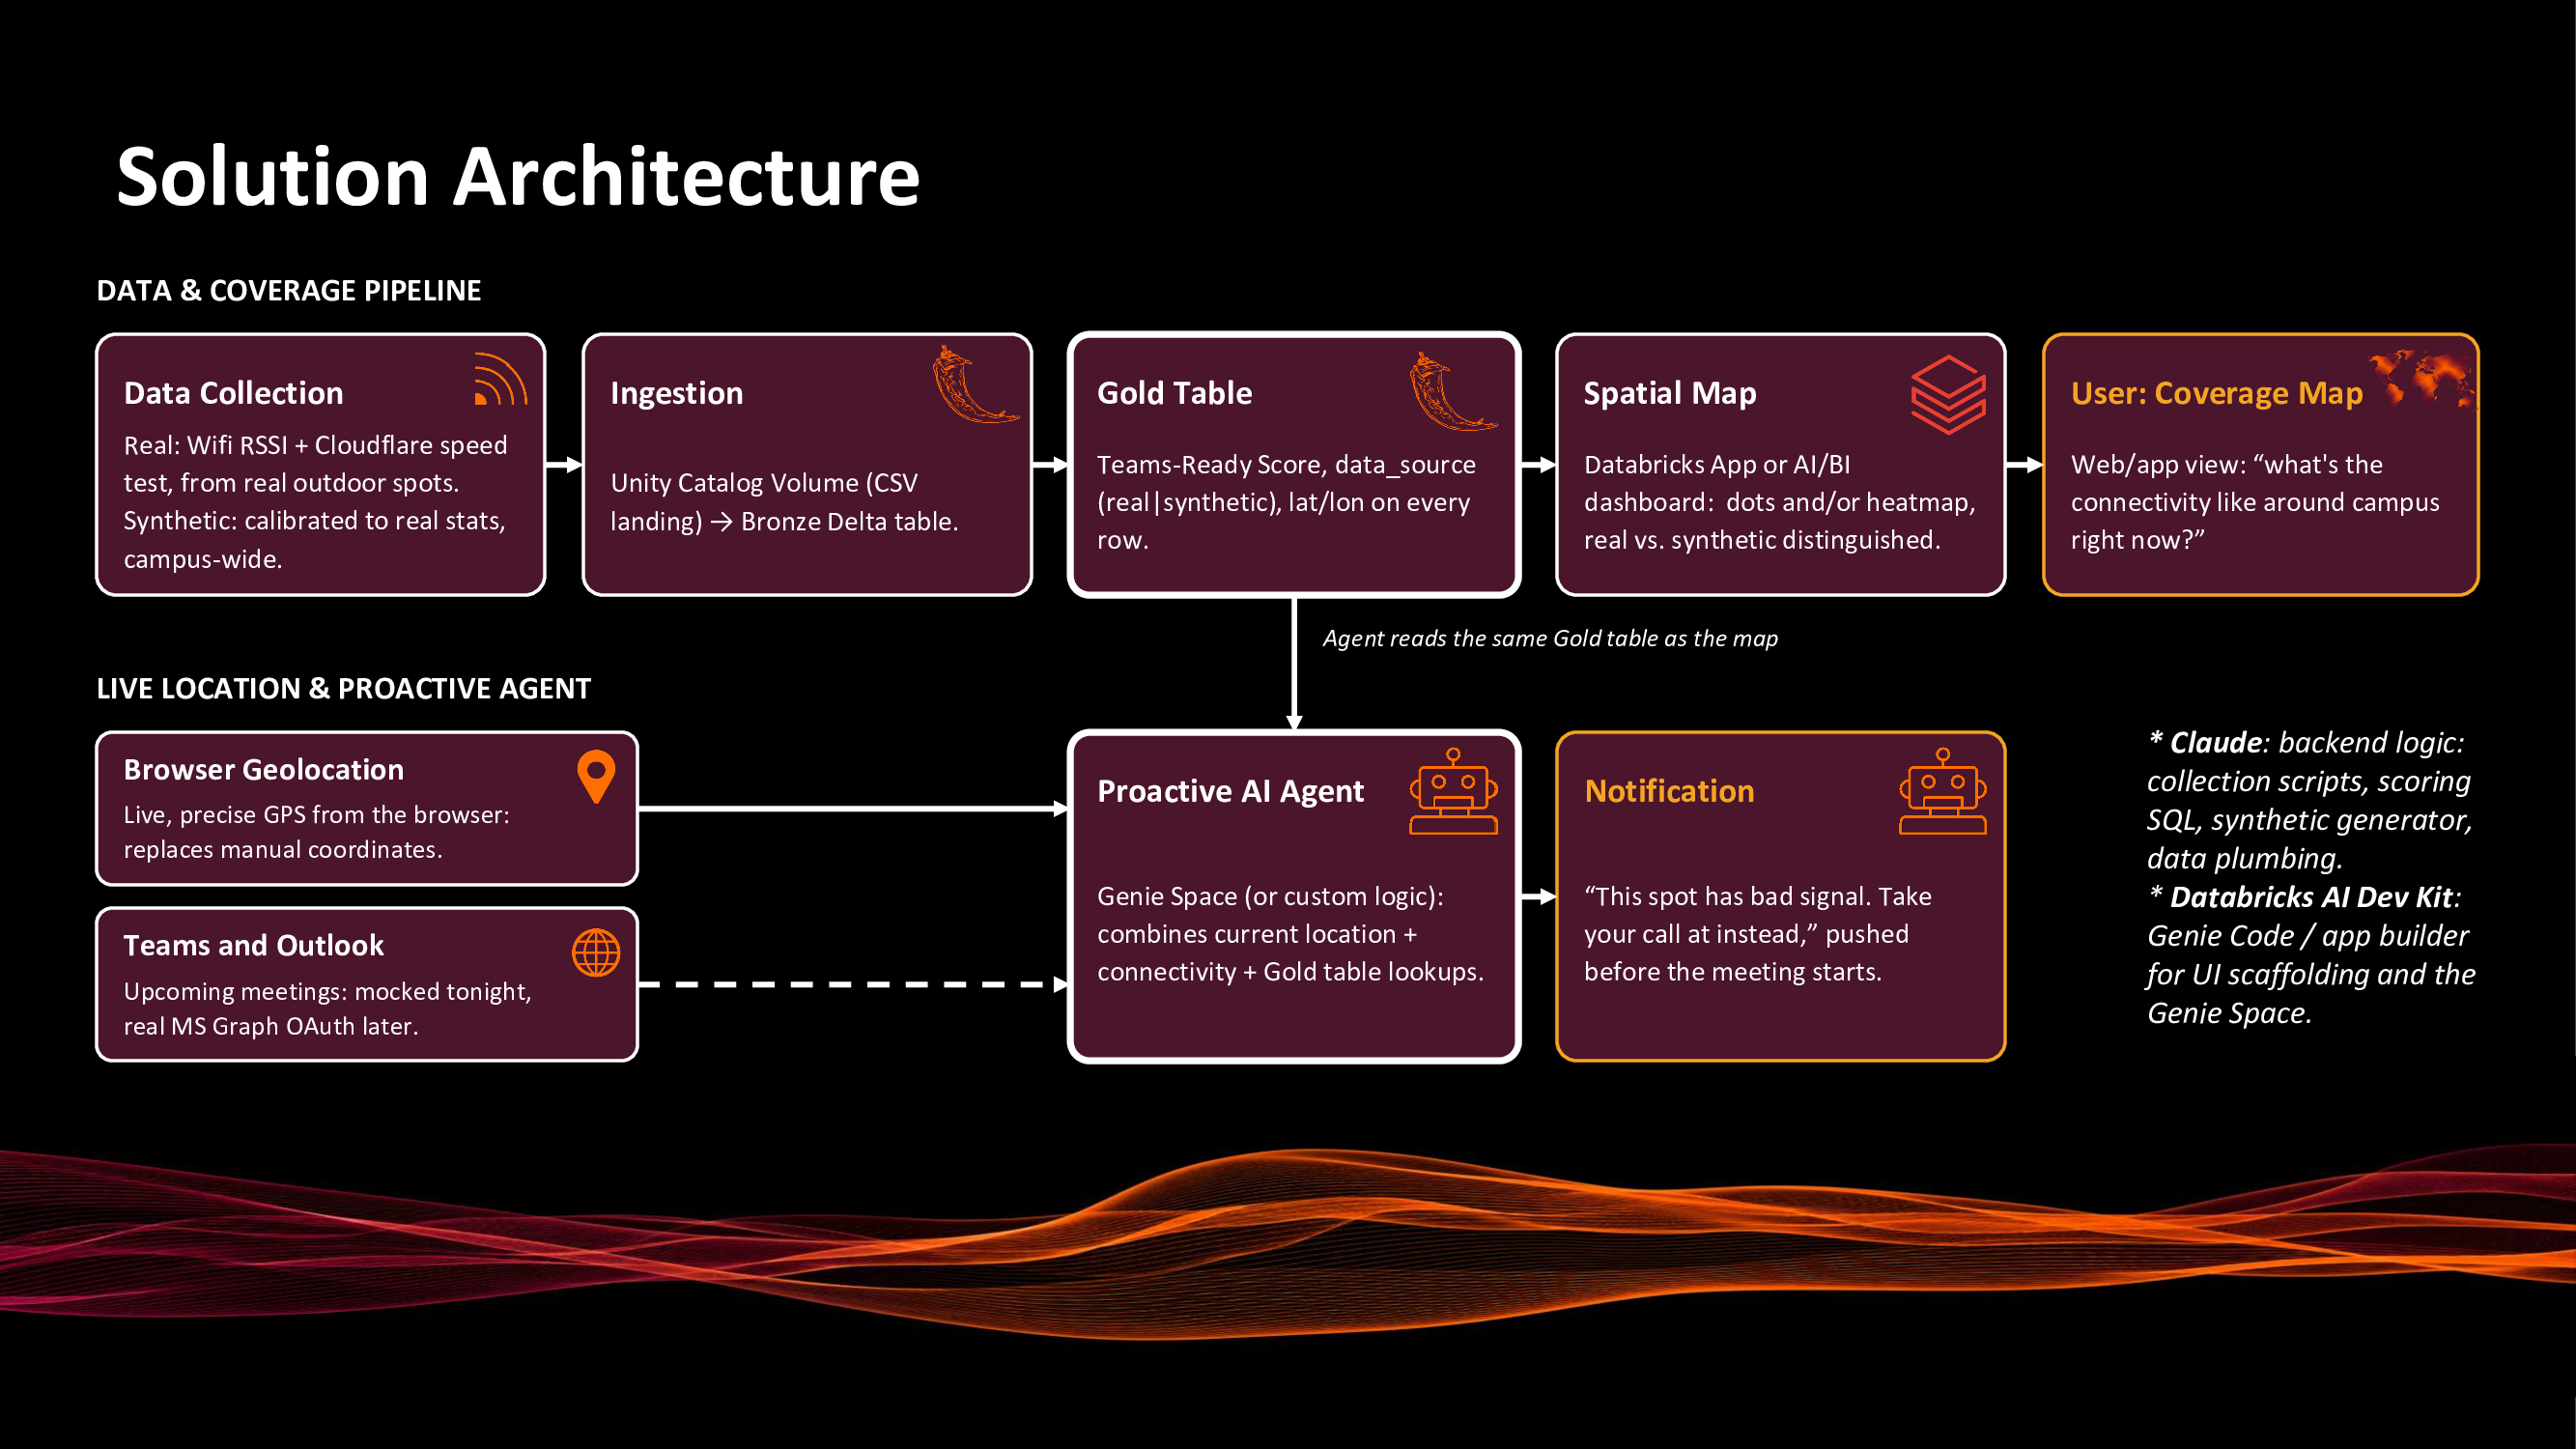
RoamRadar turns real Wi-Fi and network performance data into a live, spatial picture of campus connectivity, then acts on it. It collects real signal strength and throughput readings (via Cloudflare speed-test endpoints and Wi-Fi RSSI) from actual outdoor locations, and extends that into calibrated synthetic coverage across the rest of campus, always clearly labeled real vs. simulated, never blended silently. That data lands on a live map showing where connectivity is strong, moderate, or dead. On top of that sits an autonomous agent: it watches a user's live location (via the browser's Geolocation API) and their upcoming calendar/Teams meetings, and proactively warns them, "this spot has bad signal, take your call at X instead", before a call ever drops, rather than after.
How we built it
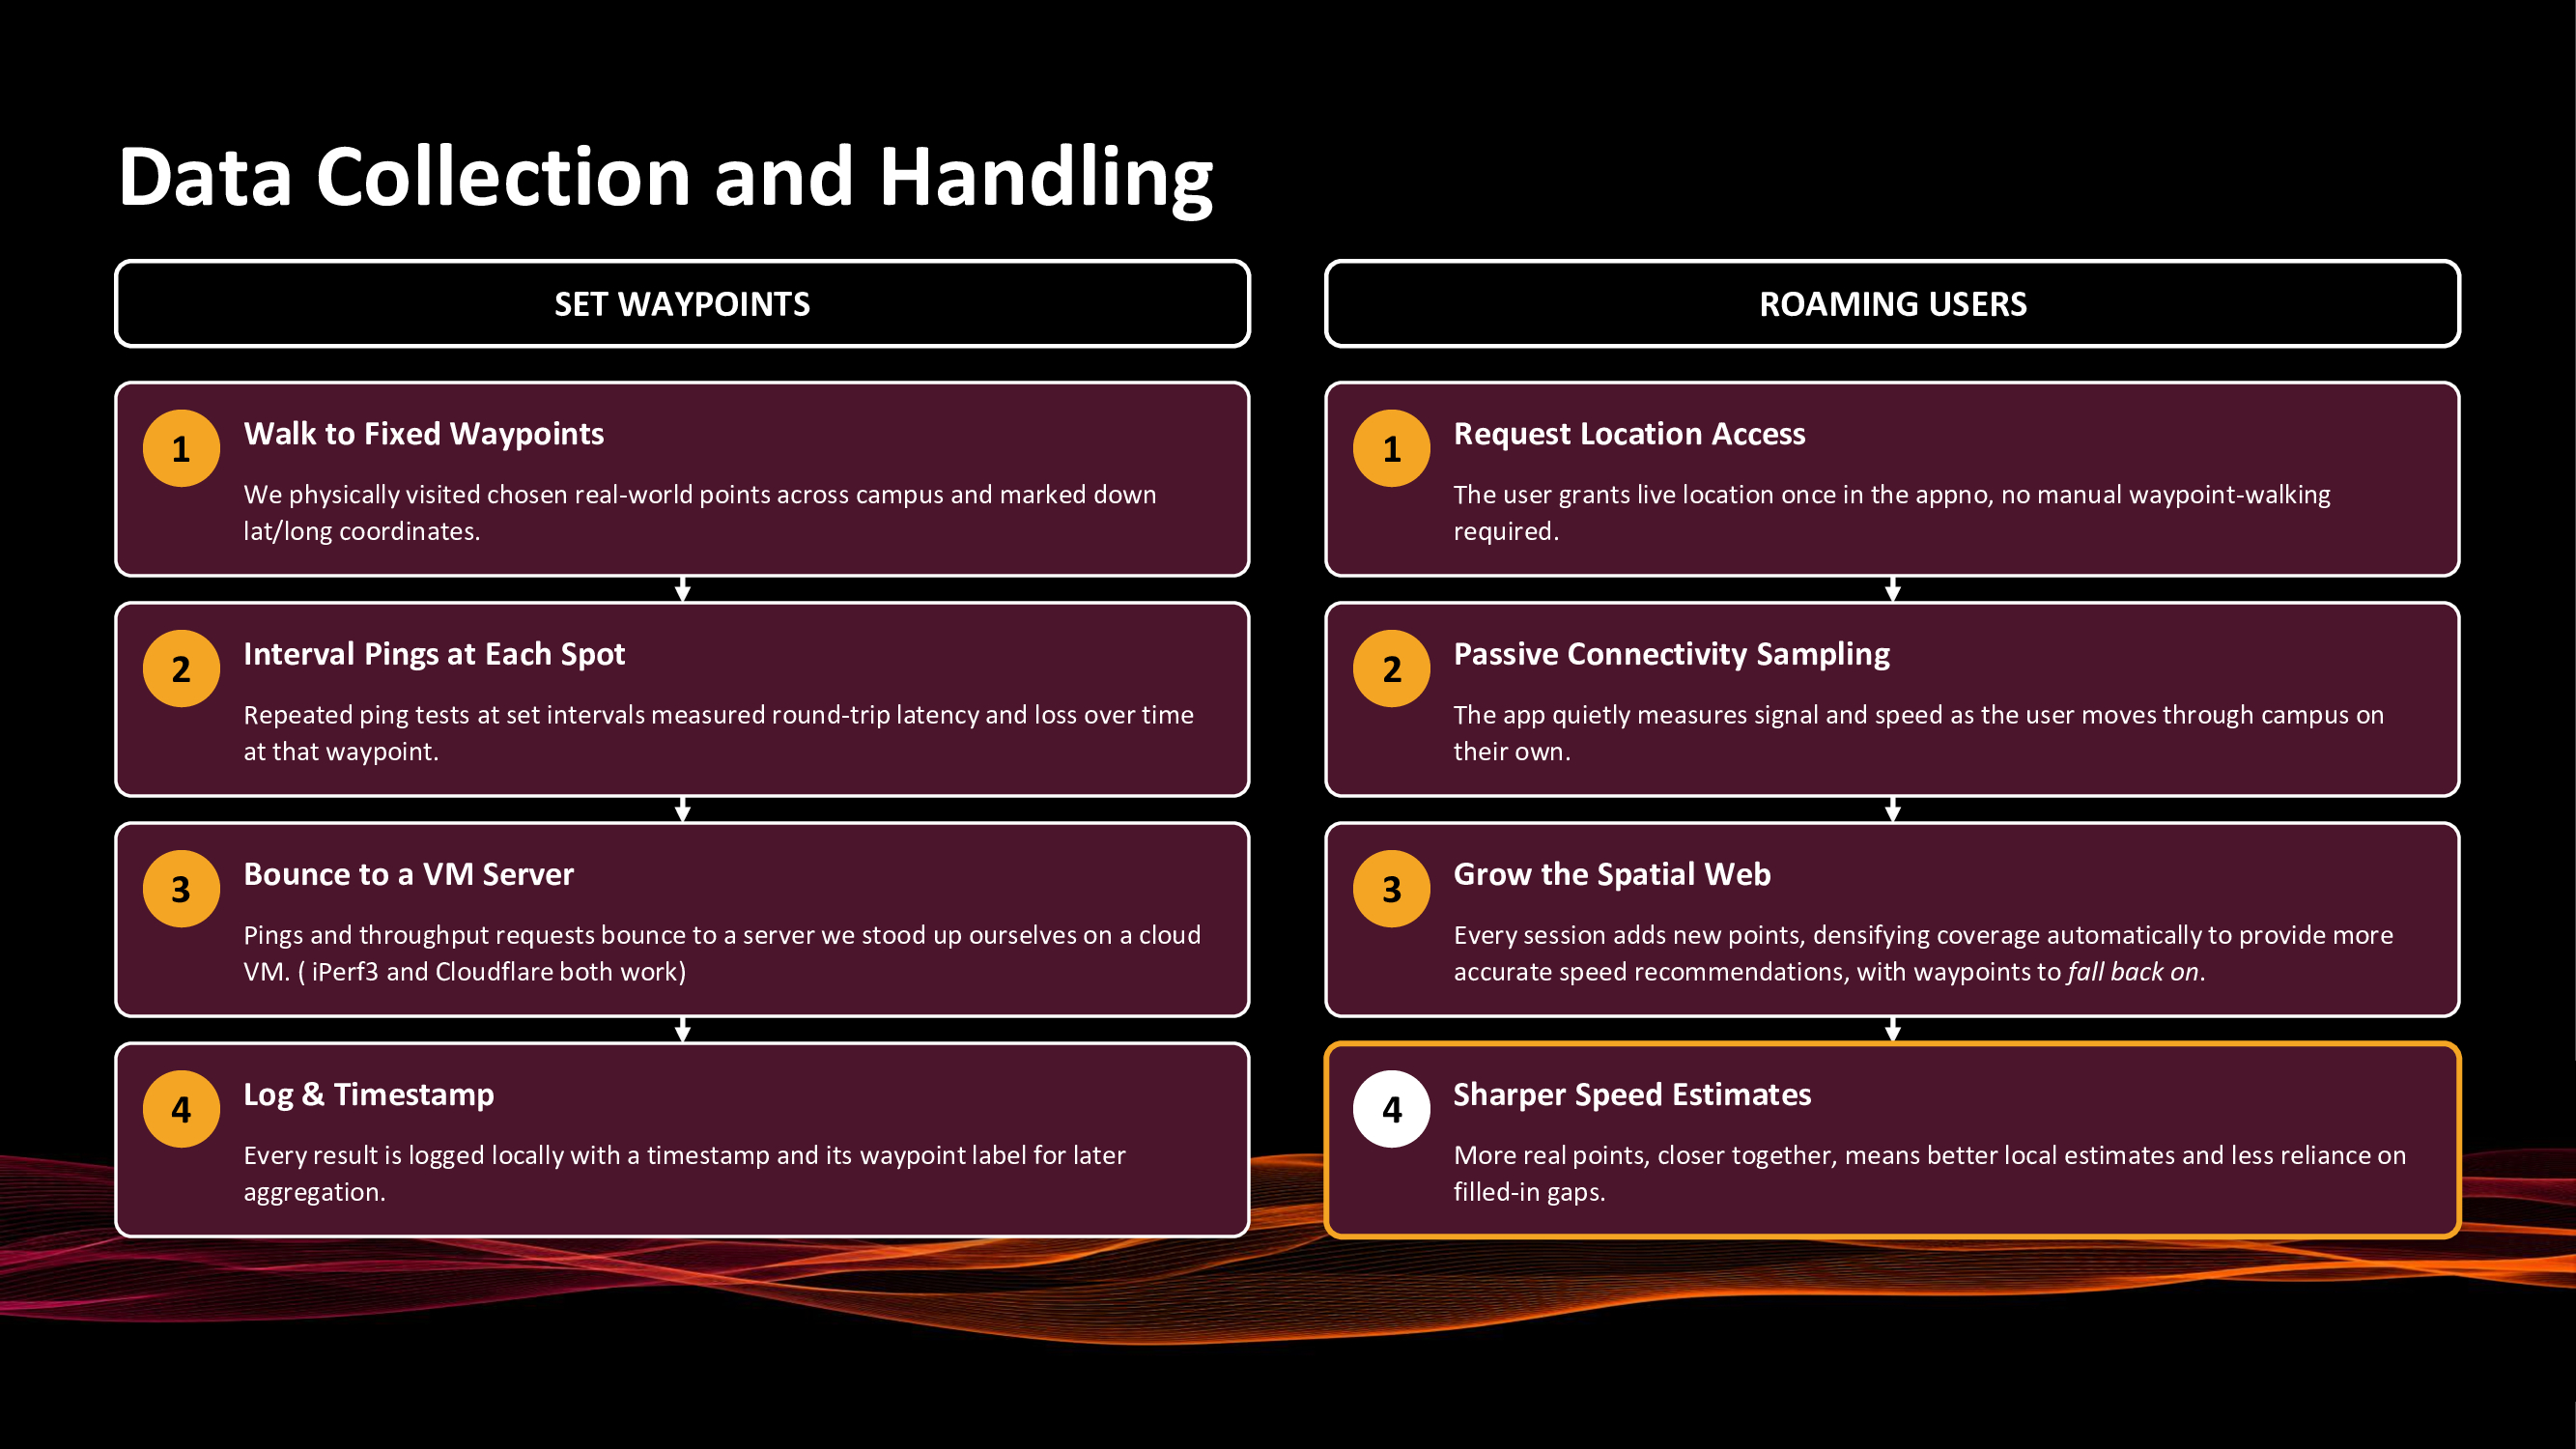
We built a two-speed Wi-Fi/network collector to gather real signal, latency, jitter, and throughput data from outdoor campus locations, feeding it into a Databricks Lakehouse pipeline (Volume → Bronze Delta table → Gold table) that computes a Teams-readiness score for every point. A synthetic data generator calibrates simulated readings to the real data's statistical distribution so the rest of campus can be shown at scale without pretending it's measured. On top of the Gold table, we built a spatial map (Databricks App / AI-BI dashboard) and an agent path that combines live GPS with a calendar feed to trigger proactive location recommendations. We split the work deliberately: our own logic handled the data pipeline and scoring, while Databricks' own AI tooling (Genie, the app builder) handled UI scaffolding and natural-language querying, since it understands the platform's primitives better than a general-purpose approach would.
Challenges we ran into
Scoping was our first real challenge as we started with an indoor, floor-by-floor plan before Databricks engineer, Phil Tsoi, convinced us to pivot to outdoor-only, 2D lat/long, which was the right call but cost us hours of rework. GPS accuracy was messier than expected: manually logging coordinates per location doesn't scale, which pushed us toward the browser's native Geolocation API for the live app. We also hit real Databricks pipeline bugs. Midway through we also dropped our original iPerf3 test in favor of an HTTP-based Cloudflare speed test.
Accomplishments that we're proud of
We're proud that every number in RoamRadar is honest and that every row is tagged real or synthetic. Even when under pressure to make the map look more complete than the data supports. We're also proud we got a genuinely full pipeline working end to end in under 36 hours: real collection, a Databricks Lakehouse, a live map, and a working proactive agent concept.
What we learned
We learned that scoping ruthlessly matters more than adding features as the outdoor-only pivot felt like a step back in ambition but was the reason we had a working demo at all. We learned a lot about Databricks itself: Unity Catalog, Delta tables, and how Genie and AI/BI tooling can take real weight off a small team's UI work. We learned that most of the hard part isn't building an agent, it's being disciplined about what data you actually trust.
What's next for RoamRadar
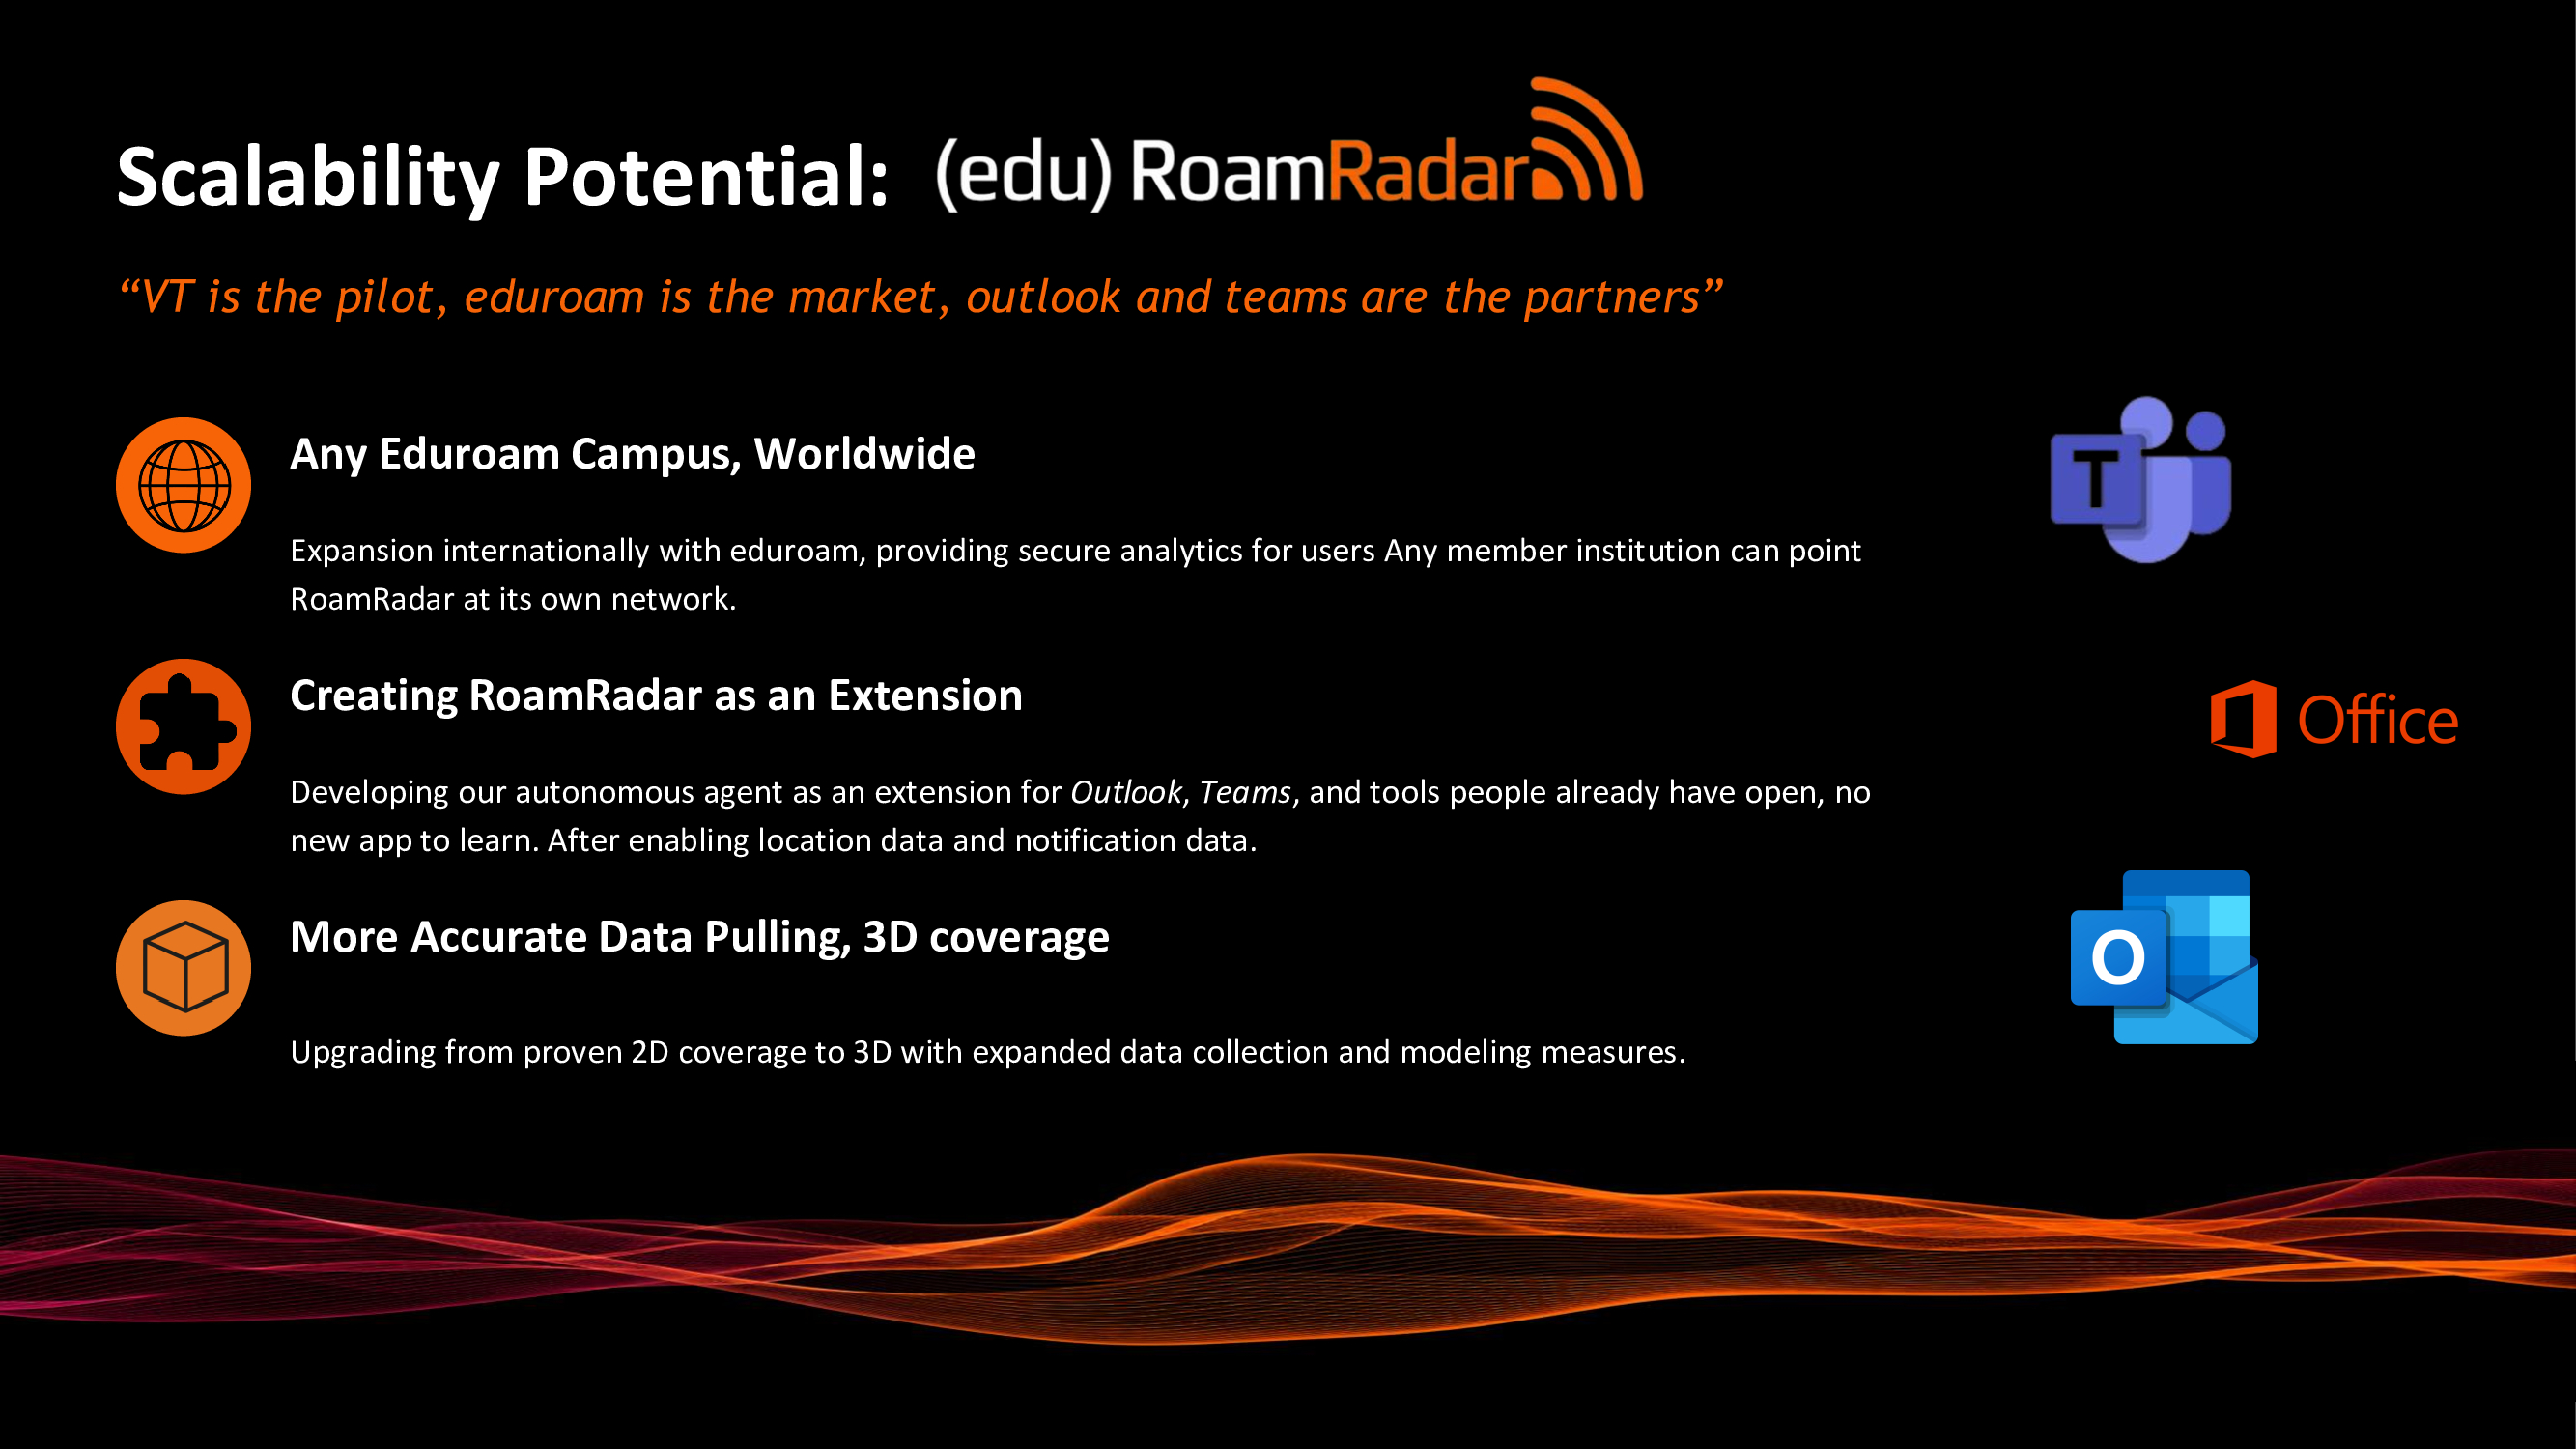
Next is replacing synthetic coverage with 100% real data, building by building, and connecting to the real Microsoft Graph API so the agent reads an actual Outlook/Teams calendar instead of a mocked one. Beyond that: ingesting VT IT's actual network controller telemetry instead of walking data, extending indoors and adding elevation now that the outdoor 2D version is proven, and, since this is built on the eduroam standard rather than anything VT-specific, taking RoamRadar to any other eduroam-connected campus around the world.
Built With
- claude
- cloudflare
- css
- csv
- databricks
- delta-lake
- genie
- geolocation-api
- github
- google-maps
- html
- javascript
- microsoft-graph-api
- mlflow
- netsh
- openstreetmap
- pandas
- plotly
- pyspark
- python
- sql
- streamlit
- unity-catalog
- vs-code

Log in or sign up for Devpost to join the conversation.