-
-

-
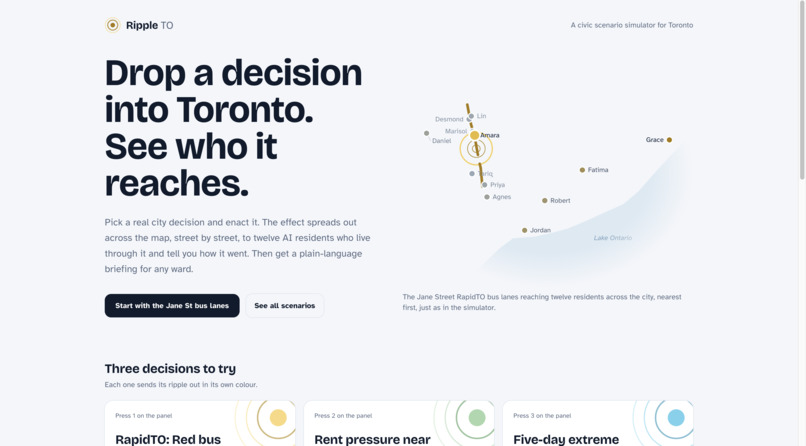
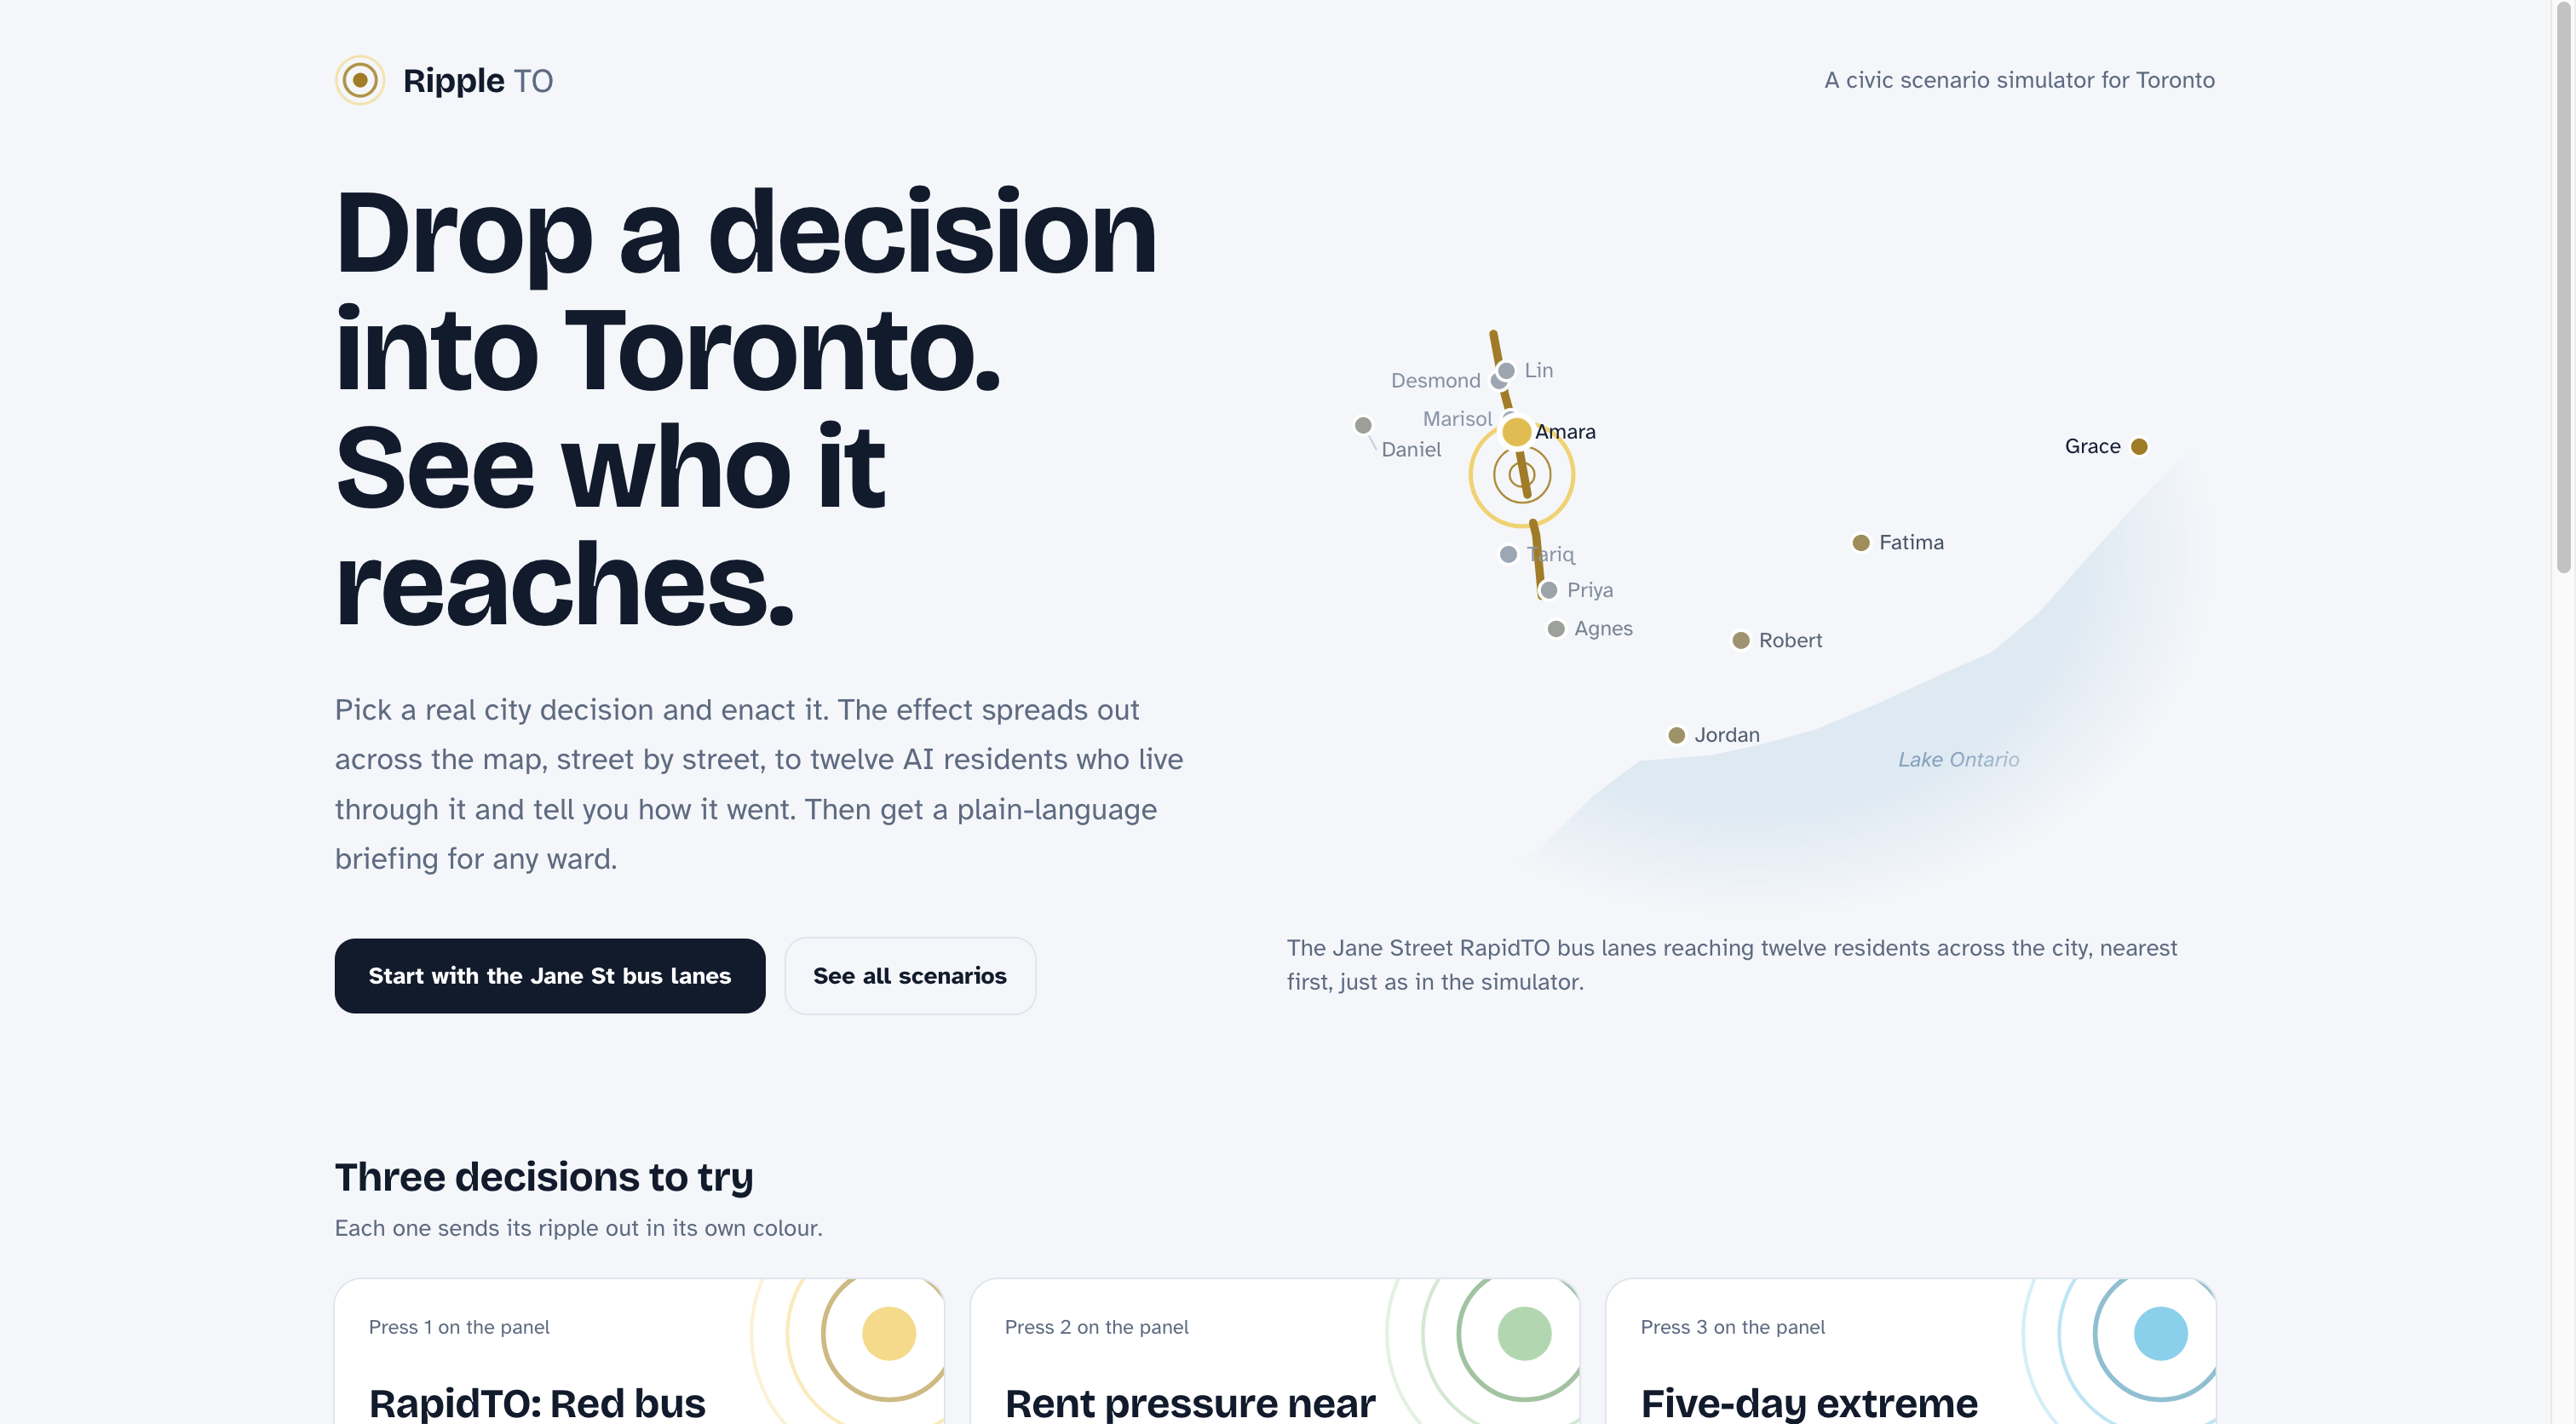
Main screen
-
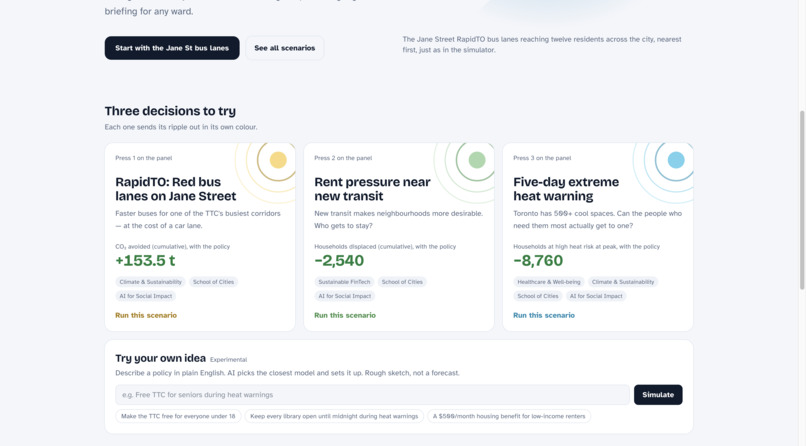
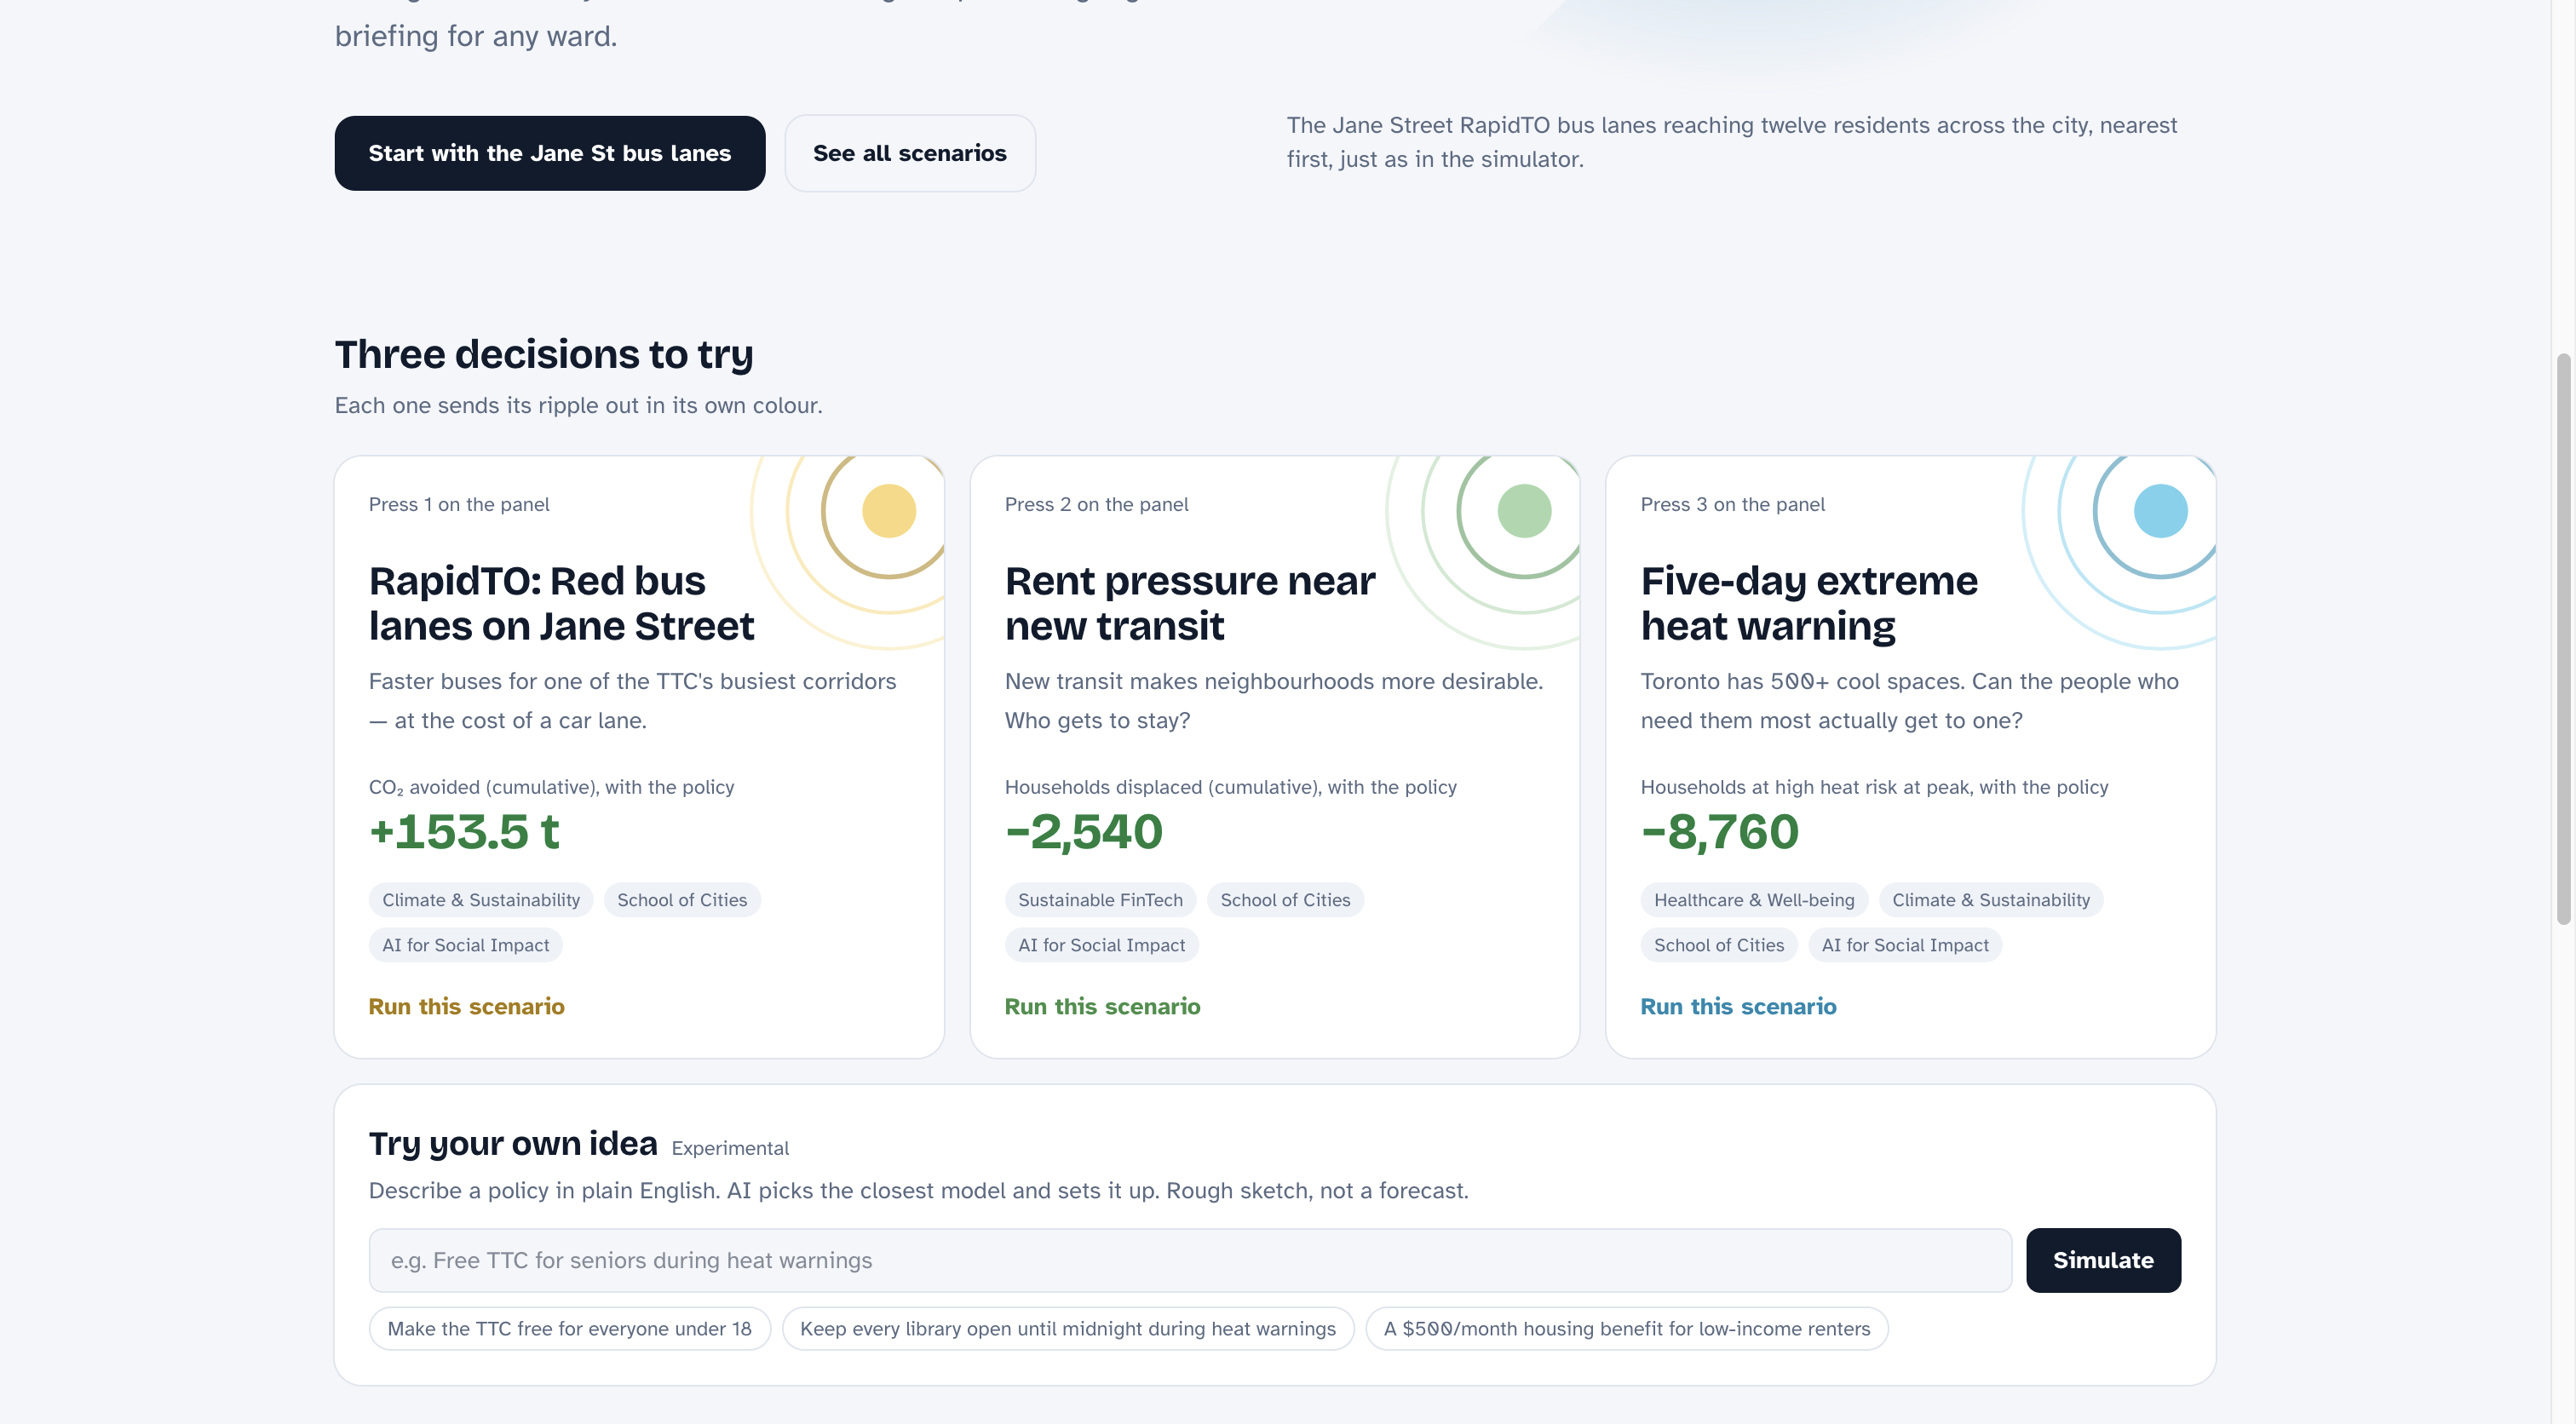
Different scenarios and prompt to add your own
-
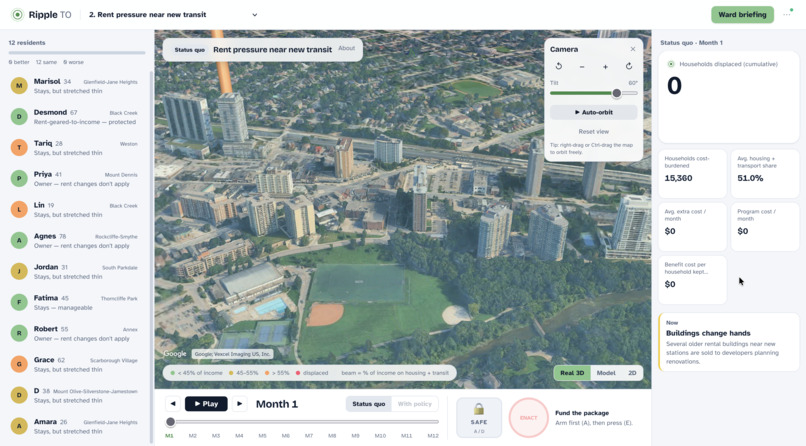
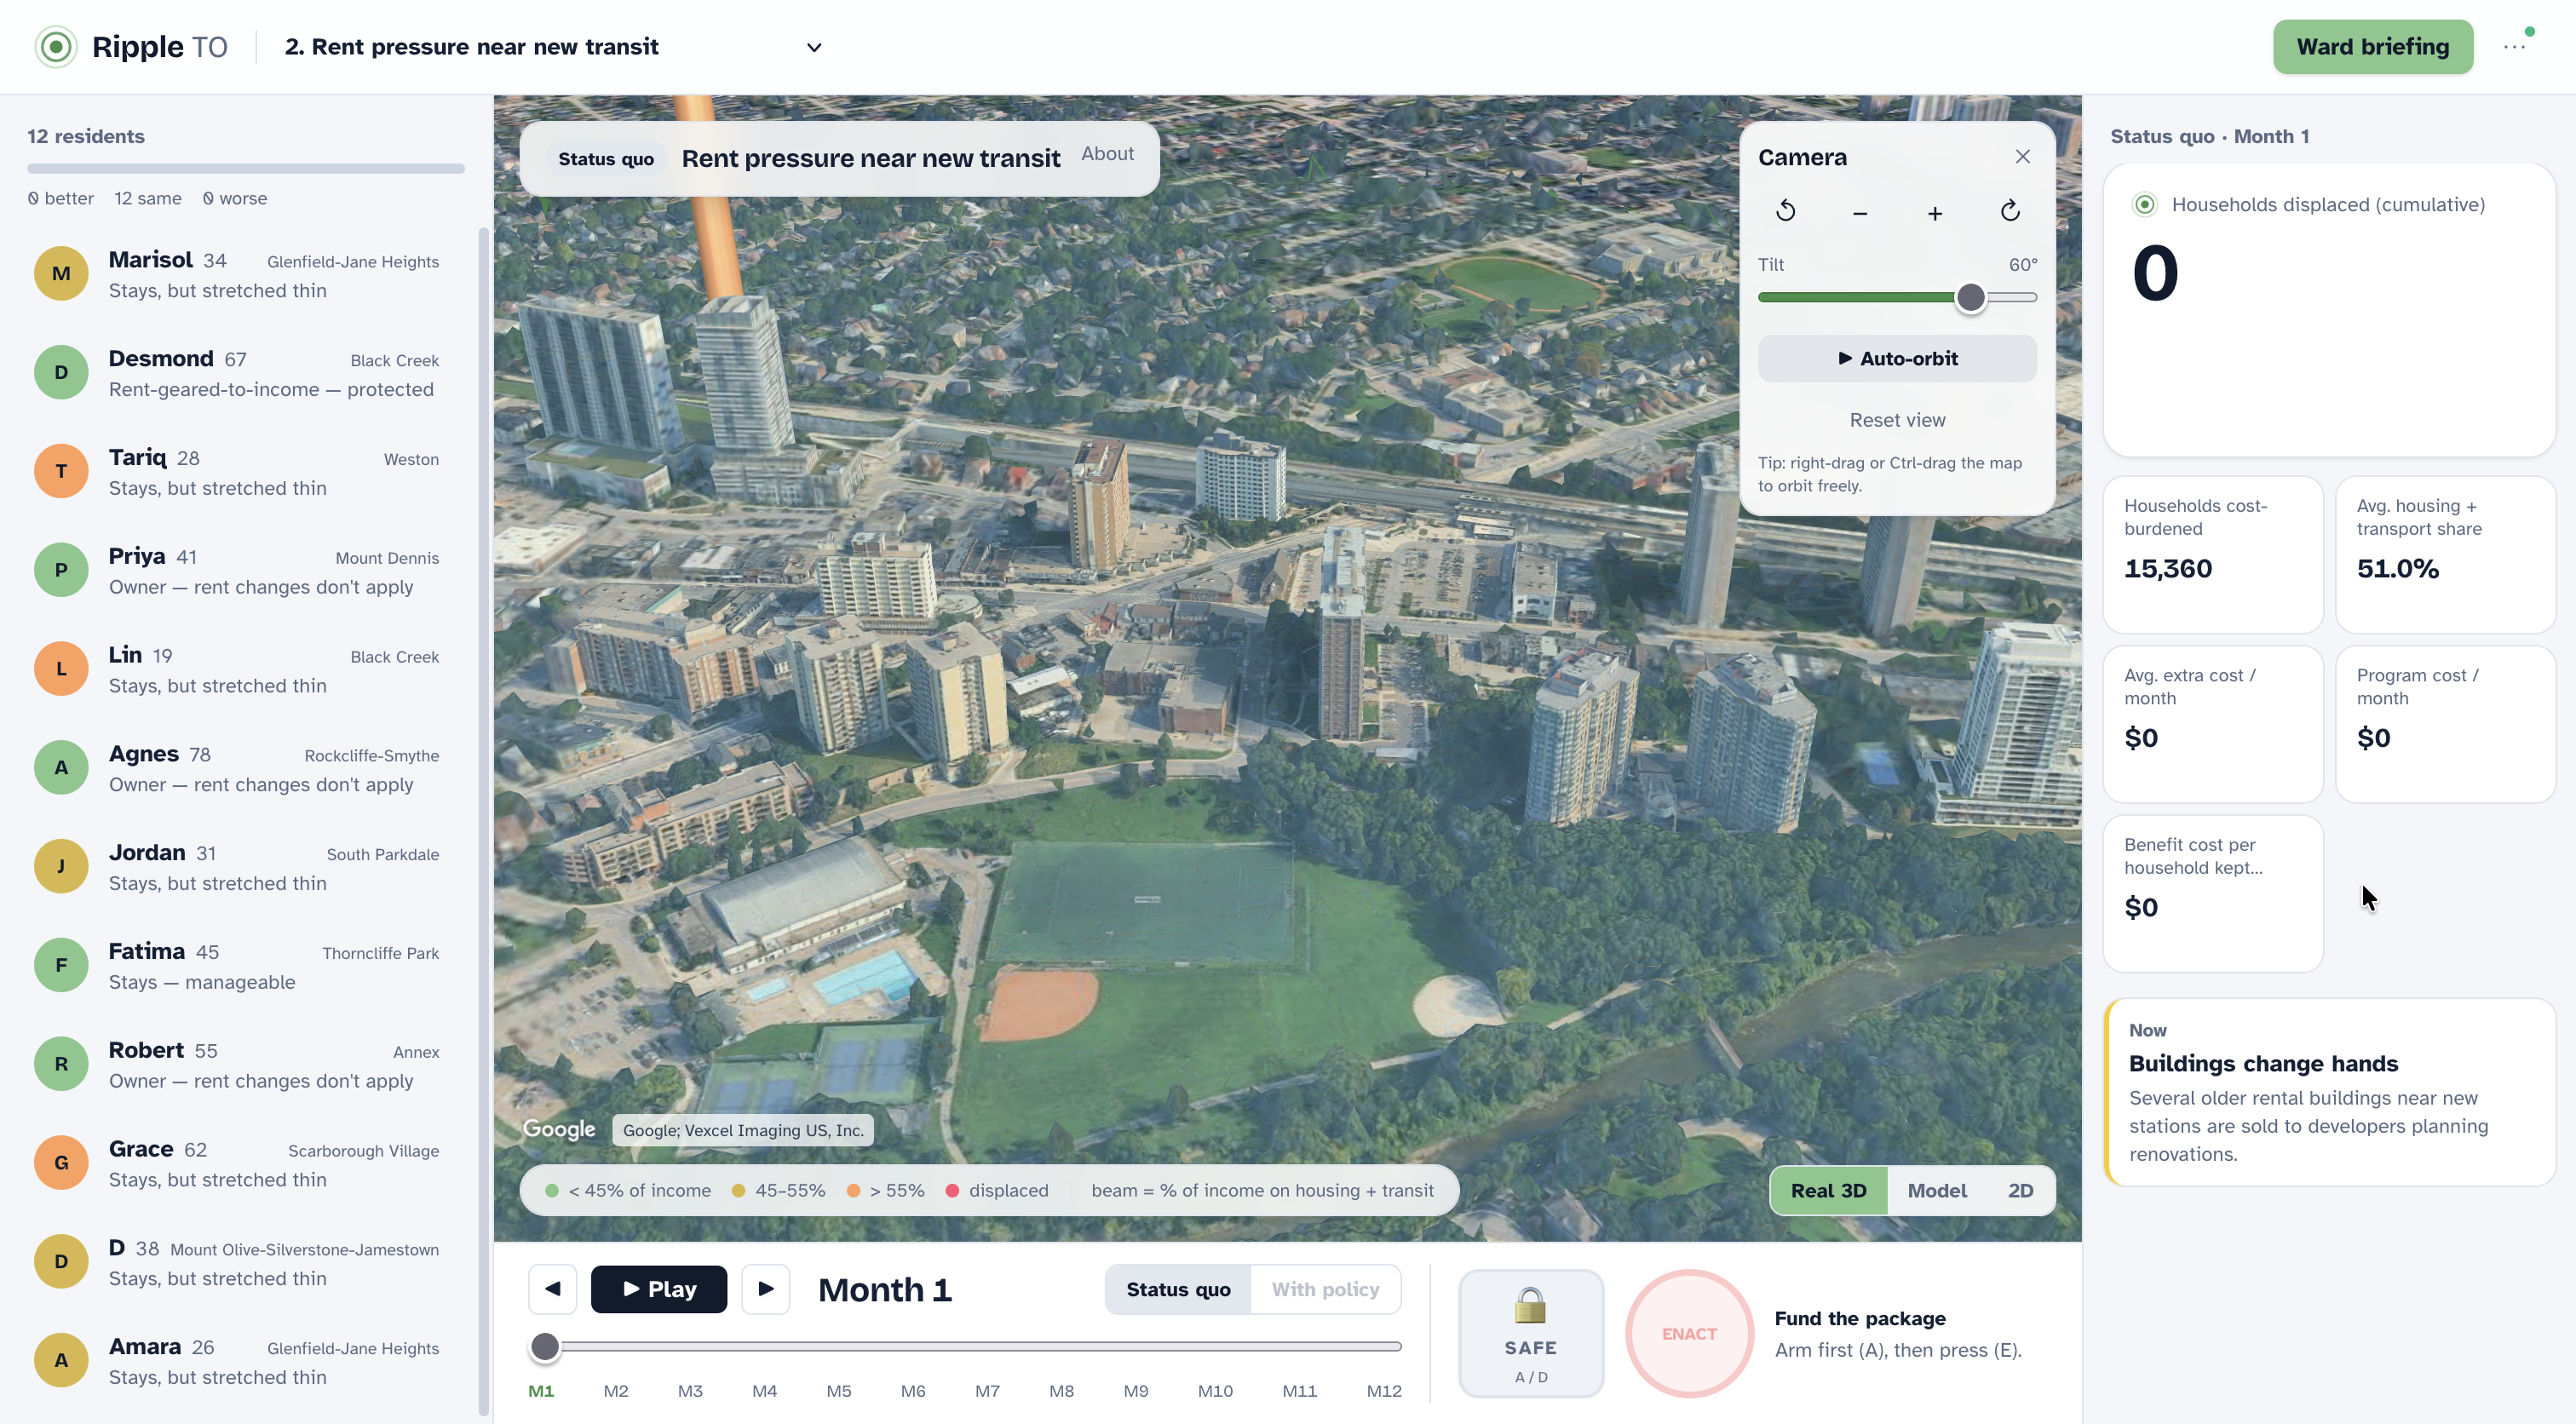
3D Map of Toronto with 12 profiles
-
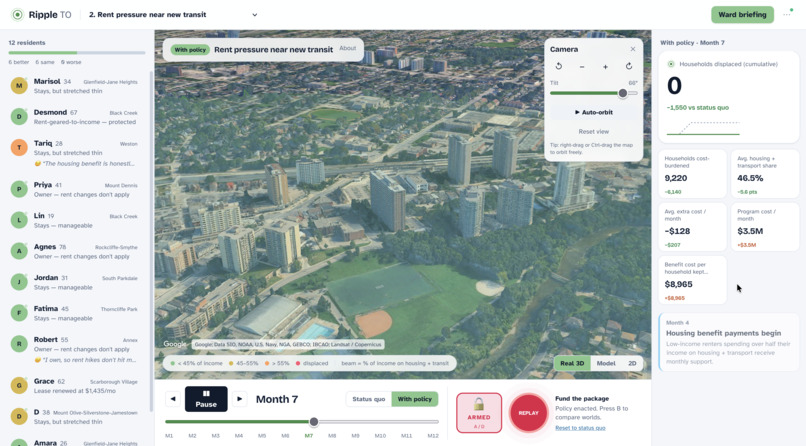
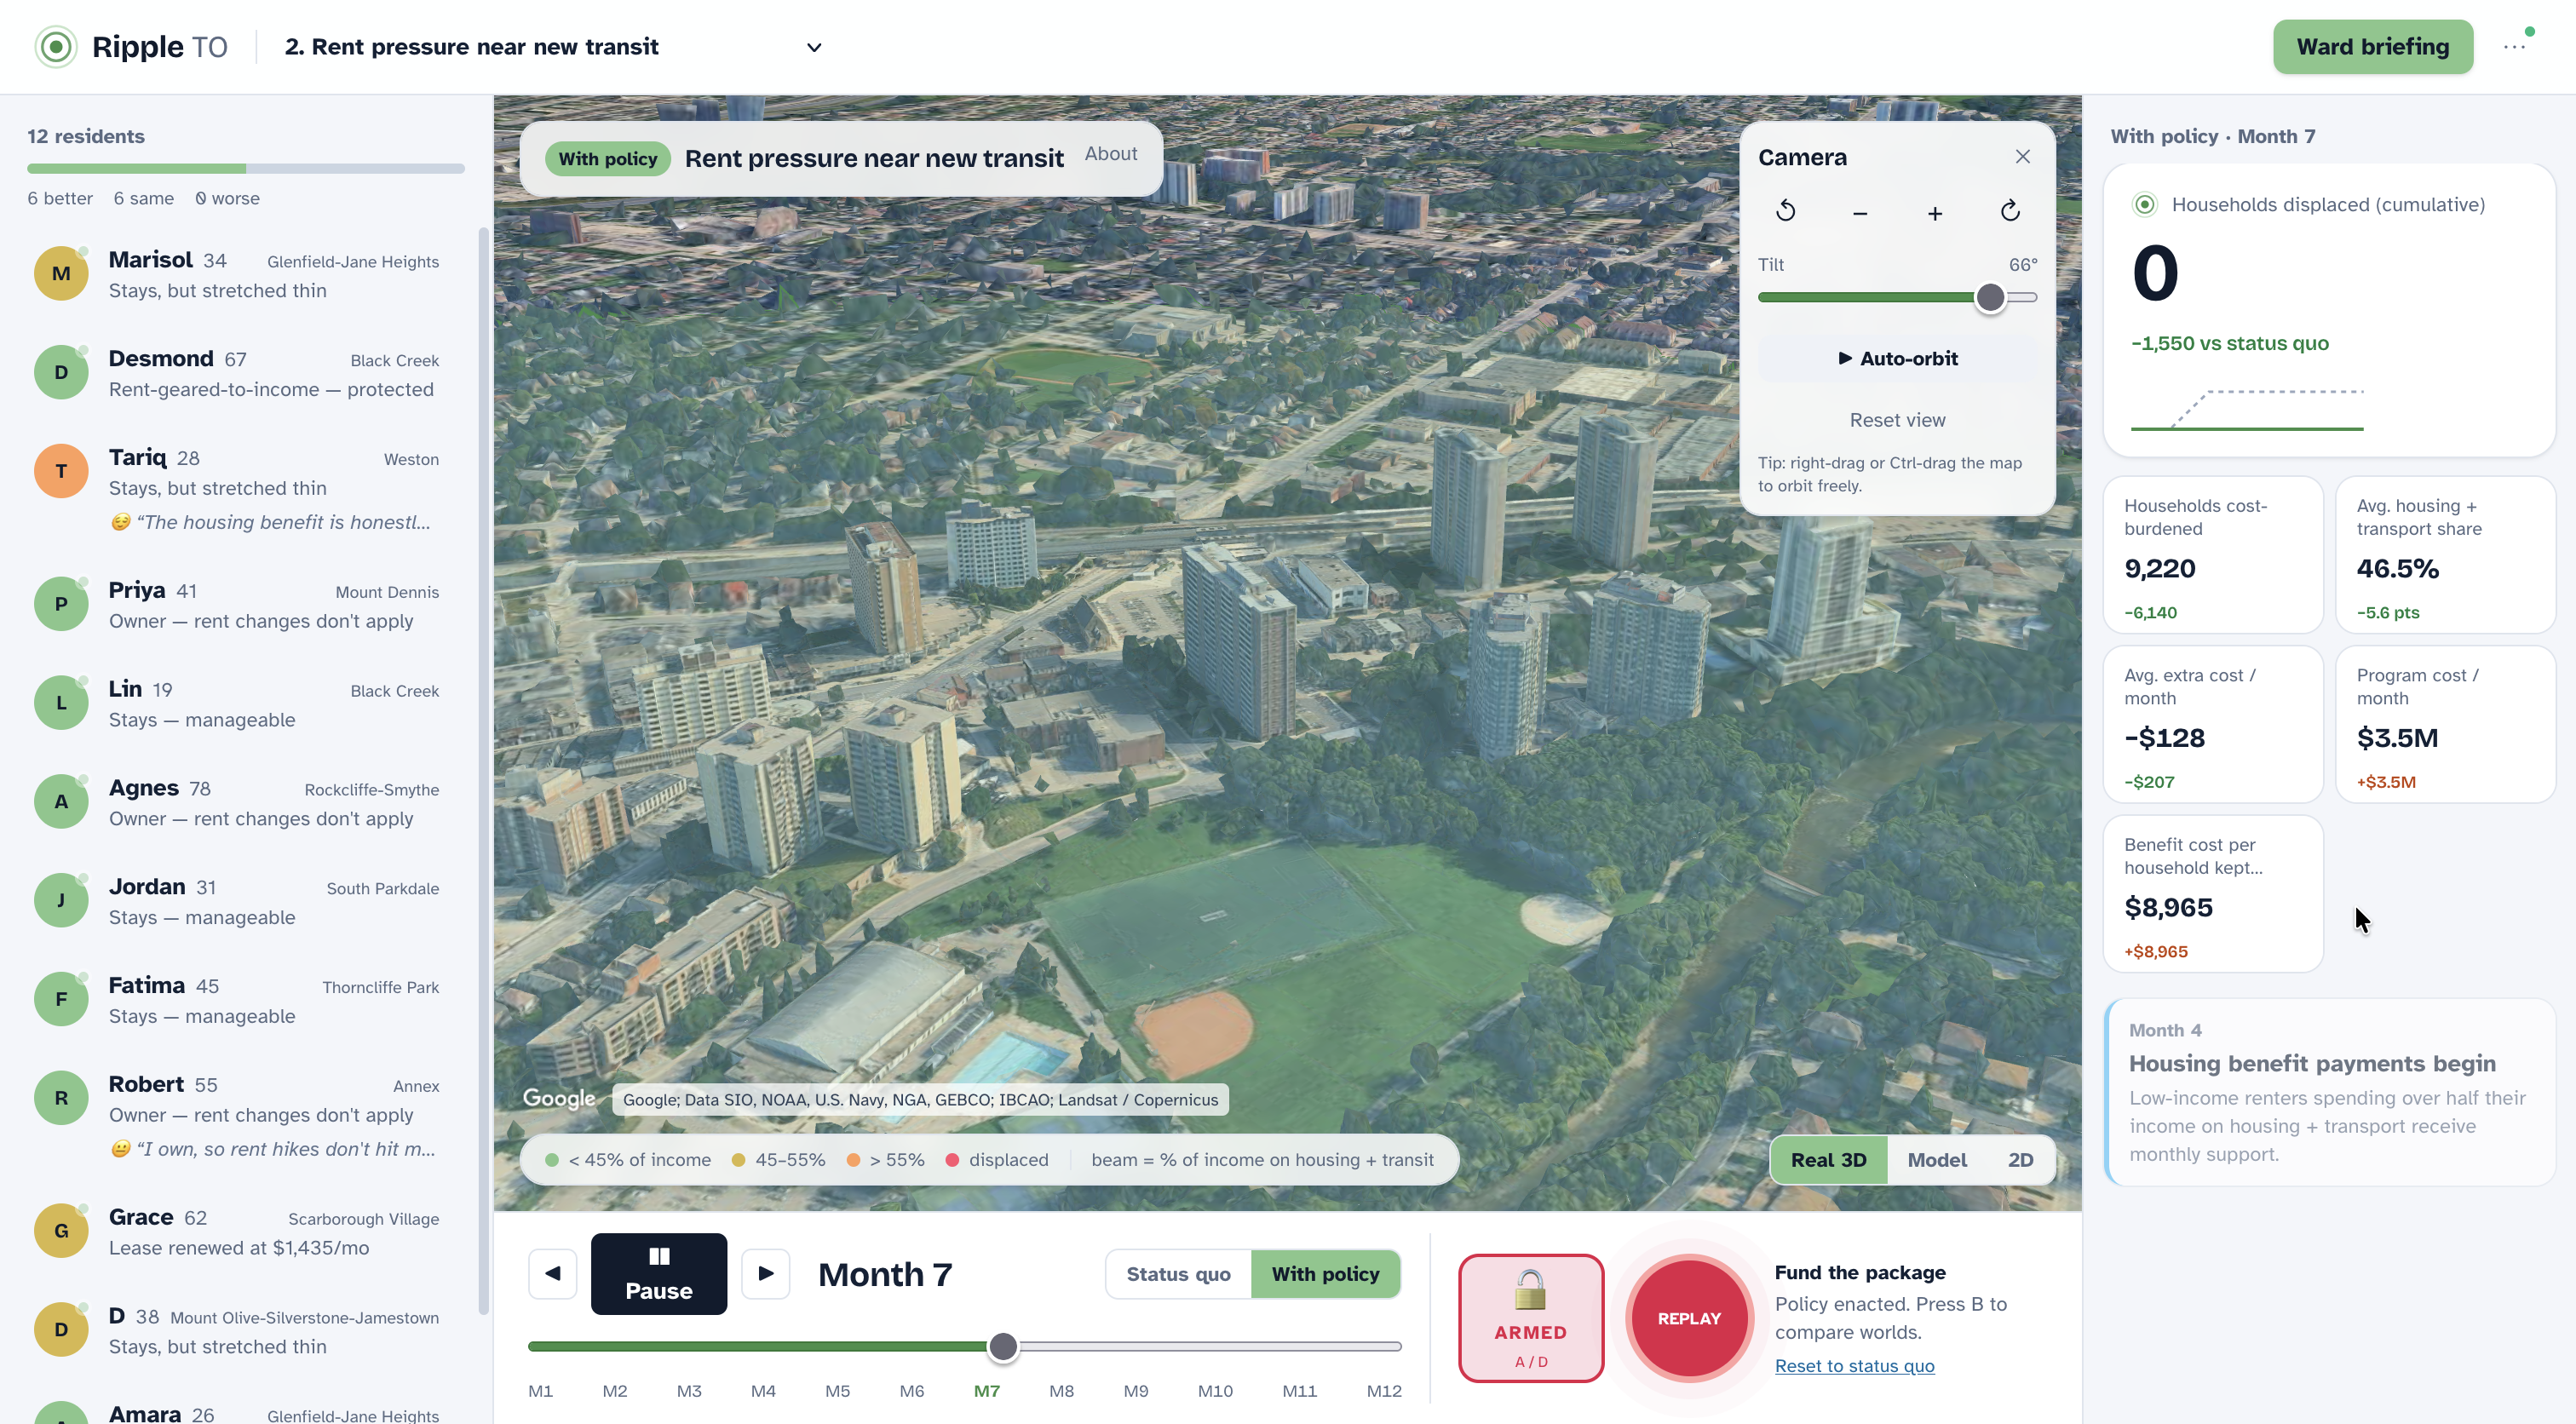
Enacted 3D Map of Toronto with 12 profiles
-
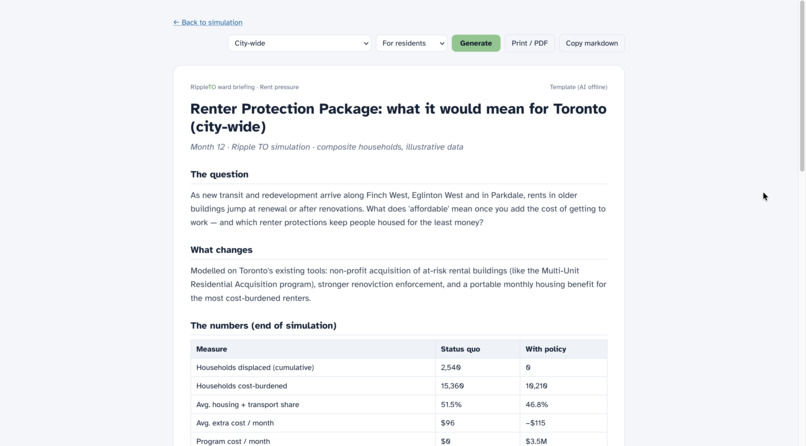
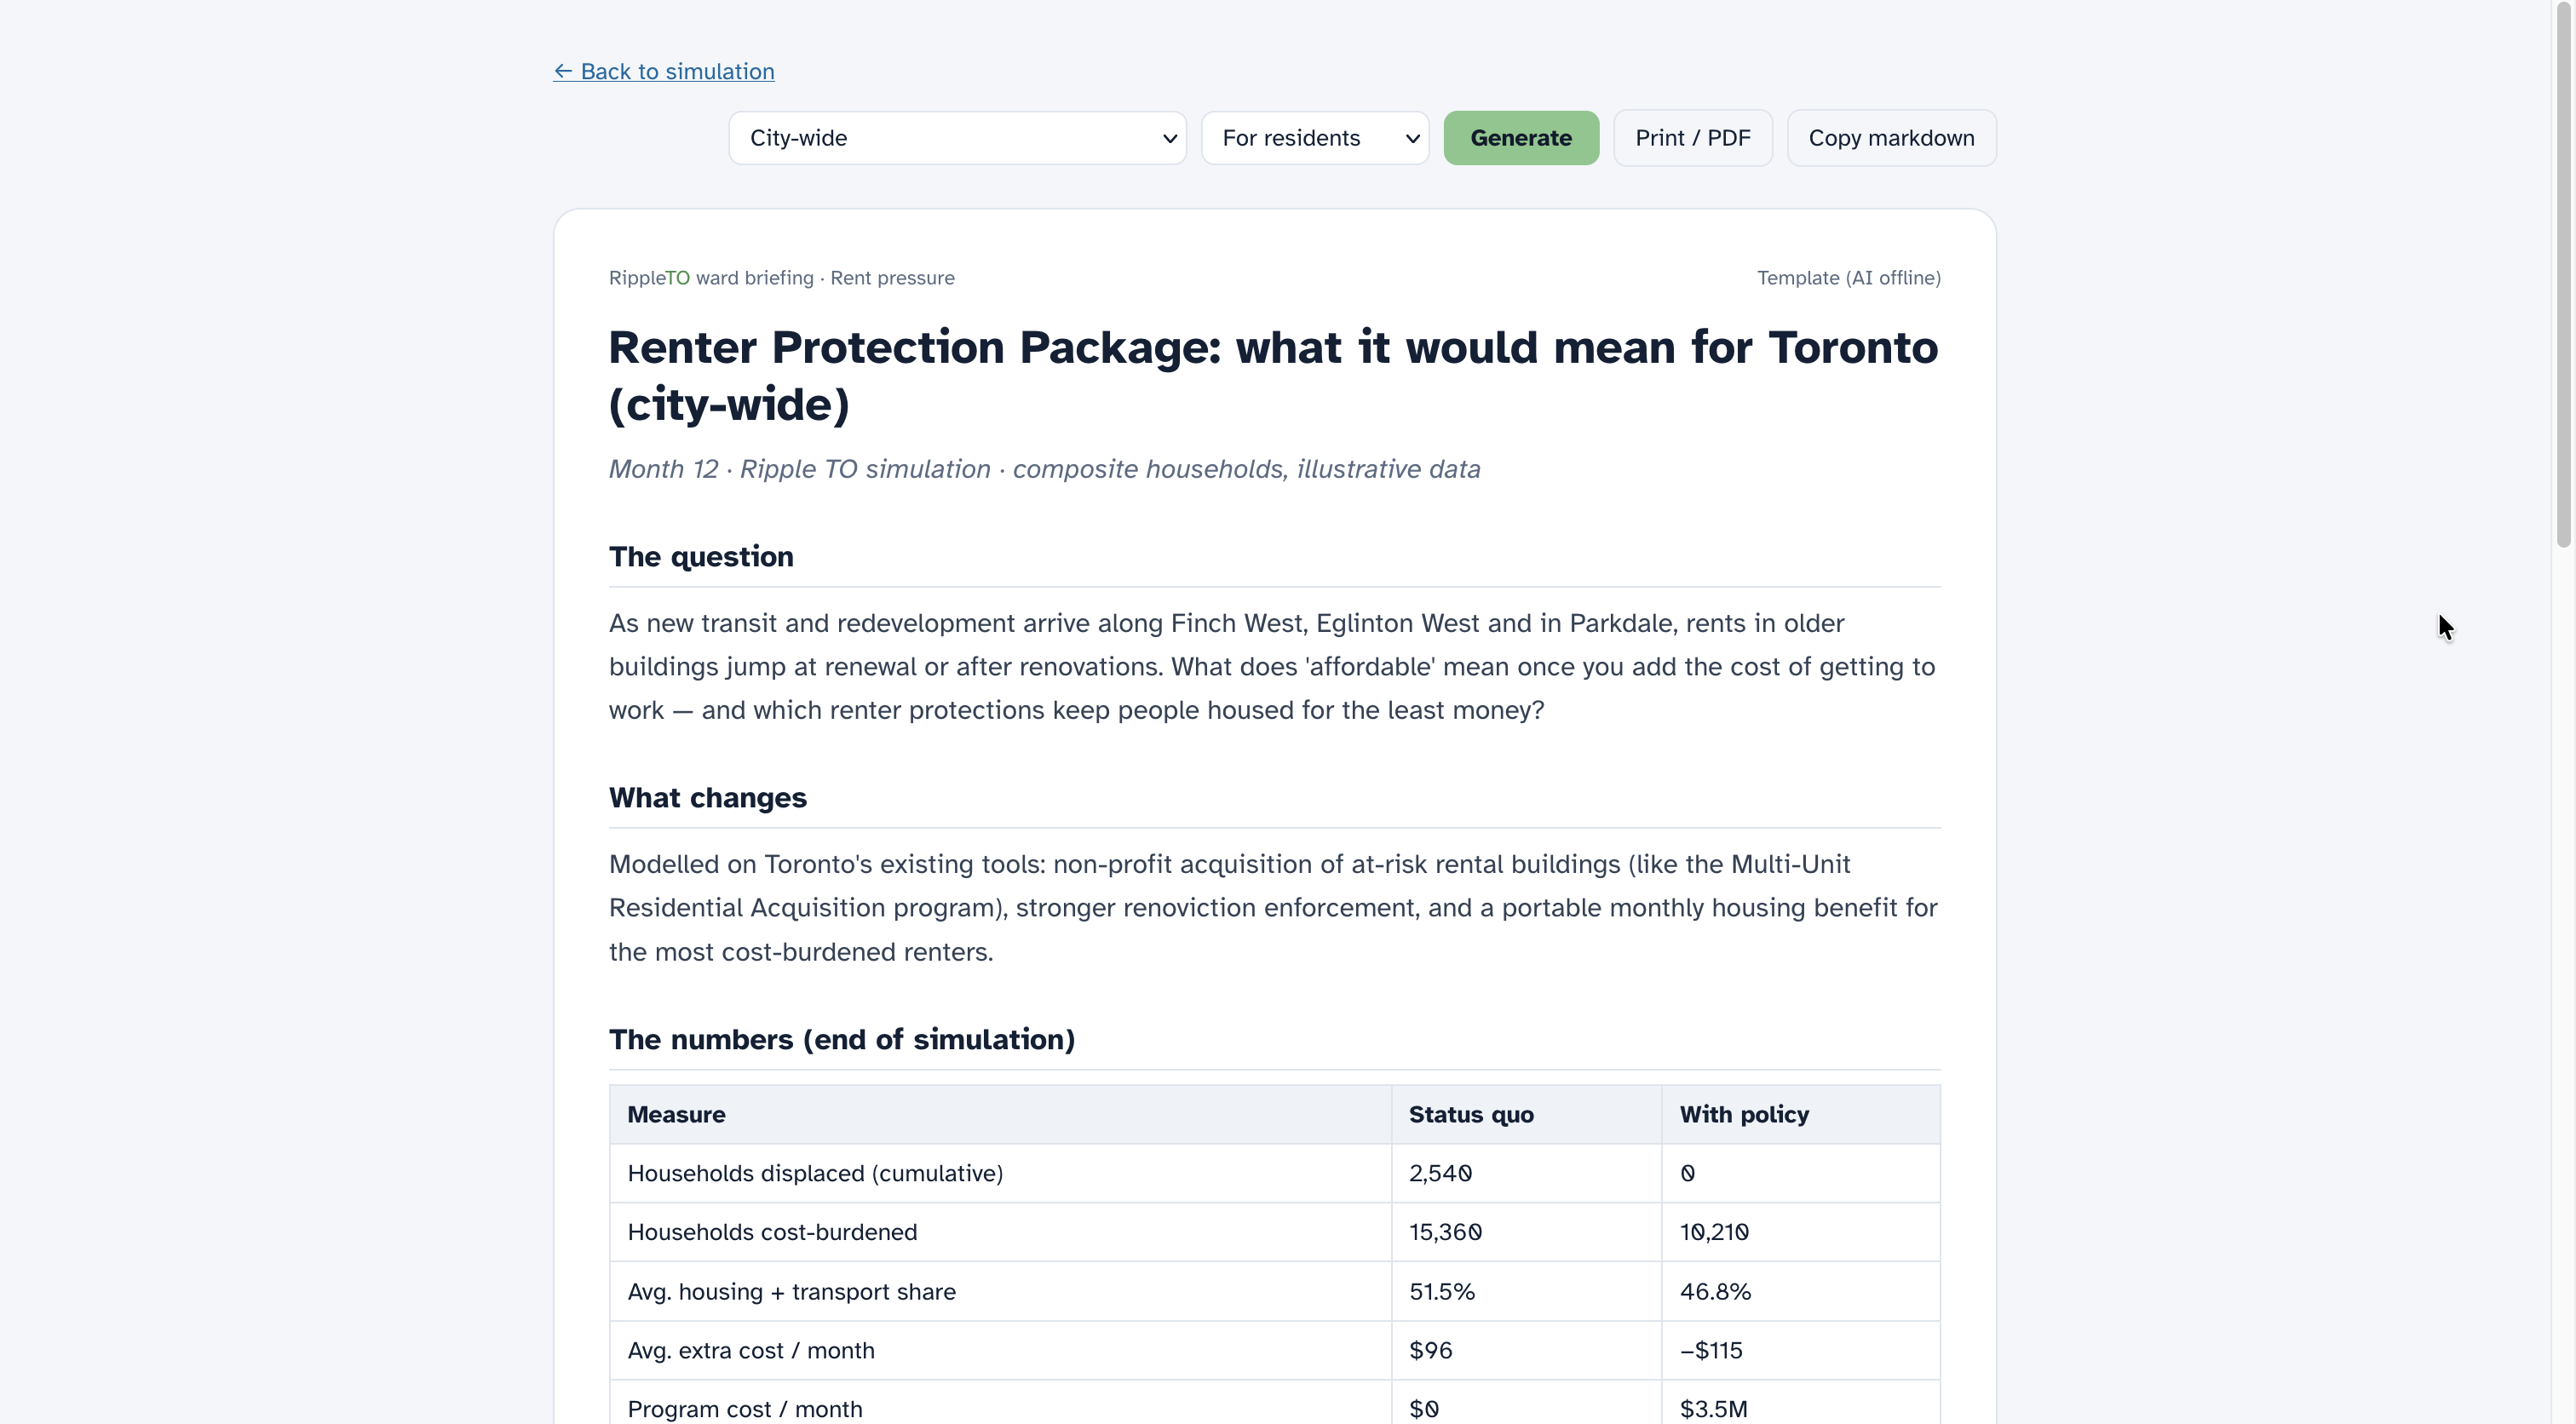
Ward Briefing
-
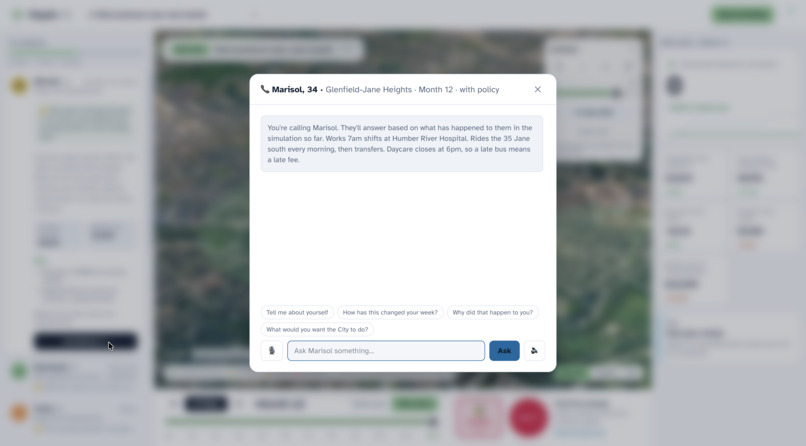
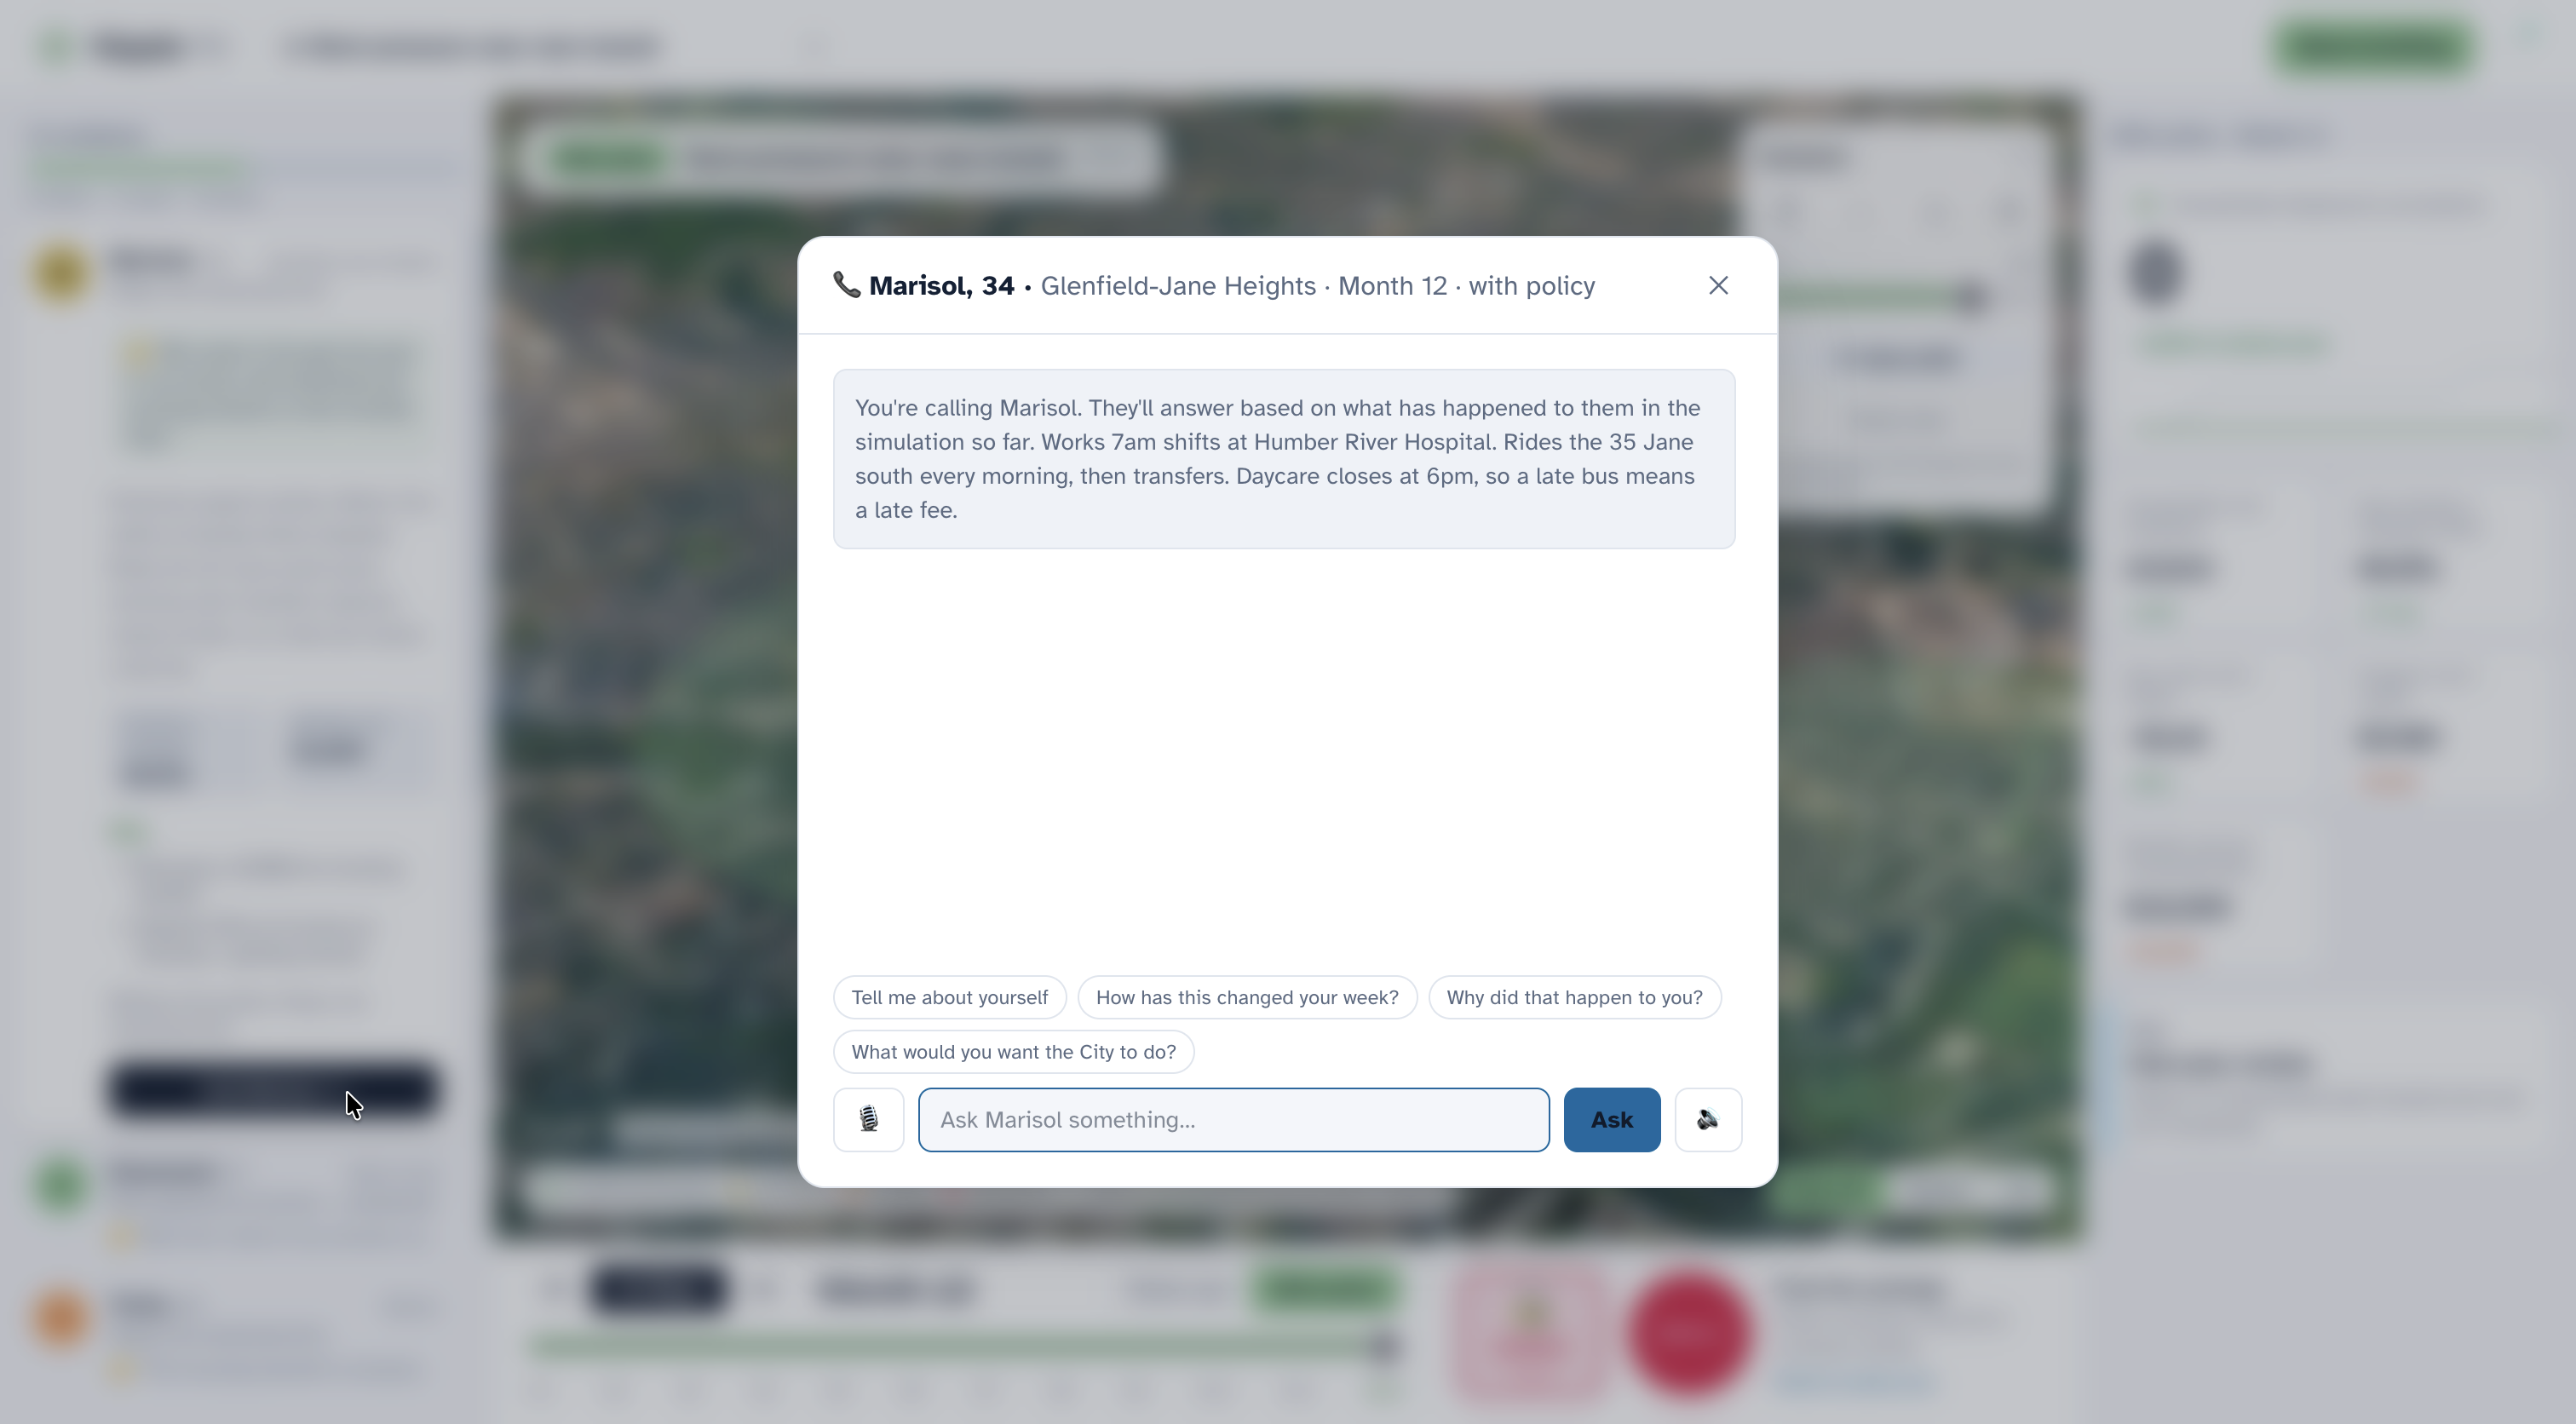
Calling/messaging a person
-
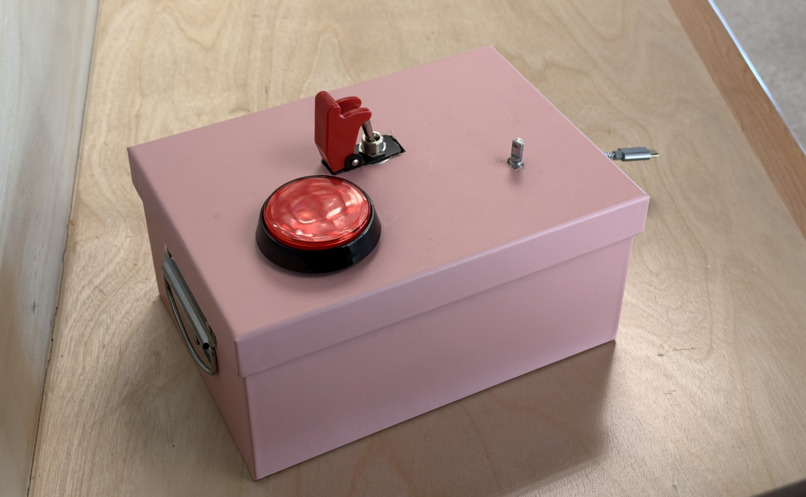
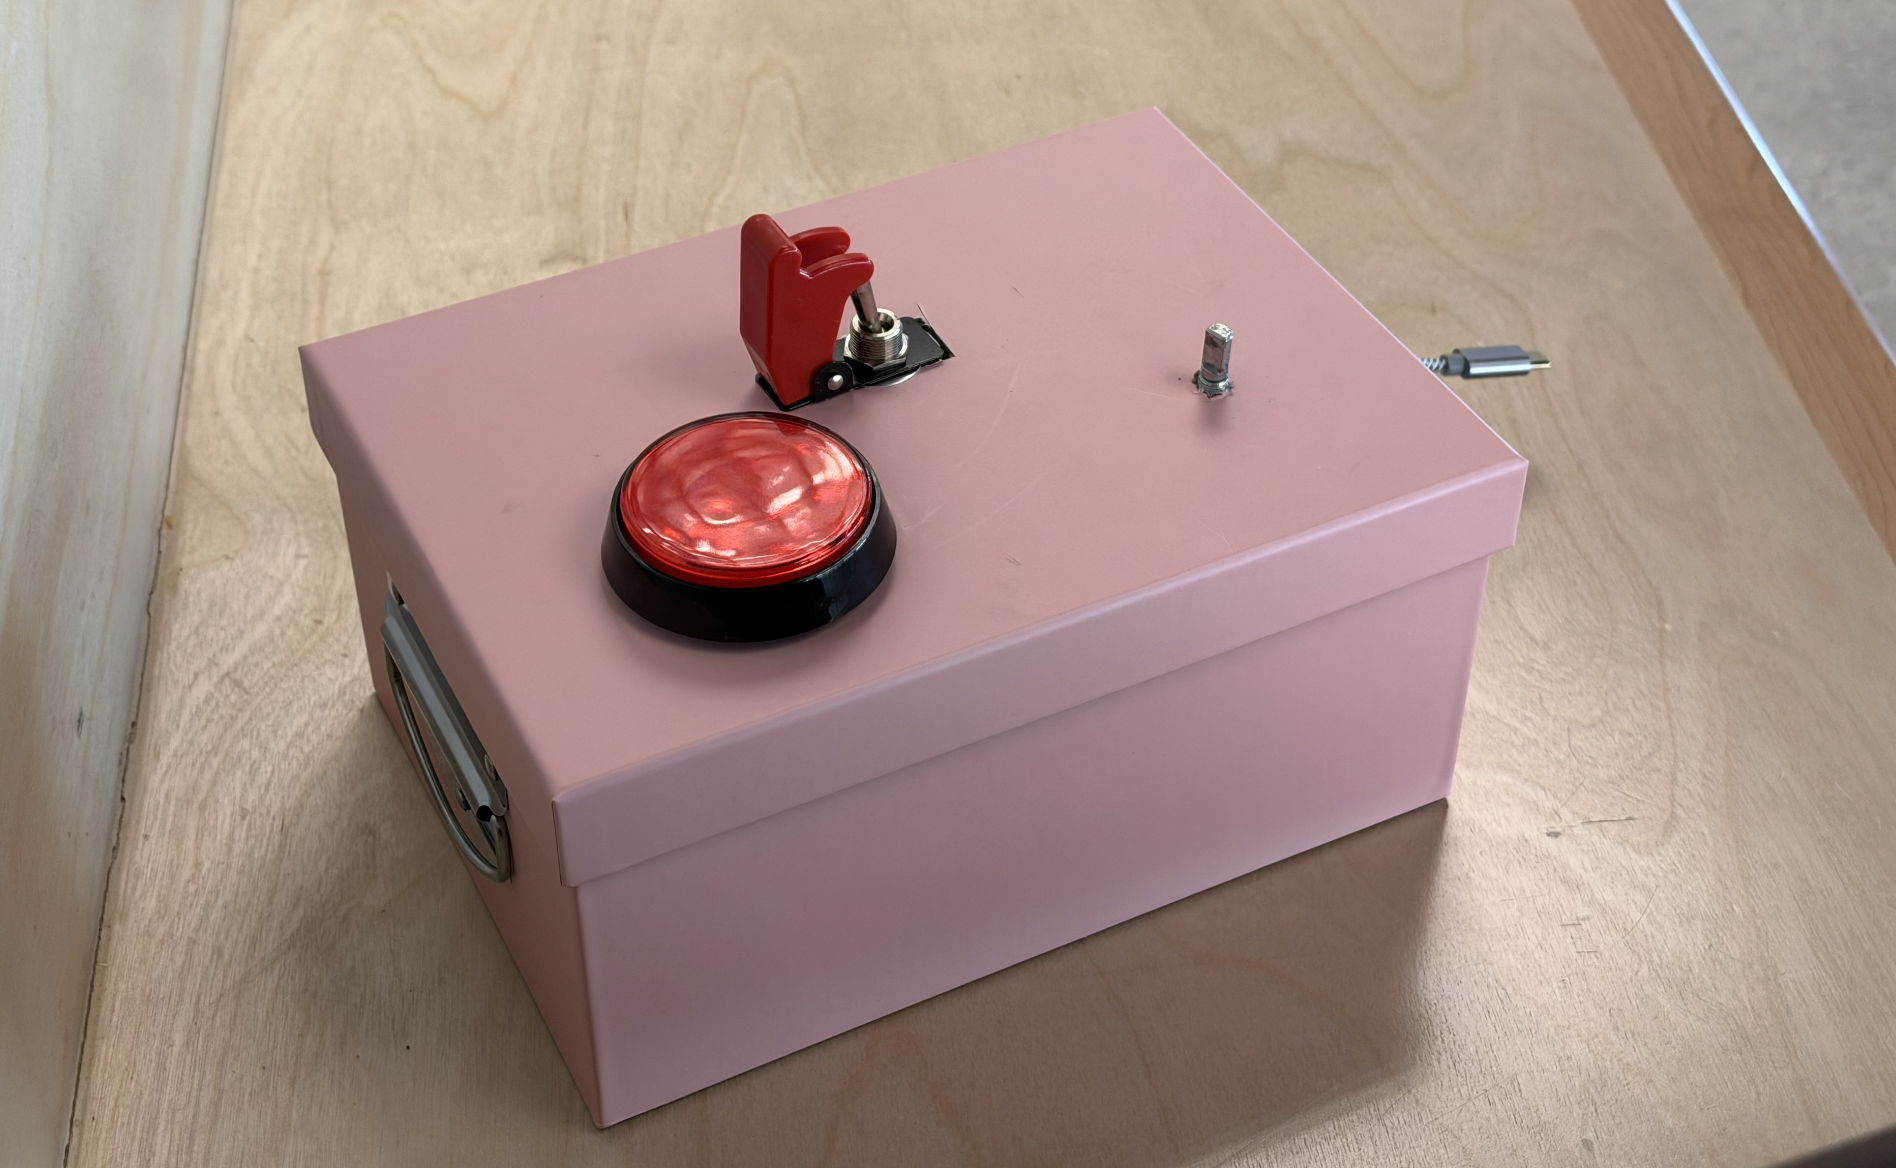
Physical hardware (button, dial, and switch) used to imitate the enacting of a regulation

Inspiration
Toronto makes decisions every week that change people's lives: a bus lane on Jane Street, a rent rule, a heat-emergency plan. The debate is usually about averages ("trips 8 minutes faster"), but nobody lives an average. A personal support worker catching the 35 Jane at 6am, a senior with COPD on the 11th floor with no AC, and a professor with central air all experience the same policy completely differently, and some people are missed entirely.
Ahead of the 2026 municipal election, we wanted a way to see a decision travel through the city, one household at a time, before it's made.
What it does
Ripple TO is a civic scenario simulator for Toronto.
- Pick a real decision. Three are built in: RapidTO red bus lanes on Jane Street, rent pressure near new transit, and a five-day extreme heat warning. You can also describe your own policy in plain English and the AI sets up the closest model.
- Enact it. Flip the safety switch and press the big red button on our physical control panel. A ripple spreads across a 3D map of Toronto from where the policy physically happens, and each resident lights up the moment it reaches them.
- Meet the people it reaches. Twelve AI residents, composites built from 2021 Census neighbourhood data, live through it month by month. Each one reacts in their own words.
- Call them. Ask any resident how the policy changed their week. They answer out loud, in their own voice.
- Compare worlds. Switch between "status quo" and "with policy" to see who comes out ahead, who pays, and who's missed.
- Get a ward briefing. Generate a neutral, plain-language briefing for residents, journalists or councillors, with sources and limits stated up front.
Who it's for, and the problem it solves
Users: Toronto residents, local journalists, community organizations, and councillors' offices, ahead of the 2026 municipal election.
The problem: City decisions like bus lanes, rent measures and heat-emergency plans are debated in averages, and the information is scattered across reports, open data and news. It's hard for a resident to answer "what would this mean for someone like me?", and hard for a journalist or councillor's office to see who a decision helps, who pays, and who is missed.
How we use the data: We built twelve composite households from the City's 2021 Census Neighbourhood Profiles: income, renter share, transit commuting. Each one is weighted by real Census household counts (the neighbourhood's households × the share matching that person's tenure, household size and age group), so totals reflect how many similar households actually live there. A transparent rules model then applies each policy using the City's own published estimates (like the RapidTO Jane Street bus and car time estimates) and real civic infrastructure: the locations and hours of 17 Toronto Public Library branches that serve as cool spaces.
How it helps: Residents see a decision play out for people like them. Journalists get a grounded, quotable picture of winners and losers. Councillors' offices get a neutral, plain-language ward briefing with sources and limits included. Ripple doesn't predict the election or support any candidate; it makes civic information easier to understand and act on.
How we built it
Rules do the math, AI does the language. Every number comes from a transparent, deterministic model: trip times, housing + transport burden, heat risk, cooling-space access. The AI never invents a statistic; it only describes what the model says happened to that person.
- Simulation engine (TypeScript): per-household models for transit mode choice, rent burden and heat risk, run month by month (or day and night for the heat wave) under both the status quo and the policy.
- AI residents (Google Gemini 2.5 Flash): each resident gets their persona card plus a factual log of what happened to them, with grounding rules so they stay in character and stay truthful. Gemini also writes the ward briefings and turns plain-English policy ideas into scenarios. Every AI feature has a built-in fallback, so the demo can't break if the Wi-Fi does.
- Voices (ElevenLabs): every resident has their own cast voice, so a call with Desmond (67, retired TTC mechanic) sounds nothing like Lin (19, York student). Gemini writes the words; ElevenLabs speaks them.
- The city in 3D: three map modes. Real 3D uses Google Photorealistic 3D Tiles via deck.gl. Model uses real OpenStreetMap building footprints and heights rendered in MapLibre GL, with no API key needed. 2D uses Leaflet as a fallback. Each falls back to the next automatically.
- The ripple: the wave starts from the policy's real location (the bus-lane corridor, each new cooling hub) and accelerates outward. Each resident's "hit" time comes from their real distance to the policy, so the order they light up means something.
- Hardware control panel (Raspberry Pi Pico + CircuitPython): a knob to move through time, a safety-covered toggle to arm, and a big red button to enact. The Pico acts as a USB keyboard, so it needs no drivers and the panel is fully removable: unplug it and the laptop keyboard does the same thing.
- Stack: Next.js 16, React 19, Tailwind CSS v4, Zustand, deployed on Vercel.
Responsible by design
- Every number comes from a rule, not the AI. The AI only narrates what the model computed, and residents are instructed never to invent statistics.
- Composite residents, not real people. We don't use race or ethnicity; outcomes come from circumstances like income, tenure, car access, age, health and building type.
- Limits up front. Every scenario has a one-click "Data, assumptions & limits" panel listing what we assumed, what we left out, and every source. Results are directional, not forecasts.
- Honest about the data's age and approximations. The 2021 Census was taken in May 2021, during COVID, so transit commuting reads low, and we flag that on screen. Household weights treat tenure, size and age shares as independent, which is an approximation, and we say so.
- Non-partisan. Ripple doesn't predict the election or score candidates; it shows who a decision reaches, whoever proposes it.
- Accessible: plain-language copy, a typeface designed for legibility (Atkinson Hyperlegible), full keyboard control, a 2D map fallback for low-power devices, and fallbacks so it works even without AI or heavy 3D graphics.
Themes
- AI for Social Impact: transparent, grounded AI that surfaces who a policy misses.
- Climate Action & Sustainability: transit priority on Jane Street (car trips avoided, CO₂) and heat resilience as the climate warms.
- Healthcare Innovation & Well-being: the five-day heat warning models heat risk for seniors and residents with health conditions, and shows how cooling hubs and wellness checks change it.
- Sustainable FinTech & Economic Inclusion: the rent-pressure scenario tracks each household's combined housing + transportation cost burden against the 30% affordability benchmark.
Challenges we ran into
- Keeping the AI honest. An AI resident that makes up statistics is worse than useless for civic decisions. We separated the system so the model computes and the AI only narrates, and we ground every prompt in that resident's actual simulated history.
- Making a city-wide effect visible on screen. Our residents live across the whole city, but the camera shows a few kilometres. A constant-speed wave left the screen in a blink, so we made it accelerate: slow nearby, fast far away, so you can actually watch it reach people.
- Real 3D in the browser. Photorealistic tiles, draped overlays and a fallback chain that never shows a blank map took a lot of iteration, including a browser-specific map crash we had to track down.
- First time doing hardware. None of us had wired anything before. Our breadboard wasn't making contact with the Pico's pins, and we learned to debug pin by pin, eventually writing a tiny test program that lights the Pico's LED whenever a wire reaches ground.
Accomplishments that we're proud of
- Pressing a physical red button and watching a decision ripple across real Toronto streets to real-feeling people makes policy felt, not just read.
- Every number on screen can be traced back to a rule and a source, and every AI sentence is grounded in it.
- It never breaks in a demo: no AI key falls back to built-in text, no Google key falls back to the open-data 3D model, no WebGL falls back to 2D, and no panel falls back to the keyboard.
What we learned
- Equity questions ("who is missed?") only become visible when you model individuals, not averages.
- Separating computation from language is what makes AI trustworthy in high-stakes, civic settings.
- Hardware debugging is all about isolating one variable at a time.
What's next for Ripple TO
- More scenarios from City open data, starting with development applications ("what is being built near me, and who does it affect?").
- Shade the map by ward, so councillors' offices can see their own ward at a glance.
- Validate against a real policy: compare the model with the City's before/after travel times for the Eglinton East RapidTO lanes.
- An equity view breaking down who wins and loses by income, age and neighbourhood.
- Grow custom scenarios. Typing a policy in plain English already works in a basic form; next is richer, data-backed versions.
Data sources
| Source | Used for |
|---|---|
| City of Toronto Open Data: Neighbourhood Profiles, 2021 Census (158-neighbourhood model) | Household income, renter share, transit commuting, household weights |
| City of Toronto: RapidTO Jane Street | Bus lane design and bus and car time estimates |
| UrbanToronto: RapidTO delays (July 2025) | Project status |
| Toronto Public Library: Branch General Information (City of Toronto Open Data) | Locations and hours of 17 cool spaces |
| City of Toronto: Cool spaces near you | Heat relief network context |
| City of Toronto: Multi-Unit Residential Acquisition program | Housing scenario policy tools |
| City of Toronto: Toronto Rent Bank | Housing scenario policy tools |
| CMHC: housing affordability | 30% shelter-cost benchmark |
| City of Toronto: Ward profiles and ward lookup | Confirming each neighbourhood's ward |
| OpenStreetMap | Base map and 3D building footprints |
3D imagery in the "Real 3D" view © Google (Photorealistic 3D Tiles).
Residents are composites built from neighbourhood patterns, not real people. We don't model race or ethnicity. Results are directional, not forecasts. Ripple is non-partisan.
Built With
- circuitpython
- deck.gl
- elevenlabs
- google-gemini
- google-maps-platform
- leaflet.js
- maplibre
- next.js
- openstreetmap
- porkbun
- raspberry-pi-pico
- react
- tailwindcss
- typescript
- vercel
- web-serial
- zustand


