-
RioClear Initiative Poster Presentation
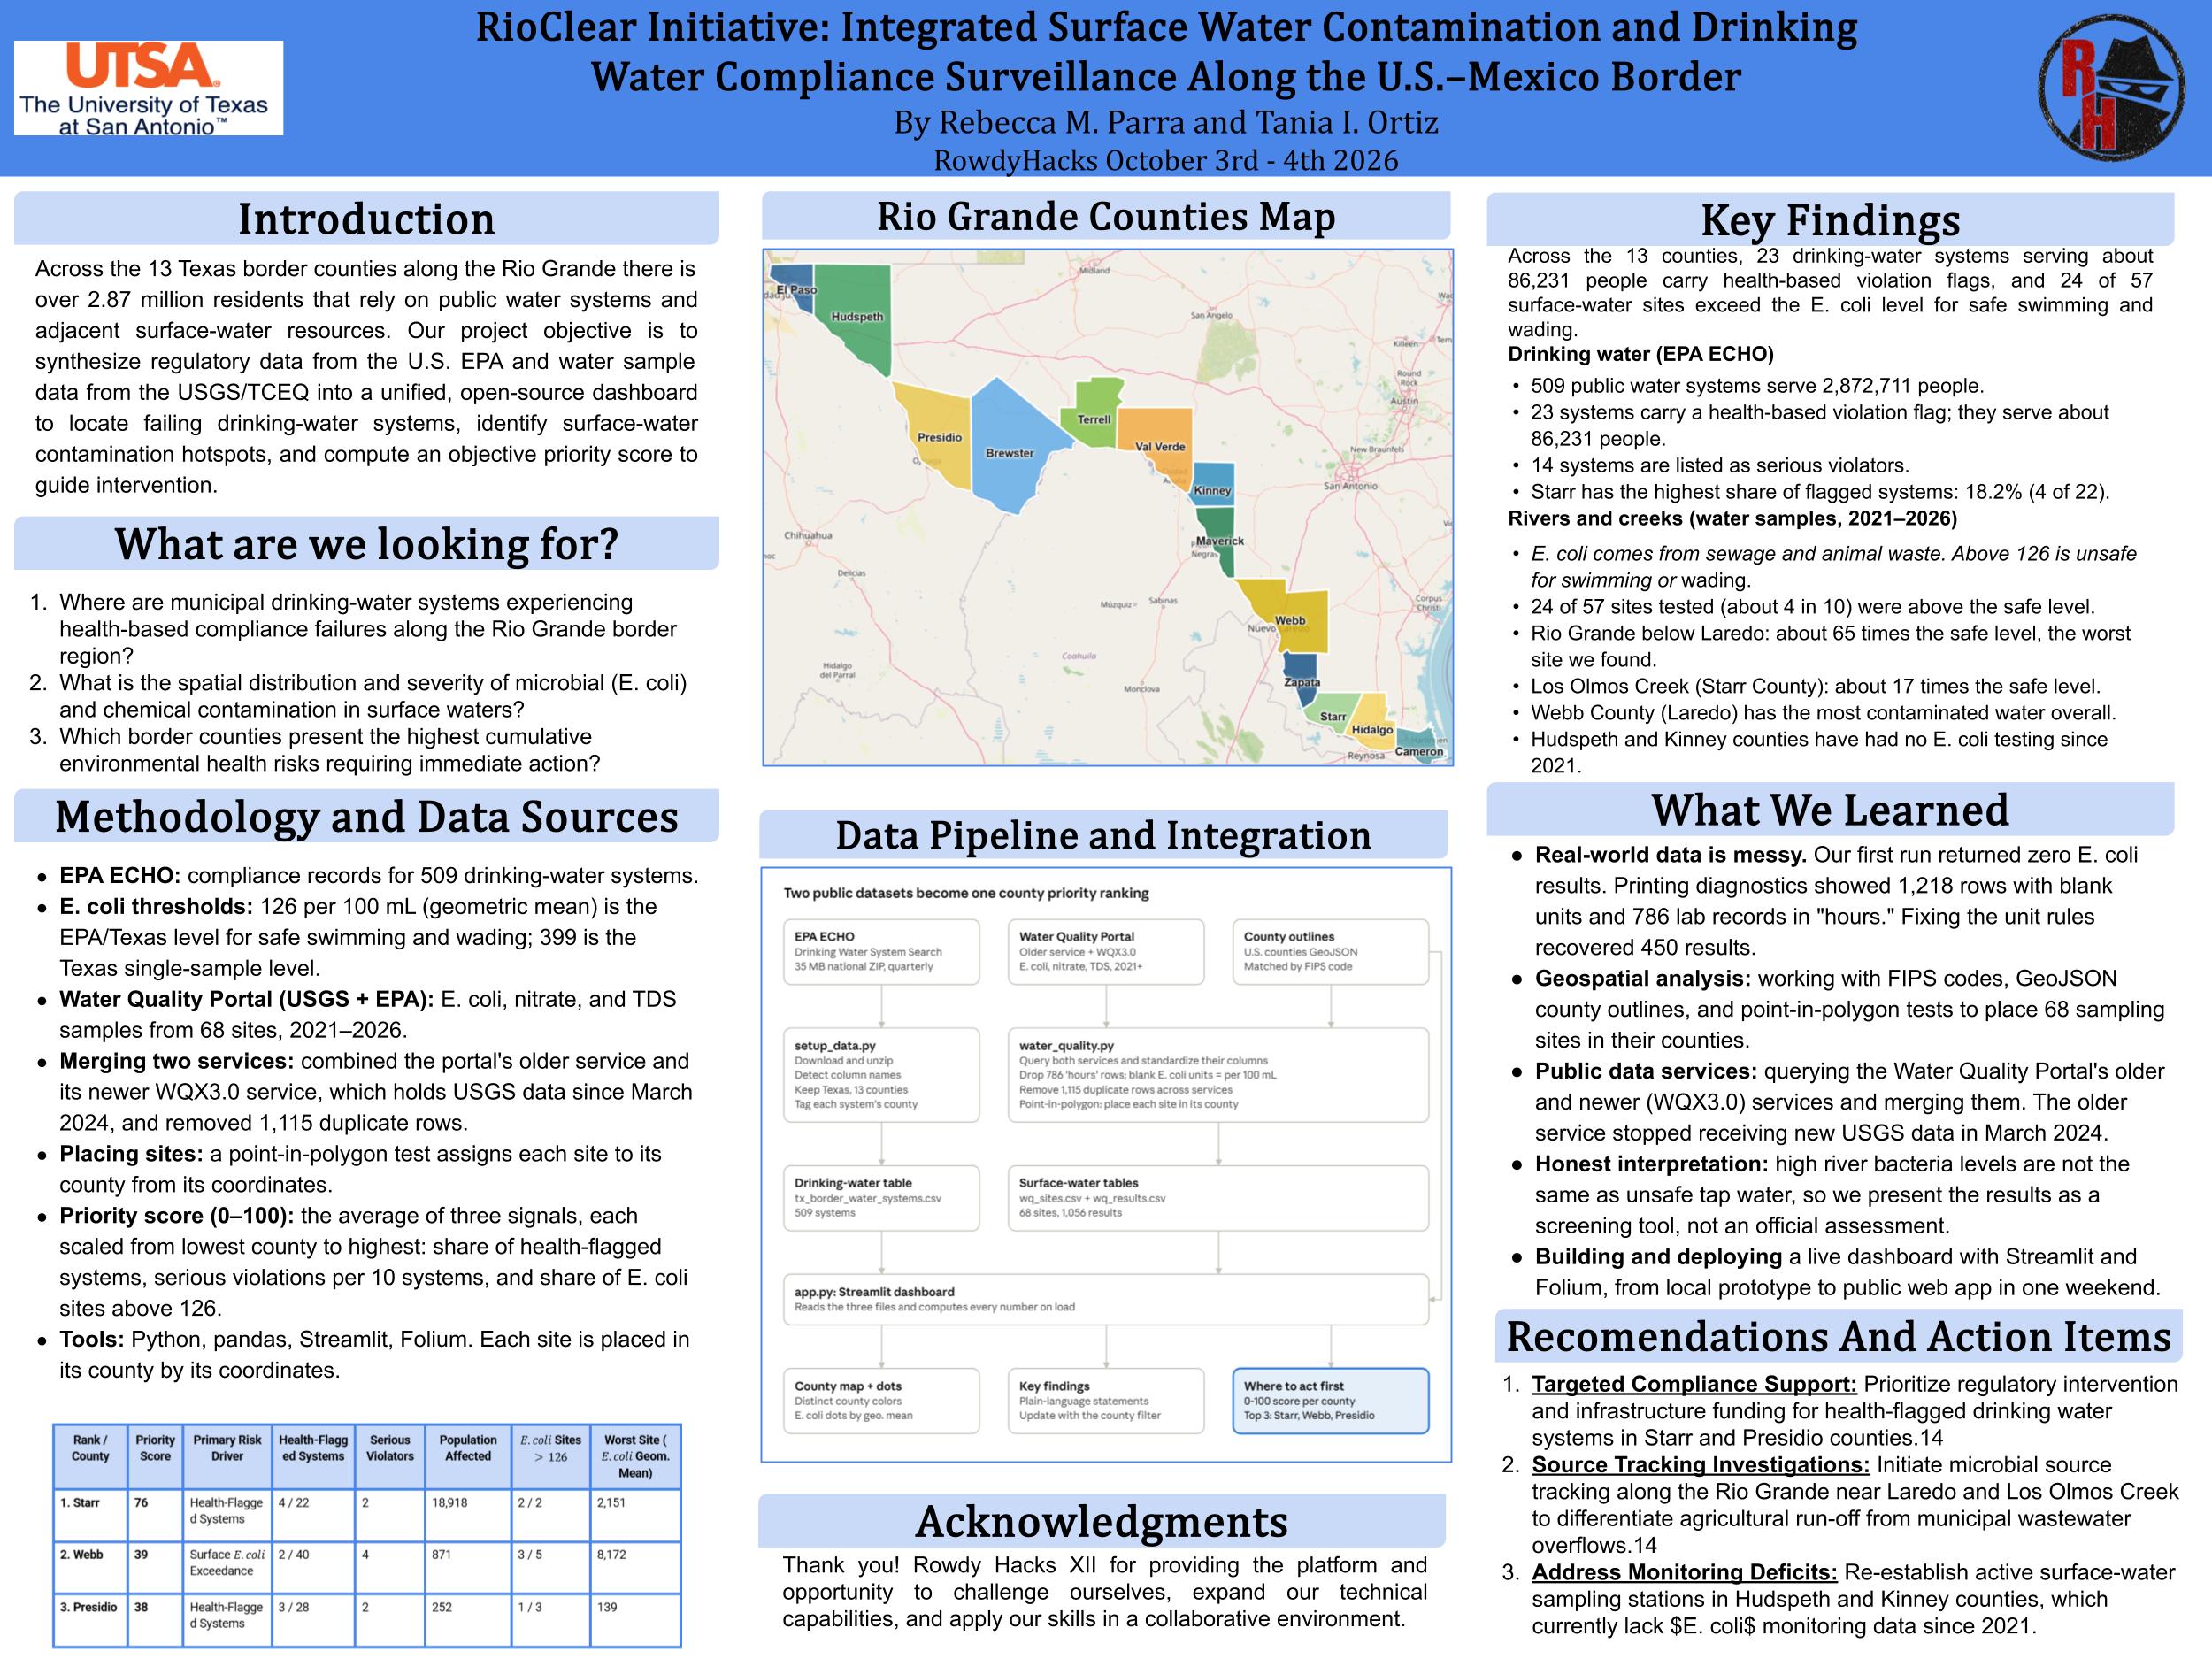
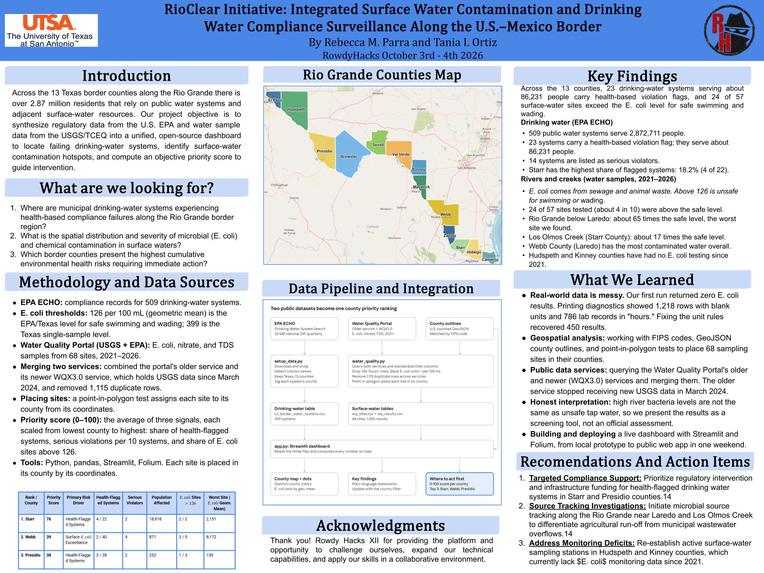
What it does RioClear Initiative is a live dashboard that maps the 13 Texas counties along the Rio Grande. It combines EPA drinking-water compliance records for 509 public water systems with E. coli, nitrate, and salinity samples from 68 rivers, creeks, and drains (2021–2026). A transparent 0–100 priority score ranks each county so officials know where to act first. Right now, that's Starr, Webb, and Presidio.
How we built it Two Python scripts download and clean public data from EPA ECHO and the Water Quality Portal (USGS + EPA). We query both of the portal's services, merge them, remove 1,115 duplicate rows, and use a point-in-polygon test to place each sampling site in its county. A Streamlit app with a Folium map turns the cleaned data into an interactive dashboard, deployed on Streamlit Community Cloud.
Challenges we ran into Our first run returned zero E. coli results. We added diagnostics and found that about 1,200 E. coli records had a blank unit field, which our filter was throwing away, while 786 other records were lab timing entries in "hours." Fixing the unit rules recovered 450 E. coli results. We also learned that the portal's older service stopped receiving new USGS data in March 2024, so we had to query the newer one too.
Accomplishments that we're proud of
- 23 drinking-water systems serving about 86,000 people are flagged for health-based violations.
- 24 of 57 surface-water sites have E. coli levels above the safe limit for swimming and wading.
- The Rio Grande below Laredo reached about 65 times that limit.
- Every number traces back to a public record, and our scoring formula is shown on the dashboard.
What we learned How to work with public data services, geospatial analysis (FIPS codes, GeoJSON, point-in-polygon tests), cleaning messy real-world data, and building and deploying a live dashboard in one weekend. We also learned to be careful with interpretation: contaminated river water does not mean unsafe tap water.
What's next for RioClear Initiative Add county illness data from Texas DSHS to see whether contamination hotspots match where people get sick, track trends over time, add data from the Mexican side of the river, and separate main-river sites from tributaries and drains. We'd also recommend E. coli monitoring for Hudspeth and Kinney counties, which have none in the data since 2021.

Log in or sign up for Devpost to join the conversation.