-
-
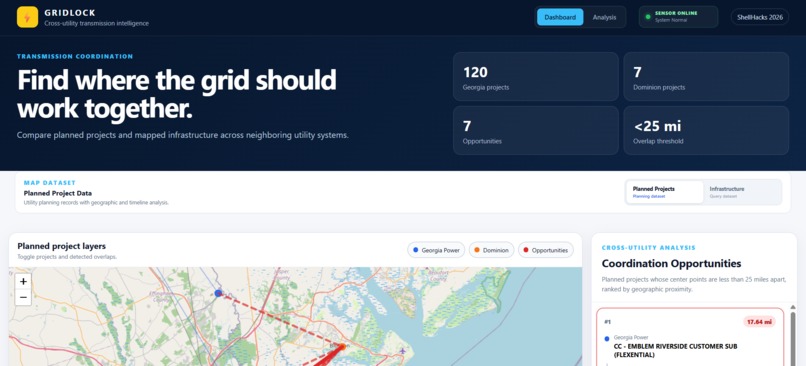
Dashboard
-
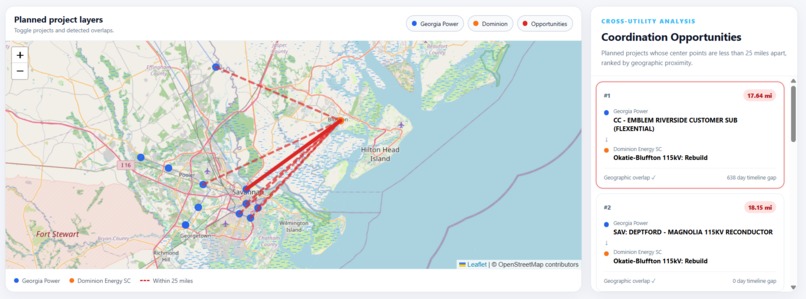
Interactive Map
-
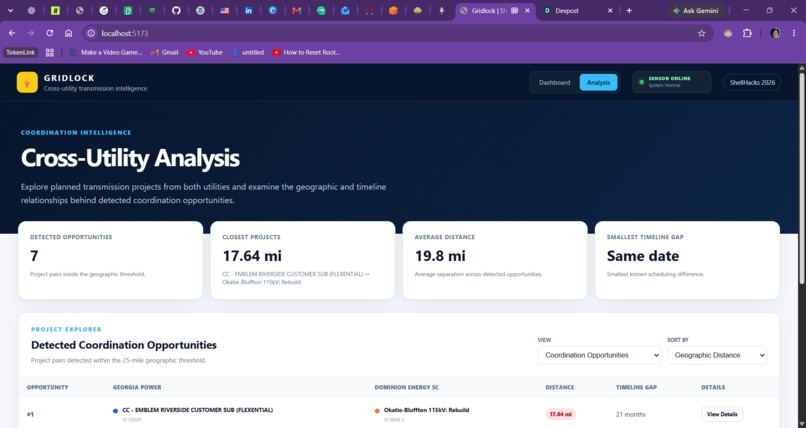
Analysis Page
-
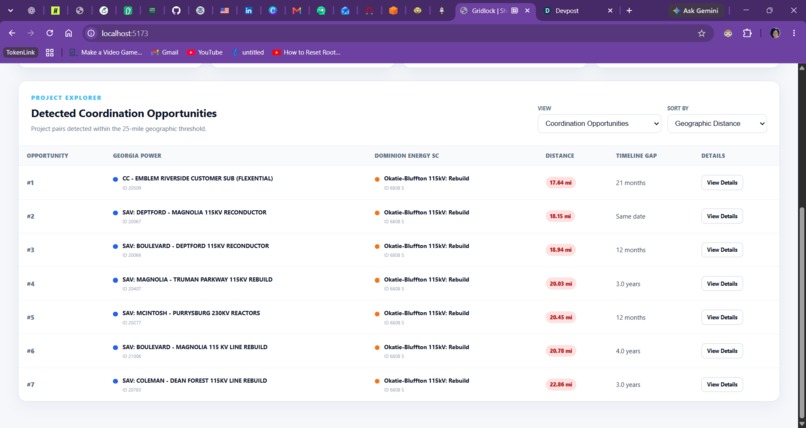
-
-
-
-
Grid Alert
-
-
-
*⚡ Inspiration *
Gridlock began with our hackathon challenge: how can we help electric utilities identify where future construction projects overlap and uncover opportunities to coordinate?
As we explored the challenge, we realized the problem went much further than simply finding two projects near each other on a map. Utilities are managing long-term construction plans, expensive machinery, crews, materials, budgets, and timelines—all while unexpected events can completely change those plans.
That led our team to ask bigger questions: What happens after an overlap is found? How much could collaboration actually save? What resources could be shared? And what happens when an emergency suddenly changes the plan?
Those questions shaped Gridlock into more than an overlap detector. We built a platform that identifies collaboration opportunities, analyzes potential resource and cost savings, provides AI-assisted recommendations, and connects to a hardware simulation that demonstrates how real-world grid disruptions could trigger an immediate coordinated response.
None of us entered the hackathon as experts in the power or construction industries, which made the challenge even more exciting. As we learned more about how utilities plan projects, allocate resources, respond to emergencies, and operate within real-world constraints, we continued finding new ways technology could make that process more connected.
The challenge gave us the problem. Learning the industry helped us imagine how much further the solution could go.
⚡ What It Does
RFRK Power is a utility coordination platform that helps electric companies identify project overlaps, prioritize opportunities, maximize shared resources, reduce unnecessary costs, and respond smarter when unexpected events disrupt their plans.
Our platform allows utilities to:
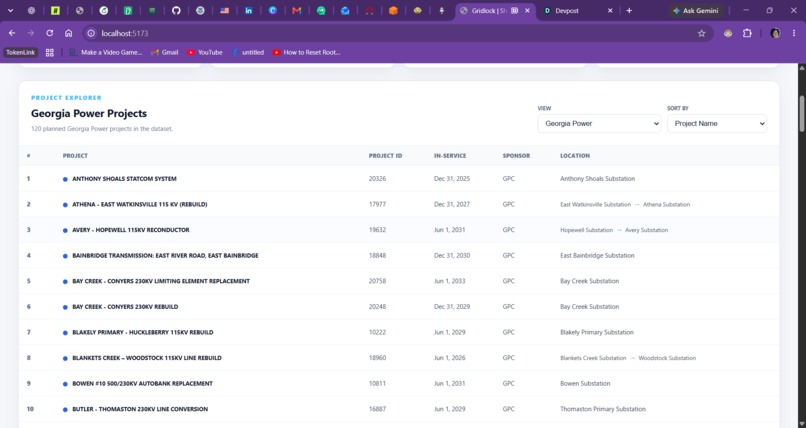
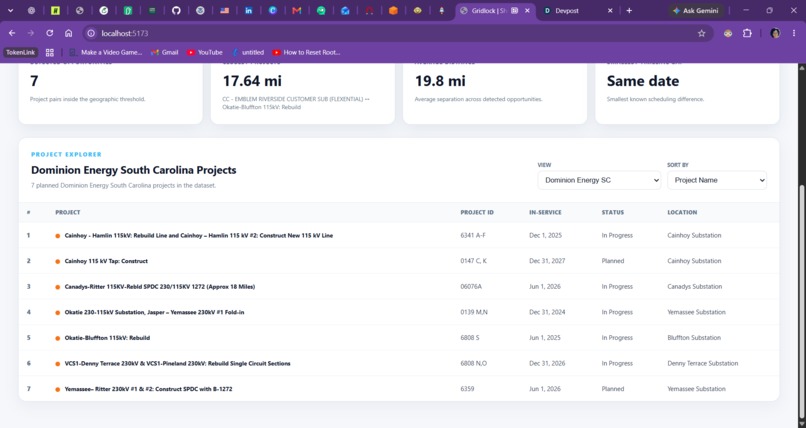
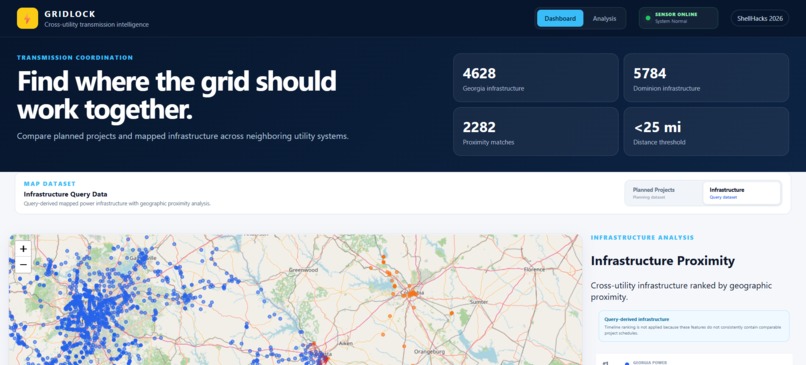
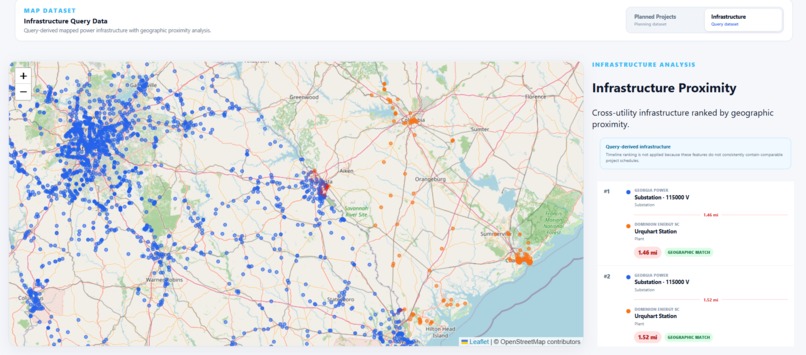
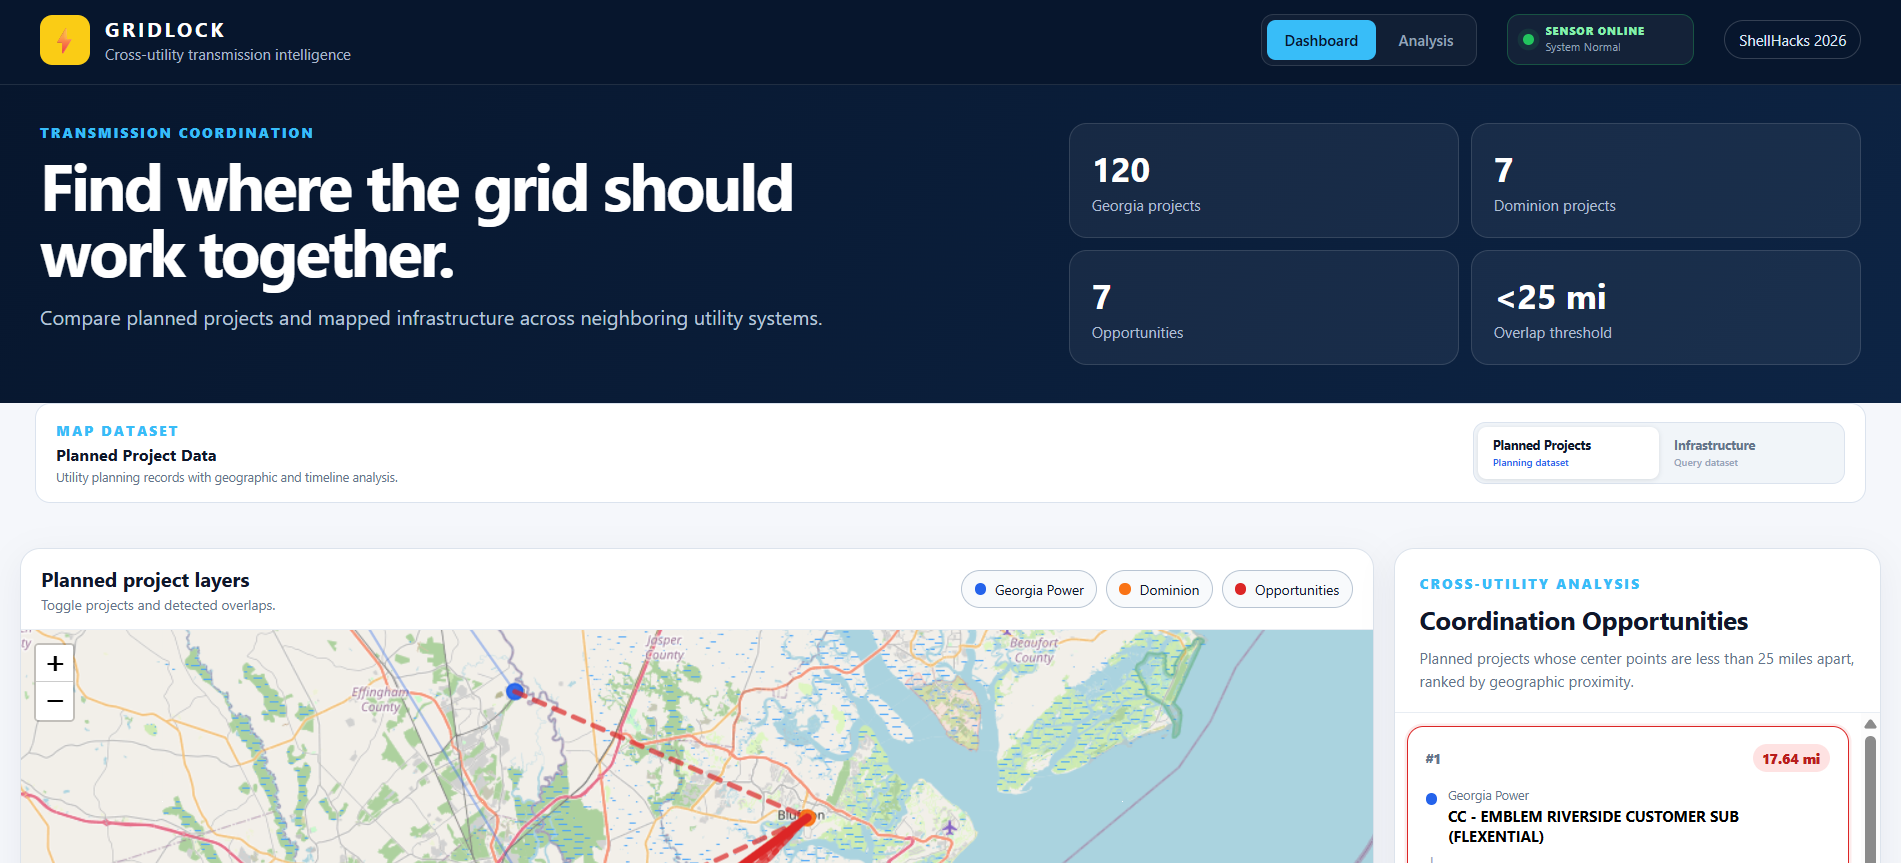
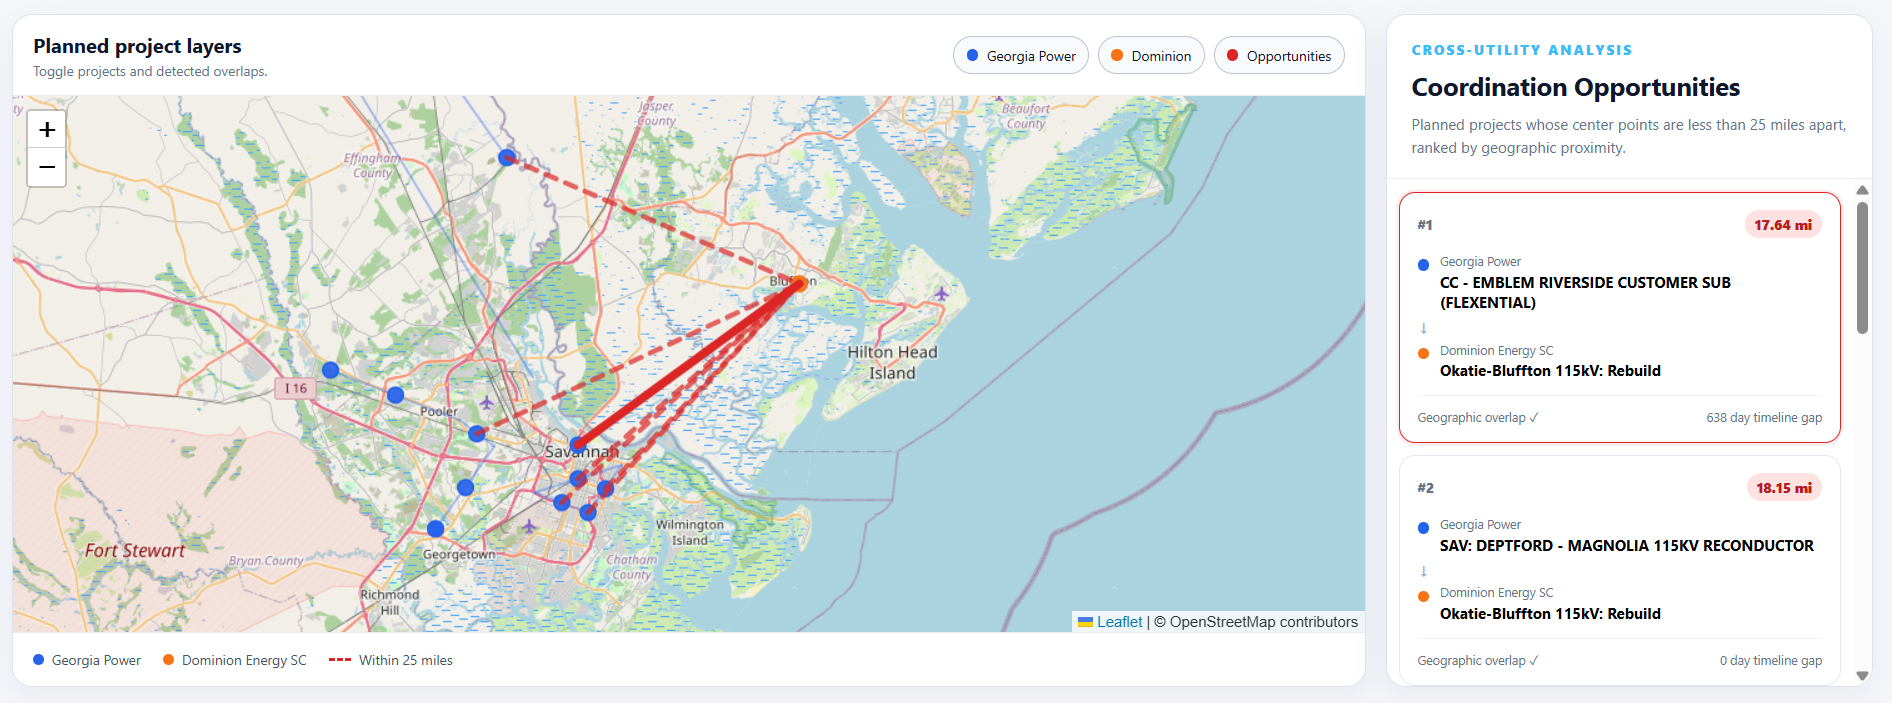
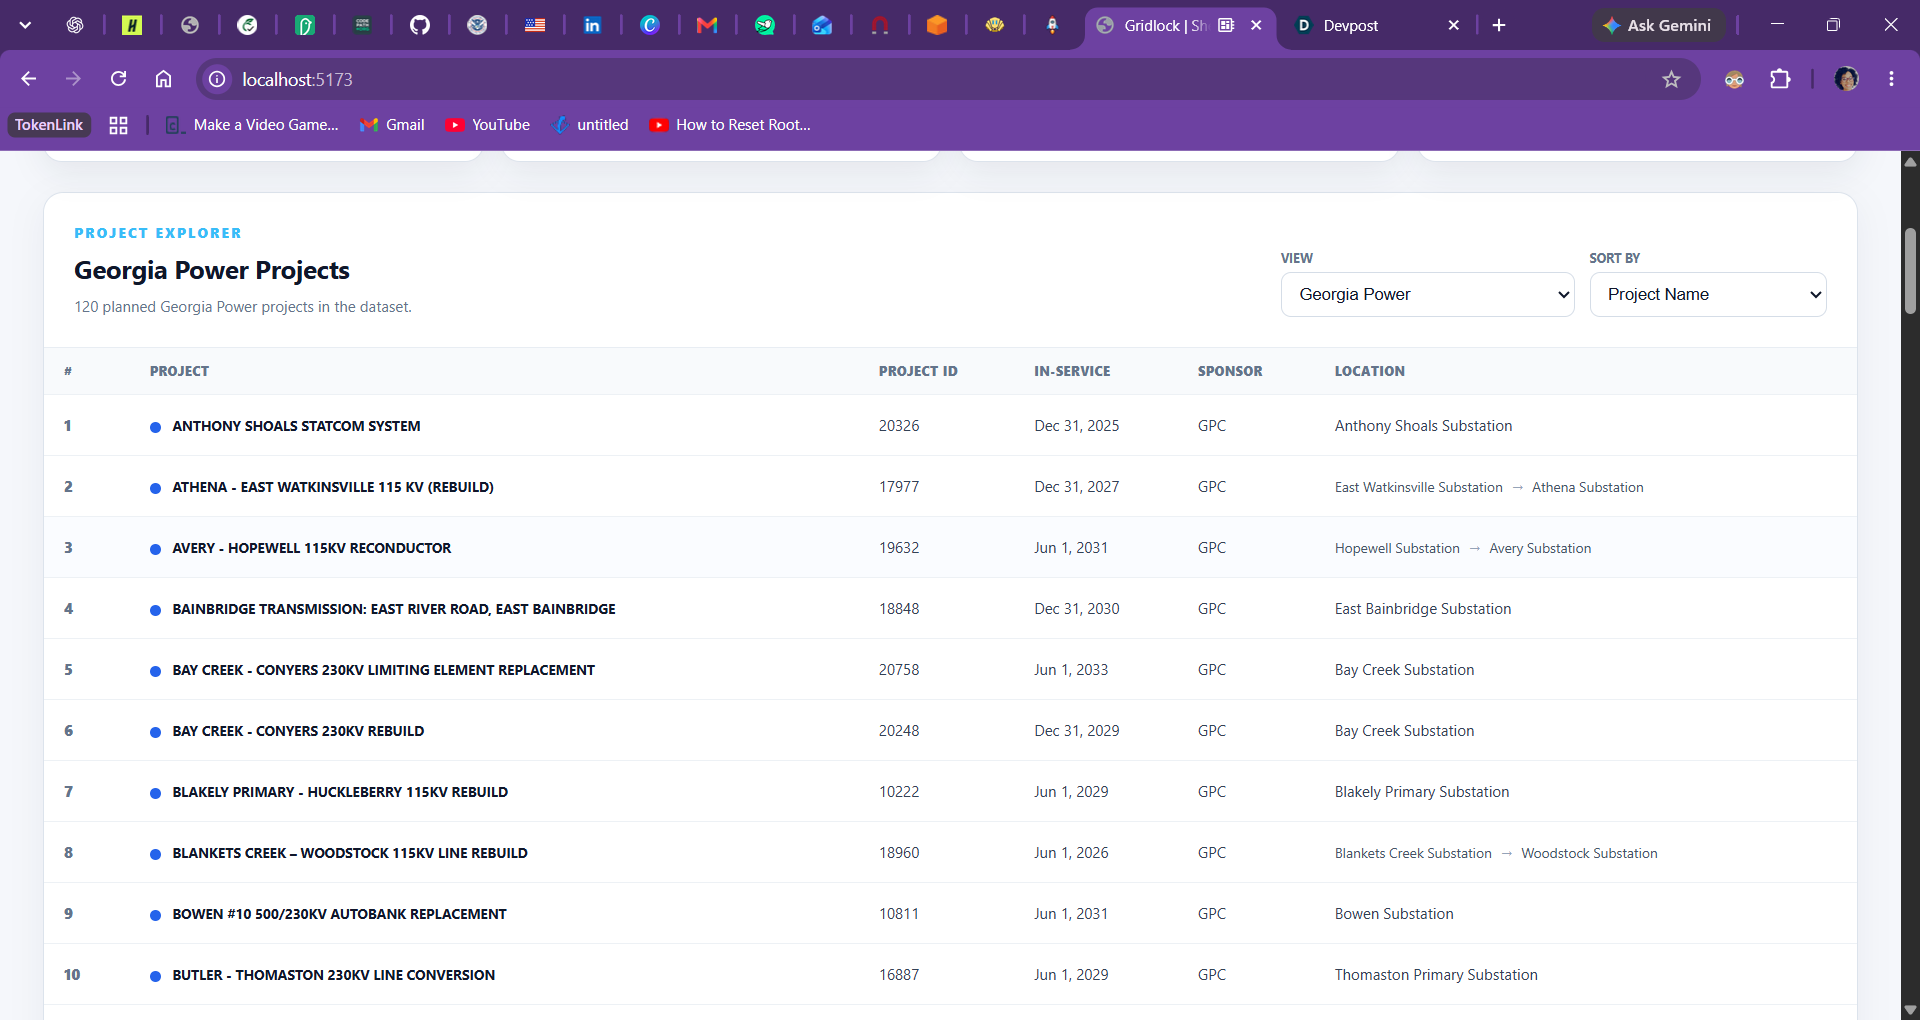
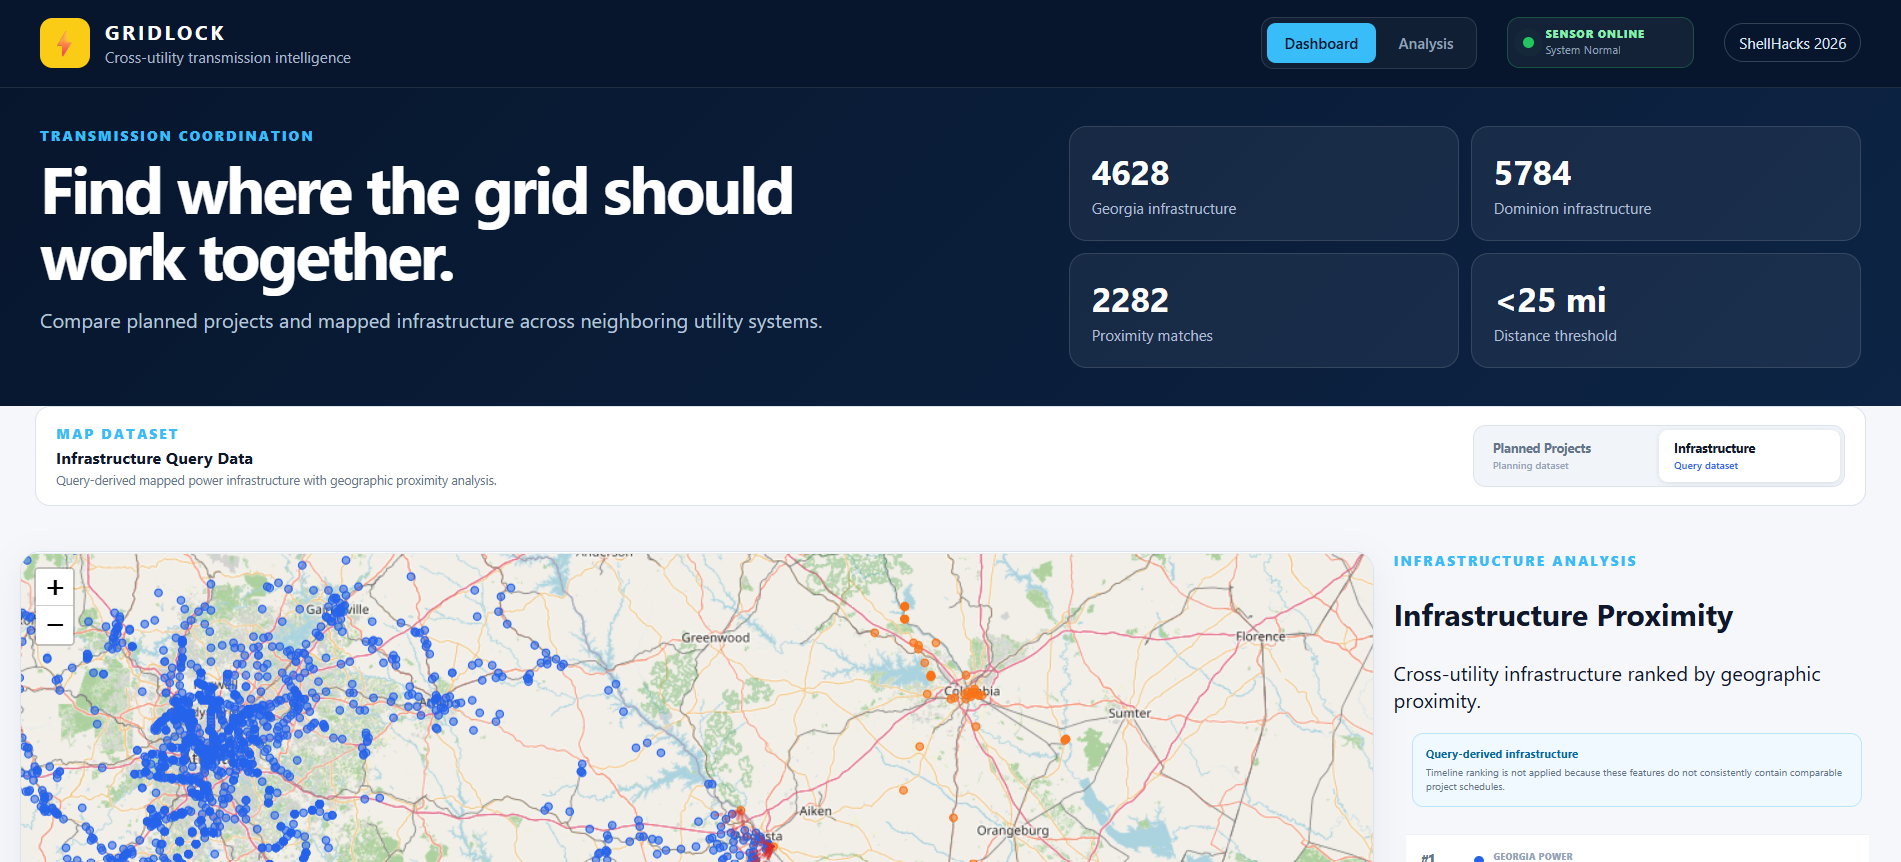
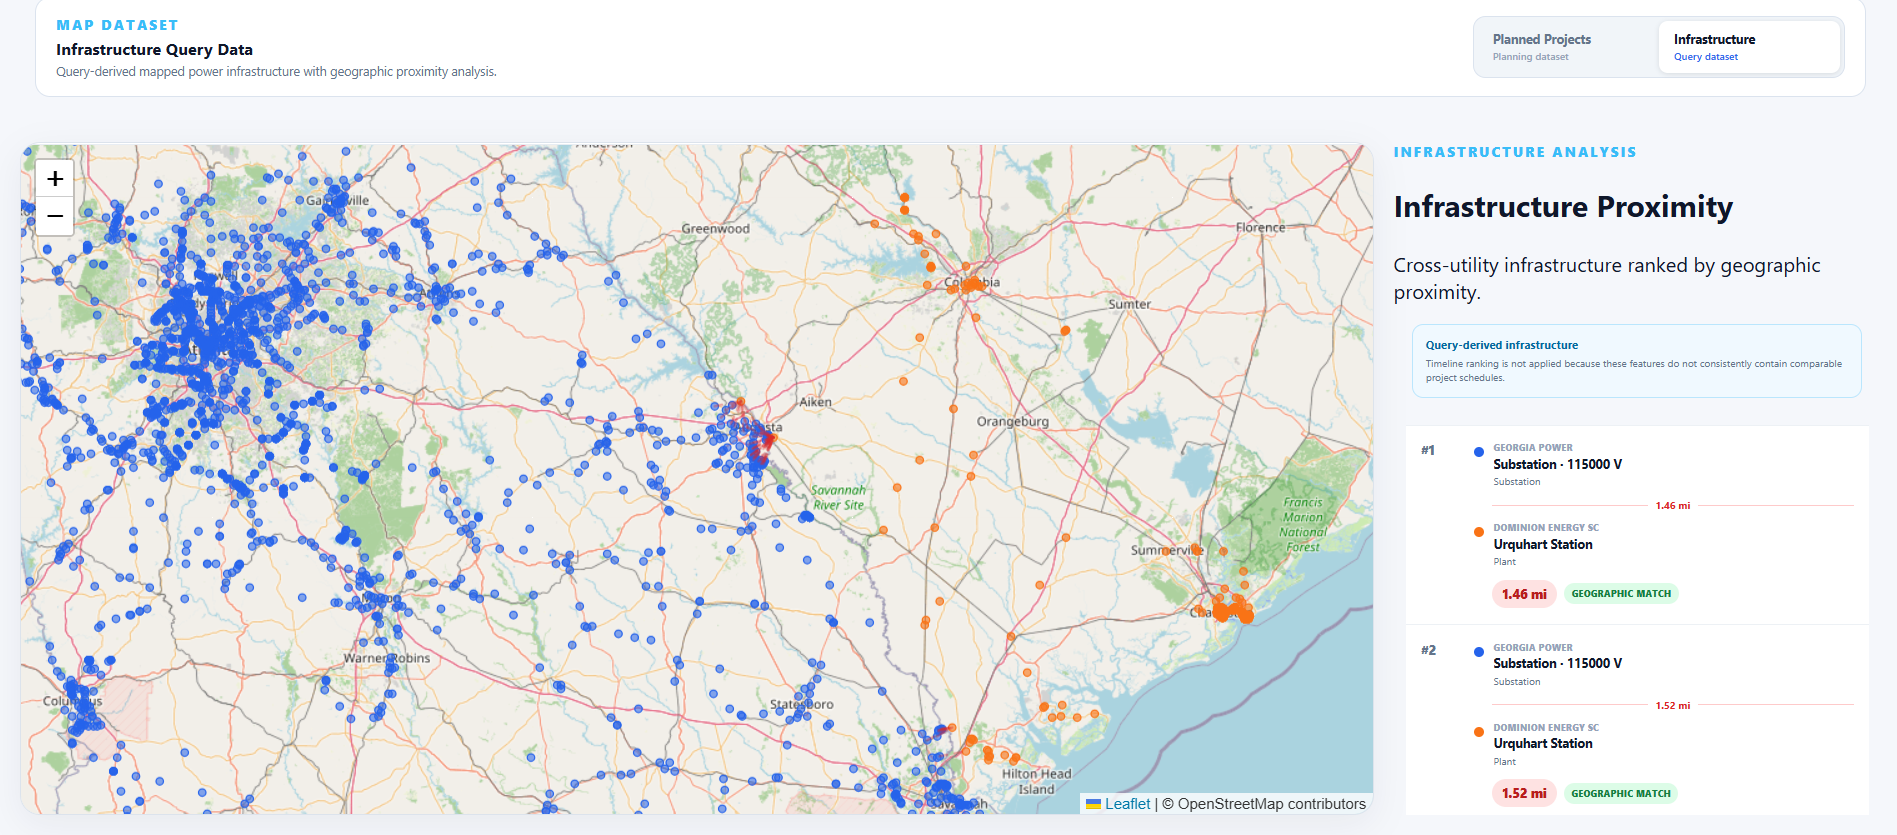
- Visualize projects on one interactive map and seamlessly move between mapped locations and detailed project information.
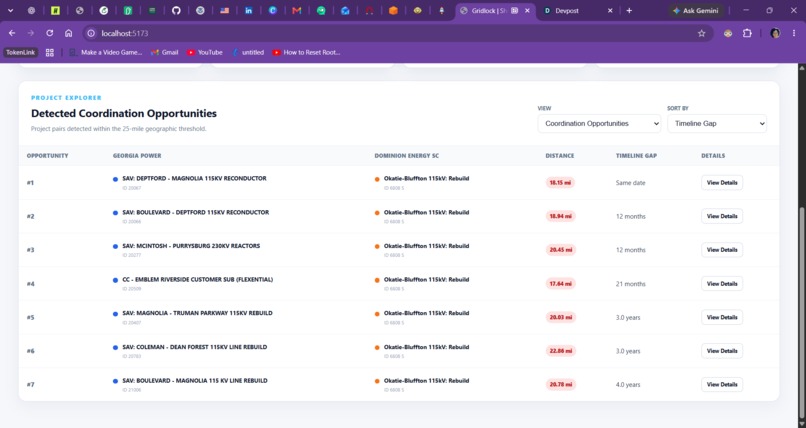
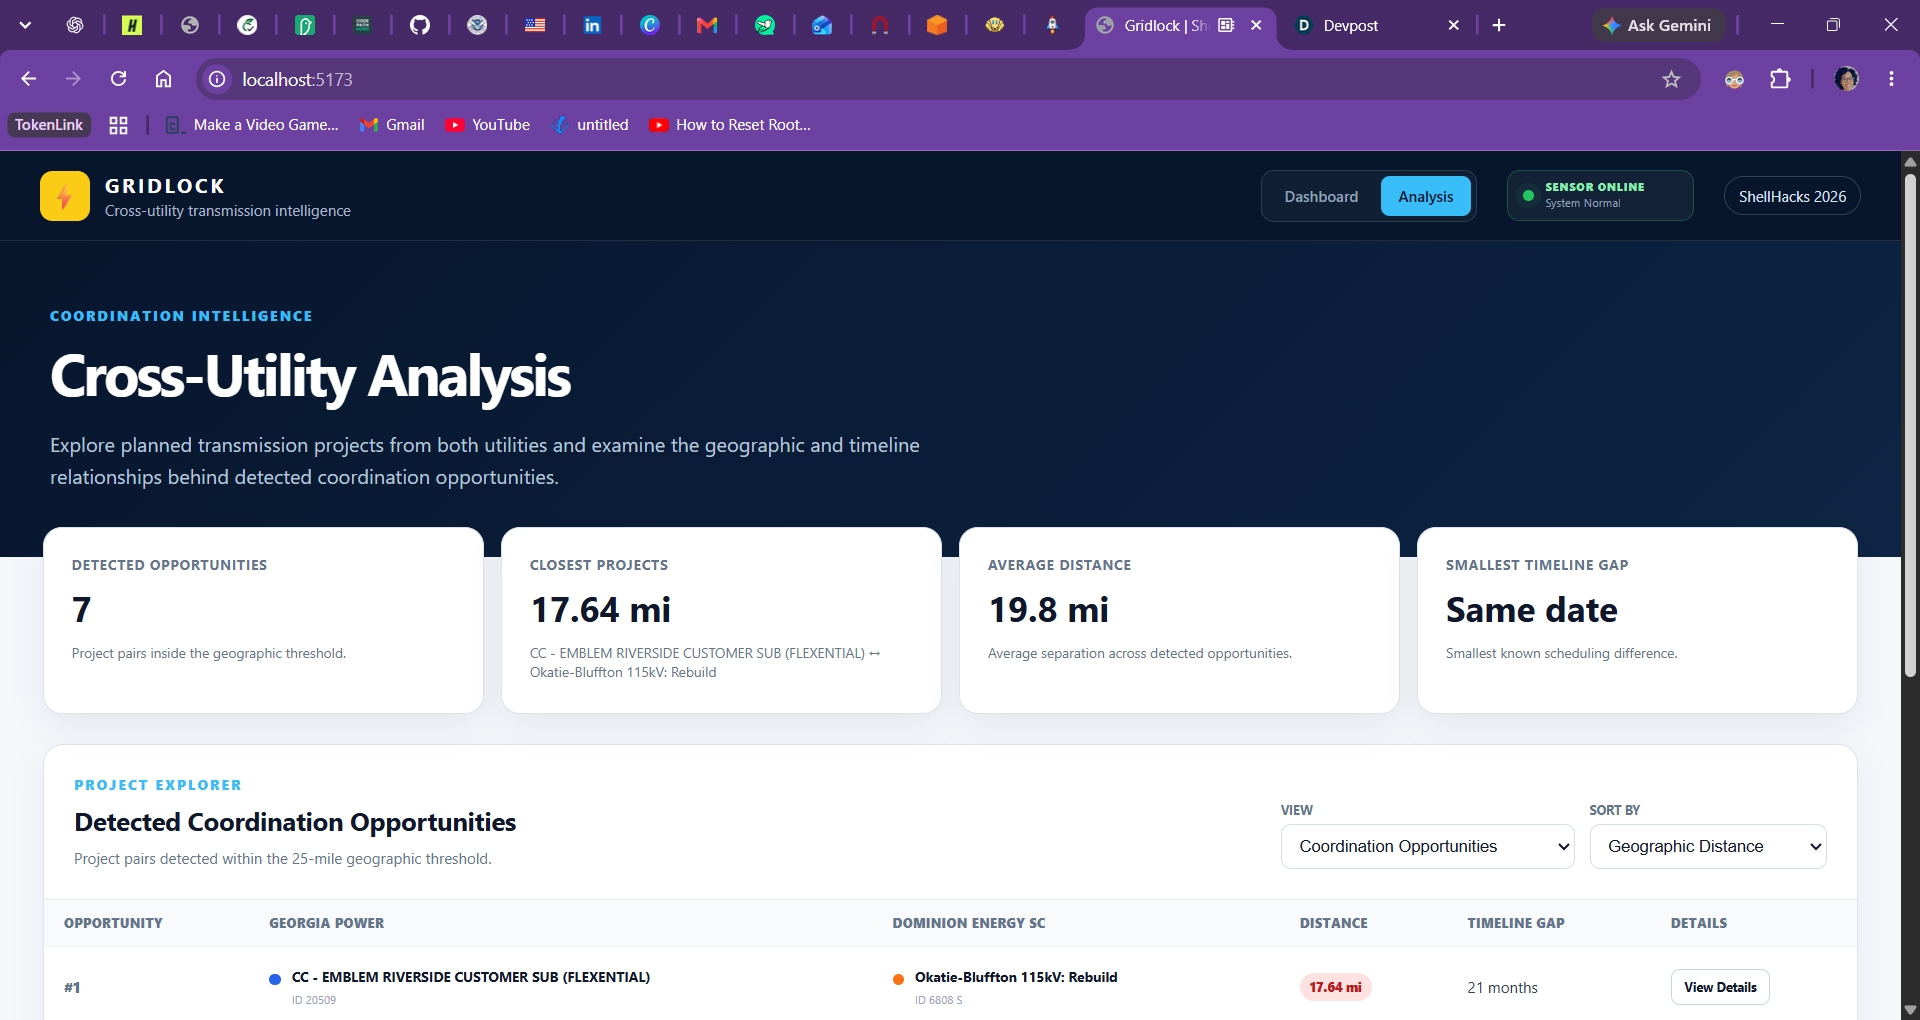
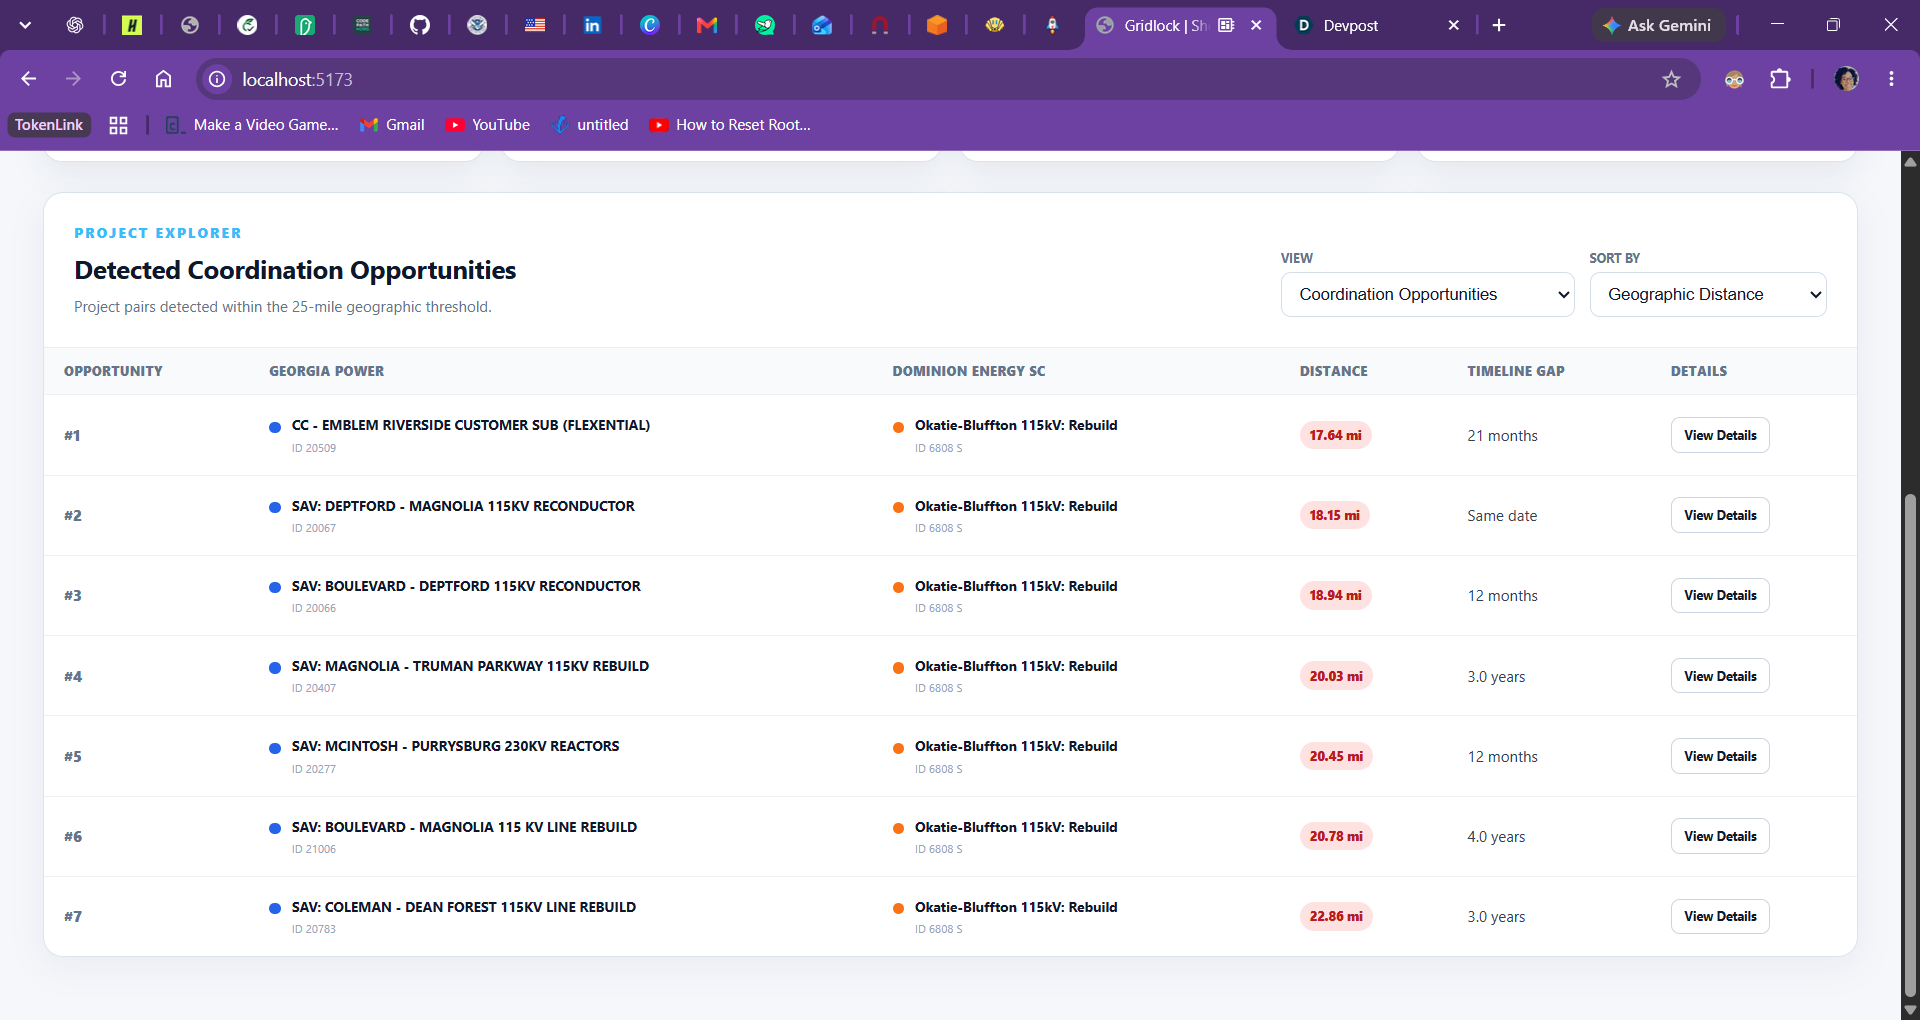
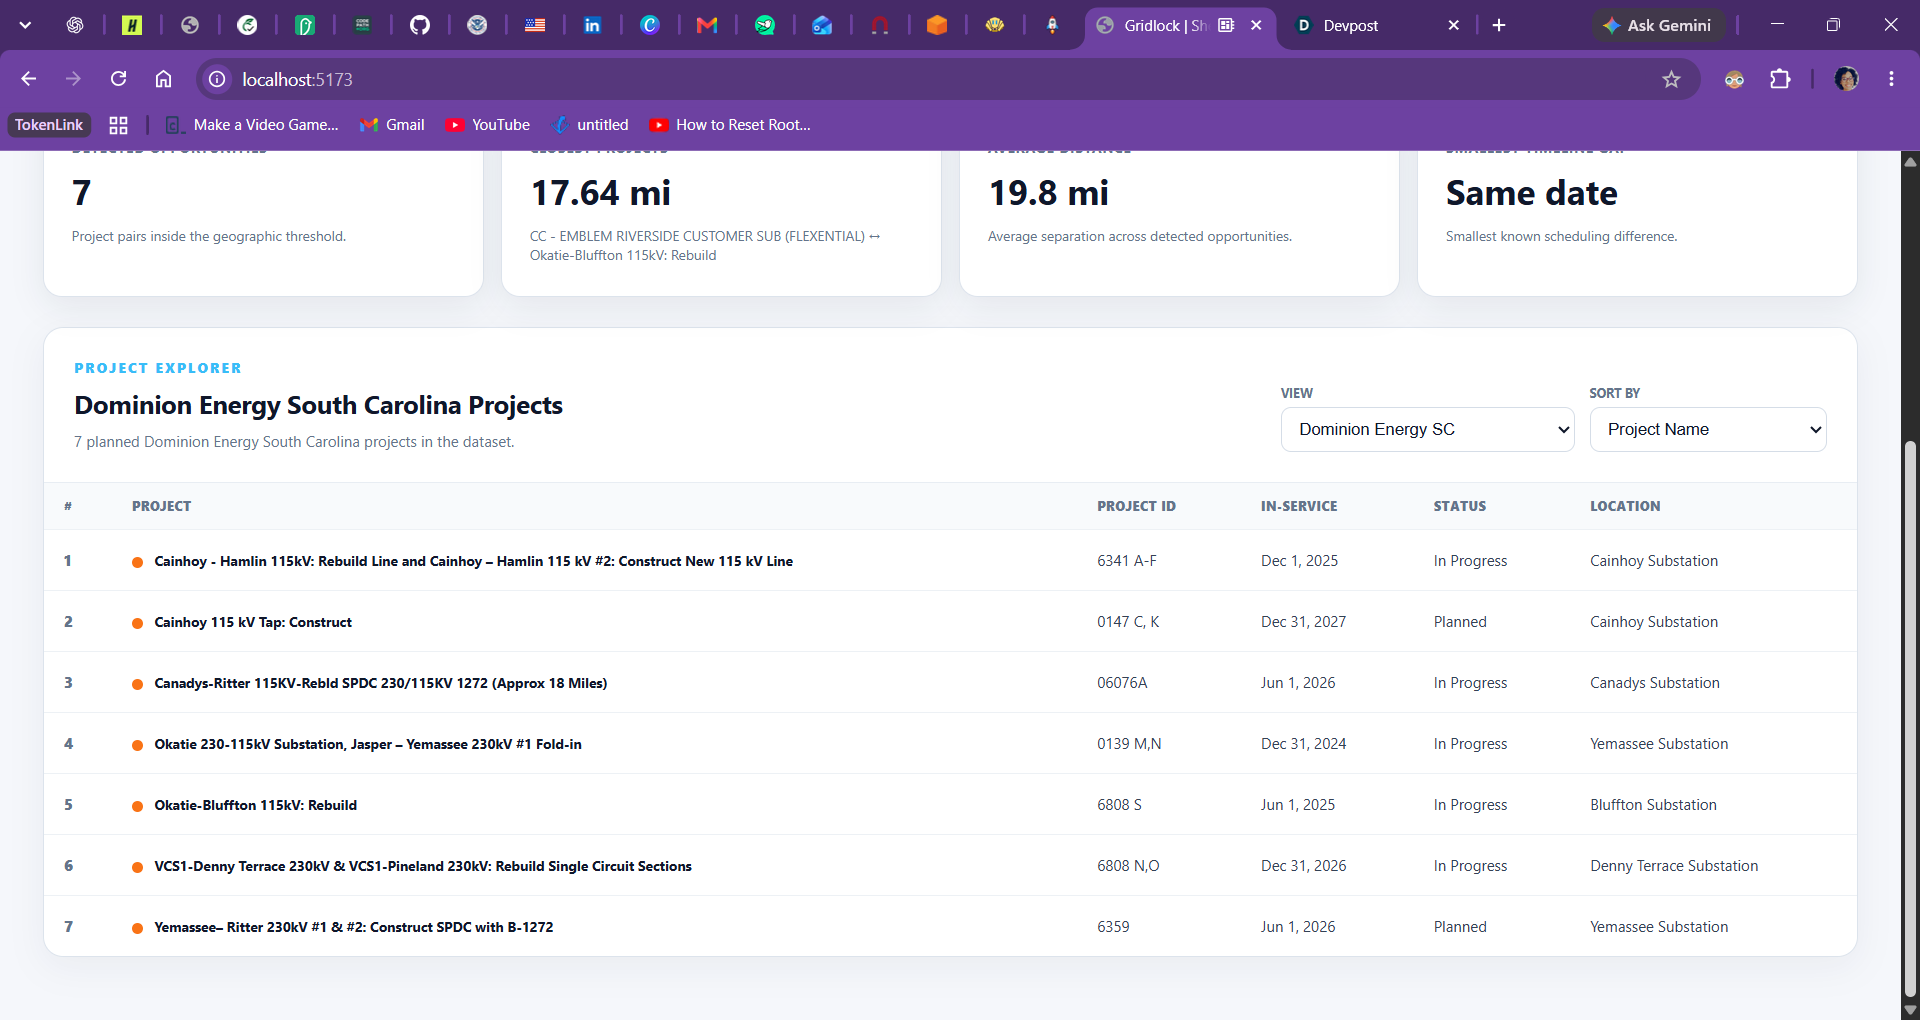
- Measure project proximity, showing how far apart projects from different utilities are and identifying meaningful geographic overlap.
- Identify collaboration opportunities and show how many potential partnerships exist across both utilities' project plans.
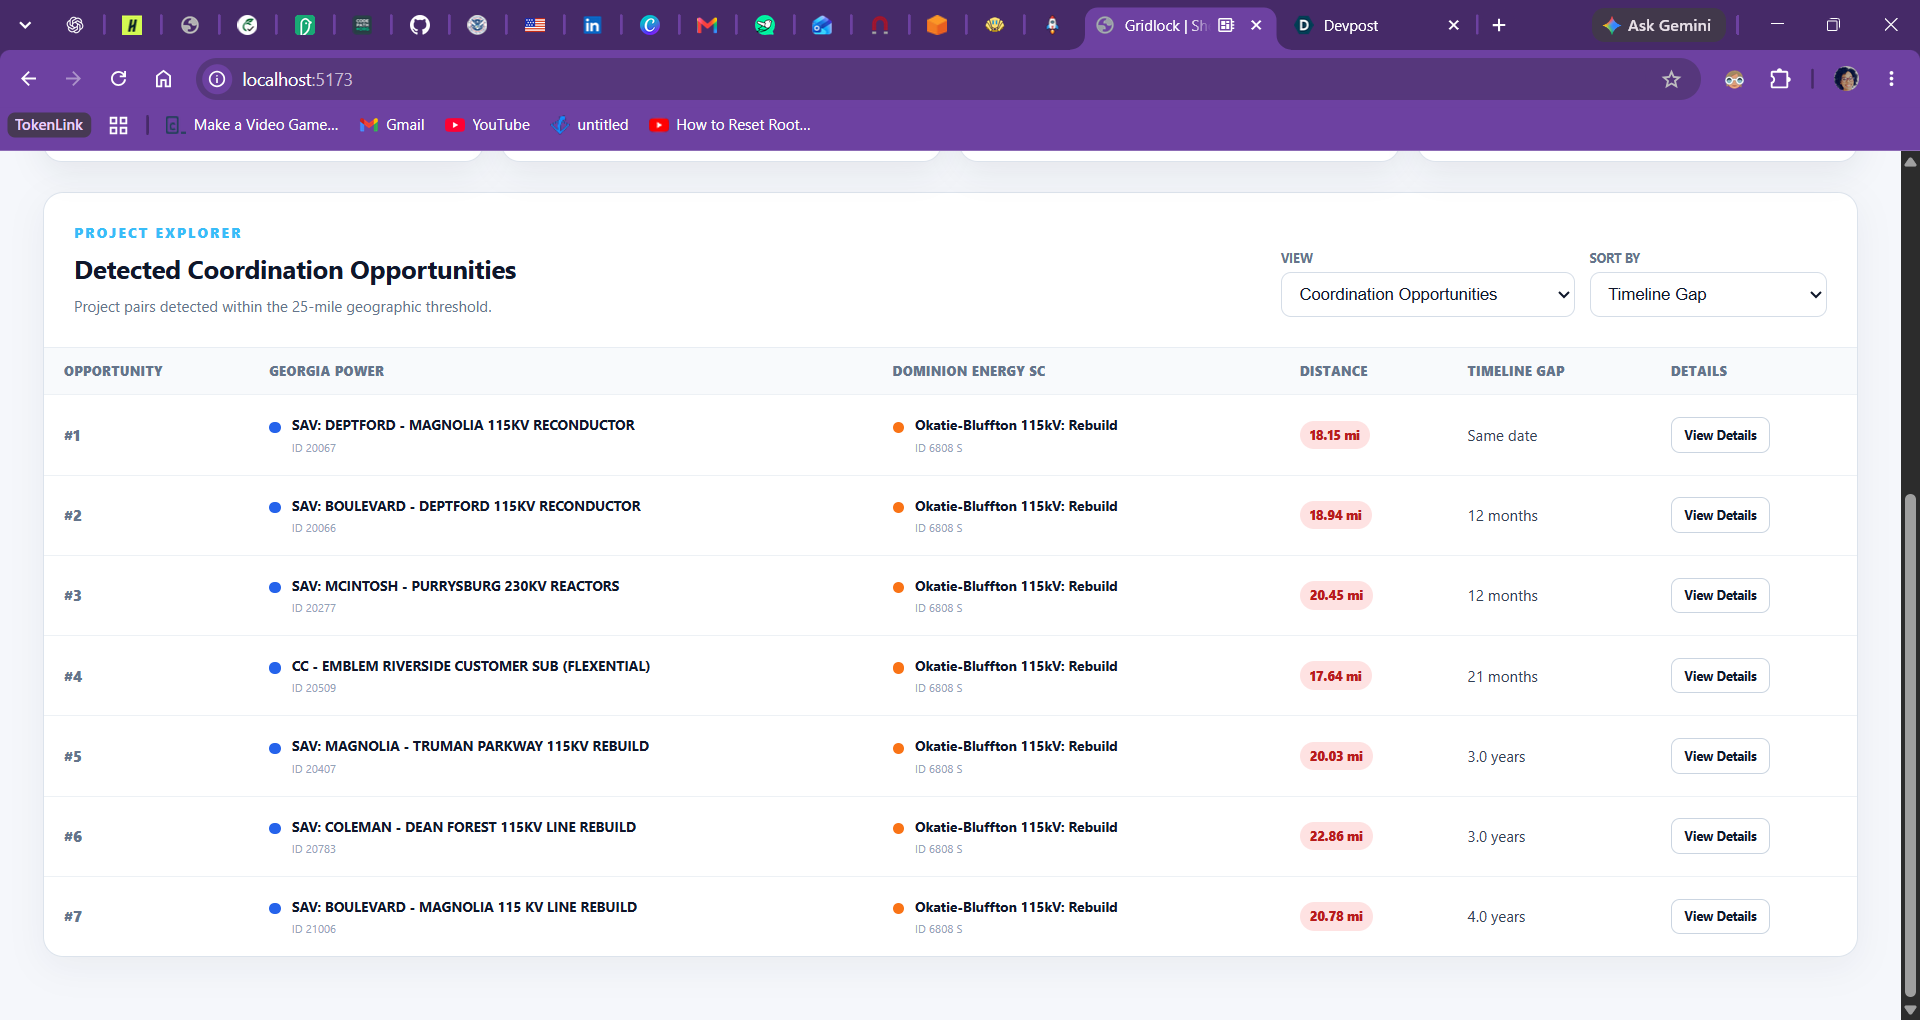
- Prioritize projects and opportunities based on factors such as project timelines, geographic overlap, and urgency, helping users quickly see which opportunities require the most attention.
- Explore detailed project information, including timelines, locations, estimated costs, crews, machinery, materials, and other required resources.
- Analyze collaborations with AI, generating estimated savings breakdowns and recommendations for where, why, and how the utilities could share resources.
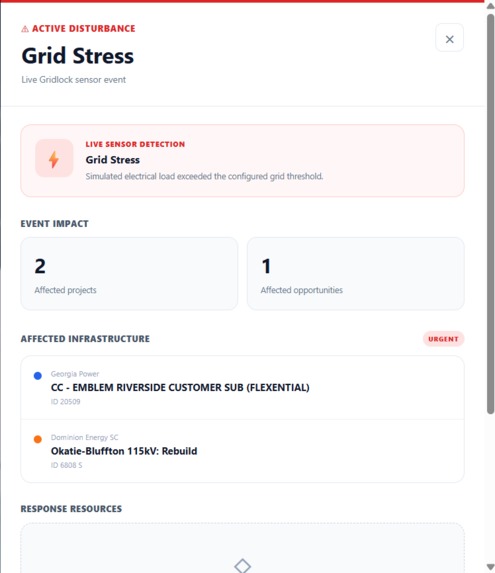
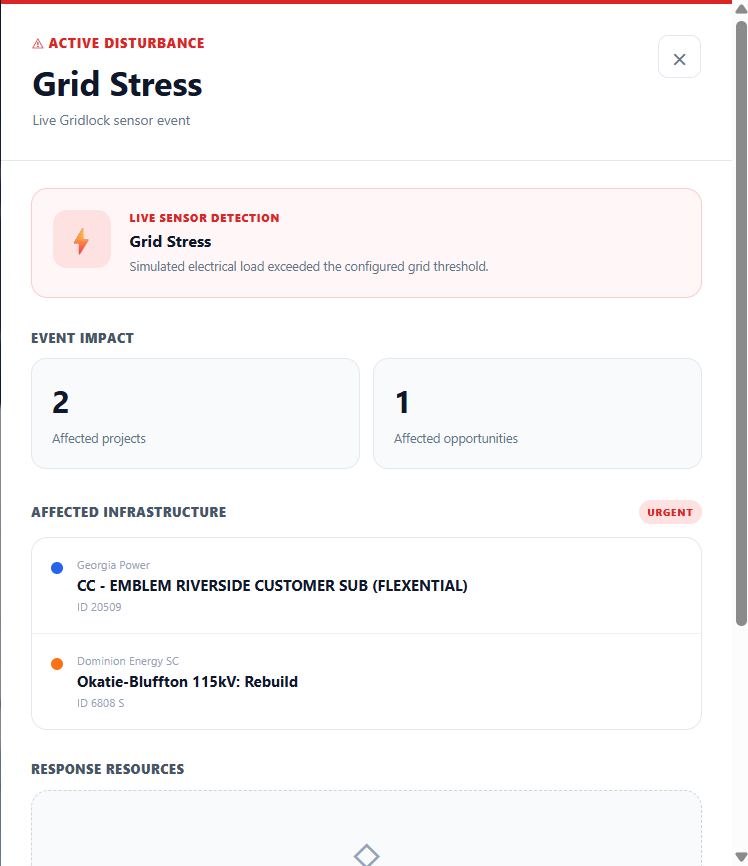
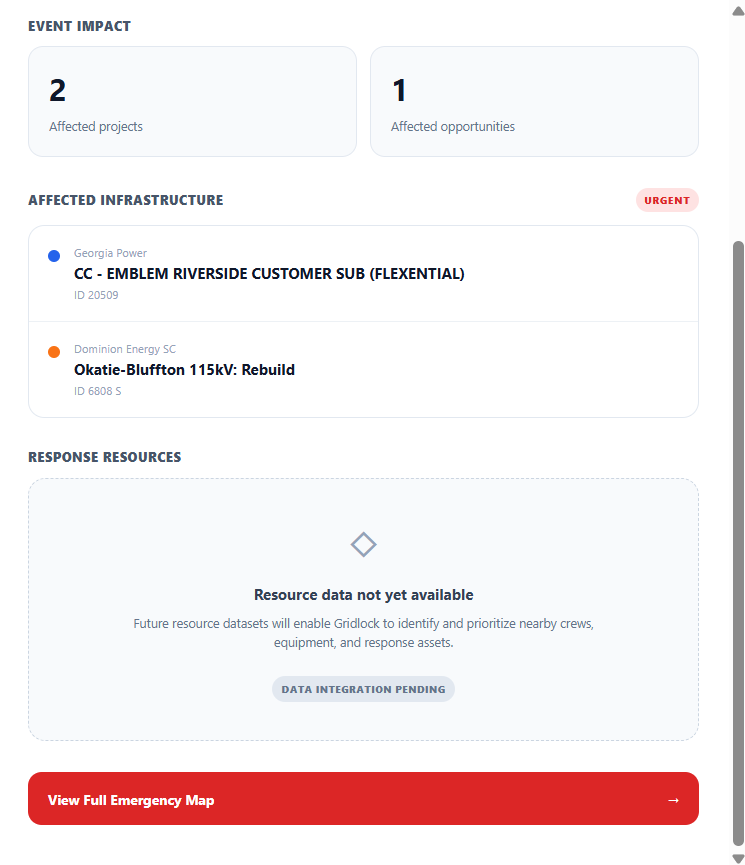
- Receive immediate emergency alerts from our integrated hardware simulation when conditions such as voltage surges, overheating, or physical infrastructure damage are detected.
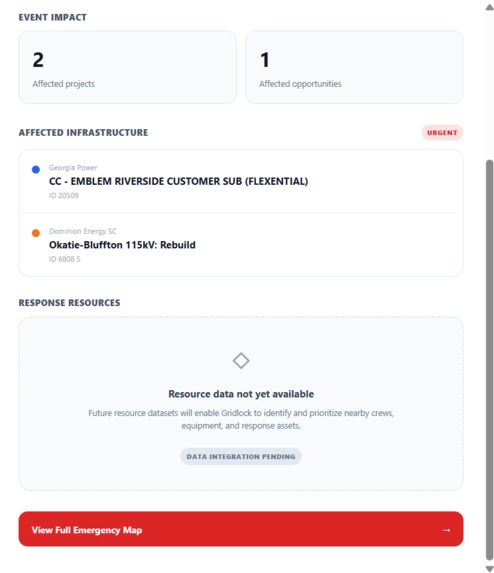
- Locate emergencies directly on the map and quickly review the incident type, location, and primary details.
- Evaluate available resources during emergencies to identify which utility may be better positioned to respond and how the other could contribute.
By connecting the map, project details, distance analysis, priority rankings, collaboration opportunities, resource information, AI recommendations, and emergency alerts, RFRK Power gives utilities both the big picture and the details needed to make informed decisions.
RFRK Power turns disconnected utility plans into coordinated action.
** 🛠️ How We Built It**
We started by researching the power and construction industries to understand how utilities plan projects, allocate resources, and respond when unexpected events disrupt those plans. From there, we cleaned and standardized public project data from Dominion Energy South Carolina and Georgia Power, allowing two differently structured datasets to work together within one system.
Our development process looked like:
Research → Clean & Standardize Data → Map Utility Projects → Detect Geographic & Timeline Overlaps → Build Dashboard → Analyze Costs & Resources → Integrate AI Recommendations → Build Hardware Simulation → Connect Emergency Alerts to Gridlock
Because detailed cost and resource information was not consistently available in the public datasets, we created sample estimated data to demonstrate Gridlock's cost-saving, resource-sharing, and collaboration analysis.
💻 Tech Stack
- React + JavaScript — Interactive frontend, dashboards, project views, collaboration opportunities, and emergency alerts
- Vite — Frontend development and build tooling
- Python — Data cleaning, processing, geographic calculations, and overlap detection
- HTML + CSS — Interface structure, styling, and responsive design
- C++ / Arduino — Hardware programming and sensor-based emergency simulations
- Supabase — Backend database and data management
- Google Gemini API Key — AI used to provide cost analysis breakdown
- JSON + GeoJSON — Structured project data and geographic mapping
- Arduino Uno — Physical prototype and sensor integration
- Potentiometer, Thermistor & Tilt Sensor — Simulating voltage, temperature, and physical infrastructure emergencies
Together, these technologies allowed us to connect utility planning, geographic data, financial analysis, AI, and physical sensor events into one coordinated platform.
** 🧩 Challenges We Faced**
One of our biggest challenges—and favorite parts of the experience—was entering an industry none of us knew much about. We had to learn how utilities plan projects, allocate resources, respond to emergencies, and operate within real-world constraints. The more we learned about the industry, the more our vision for Gridlock evolved.
Some of our biggest challenges included:
Making Different Data Speak the Same Language: Dominion Energy South Carolina and Georgia Power published their project information differently, requiring us to clean and standardize the datasets before comparing them.
Working With Missing Data: Public data did not include every detail we needed, particularly costs and resource requirements. We created clearly identified sample estimated data to demonstrate these features without presenting estimates as real utility figures.
Defining What "Overlap" Really Means: Proximity alone does not make two projects a good collaboration opportunity. We had to consider distance, timing, resources, costs, and operational context.
Turning Simple Hardware Into a Real-World Simulation: We had to creatively use our potentiometer, thermistor, and tilt sensor to represent larger events such as voltage issues, overheating, and physical infrastructure damage.
Connecting Hardware to Software: We had to turn physical sensor triggers into immediate Gridlock alerts that communicate the incident, location, and relevant resources.
Bringing Everything Together: One of our biggest technical challenges was connecting our mapping, datasets, cost analysis, AI recommendations, resource information, and hardware into one cohesive system.
Each challenge pushed us to learn something new and ultimately helped shape Gridlock into a more thoughtful solution.
🏆 Accomplishments That We're Proud Of
Building beyond the challenge: We started with detecting project overlap and expanded the idea into a platform that also considers costs, resources, collaboration opportunities, and emergency response.
Connecting hardware and software: We successfully turned physical sensor triggers into immediate alerts within our platform, connecting our Arduino simulation to a real user-facing workflow.
Making our data actionable: Instead of only showing where projects overlap, we built tools that help explain why collaboration matters, what could be shared, and how much could potentially be saved.
Integrating AI into the decision-making process: Our AI agent can analyze project costs and resources and provide recommendations for potential collaboration.
Learning as we built: We entered the challenge with limited knowledge of the utility and construction industries and were able to turn what we learned into features that strengthened our solution.
Creating one connected system: We are especially proud that our map, project data, collaboration analysis, AI recommendations, savings visualization, and hardware alerts all contribute to the same goal rather than existing as separate features.
RFRK Power taught us that building a strong technical solution starts with understanding the problem before writing the code. Learning about an unfamiliar industry pushed us to ask better questions and continuously rethink our original ideas.
We also strengthened our skills in React, JavaScript, Python, data processing, geographic analysis, Arduino/C++, hardware-software integration, Supabase, and AI integration.
Most importantly, we learned that innovation does not always mean creating more. Sometimes the better solution is finding smarter ways to connect, coordinate, and maximize what already exists.
🚀 What's Next for RFRK Power
We see this prototype as the beginning of a much larger utility coordination ecosystem. Some of our next goals include:
Intelligent Scheduling: Build a project management and scheduling system that allows utilities to schedule, reschedule, and optimize long-term projects as conditions and resource availability change.
Mobile & Tablet Support: Expand the platform across phones and tablets so planners, supervisors, and field teams can access critical information wherever they are.
Real-World Sensor Integration: Move beyond simulated emergencies by connecting Gridlock to real IoT sensors, grid telemetry, and infrastructure monitoring systems.
More Utility Partners: Scale beyond two companies to identify collaboration opportunities across larger regional utility networks.
Live Resource Management: Track the availability and location of crews, machinery, materials, and other resources to improve both planned collaboration and emergency response.
Smarter AI Recommendations: Continue developing our AI agent to consider more operational factors when recommending resource sharing, project collaboration, and emergency response strategies.


Log in or sign up for Devpost to join the conversation.