Inspiration
When one link fails, how does the whole city change?
A closed bridge or road is easy to identify on a map. Its consequences are harder to see. Traffic may move onto other corridors, congestion may increase elsewhere, and some communities may lose convenient access to hospitals, stations, or shelters.
I wanted to make these network-wide effects easier to explore, especially for students, educators, and people running urban-planning or disaster-preparedness workshops. ResiliRoute turns a transportation network into an interactive experiment: change the available infrastructure, observe the consequences, and compare possible responses.
This is an evolved version of ResiliRoute, which I previously submitted to ImpactHack 2026. The project has since expanded beyond its original synthetic city to include real-road data, scenario comparison, budget-constrained recovery planning, and uncertainty analysis.
What it does
ResiliRoute is a bilingual urban mobility resilience simulator and educational decision-support prototype.
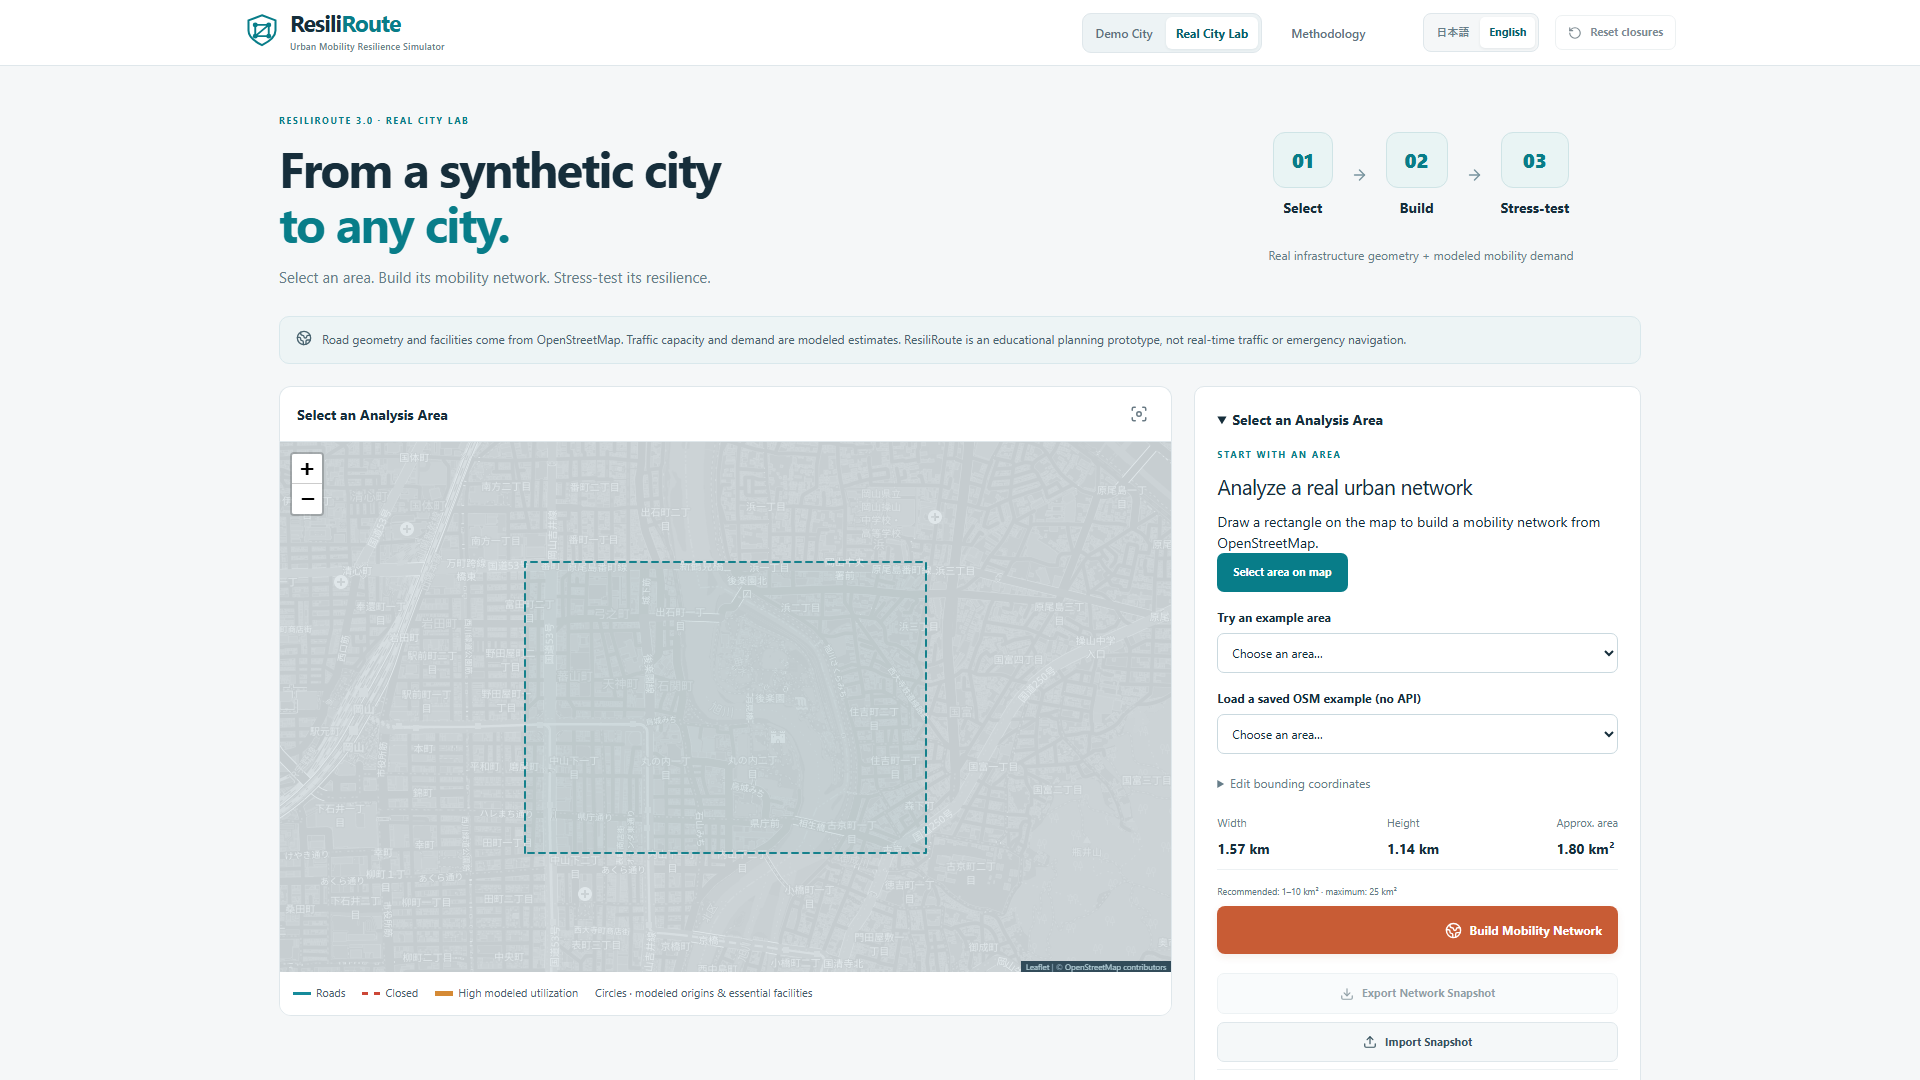
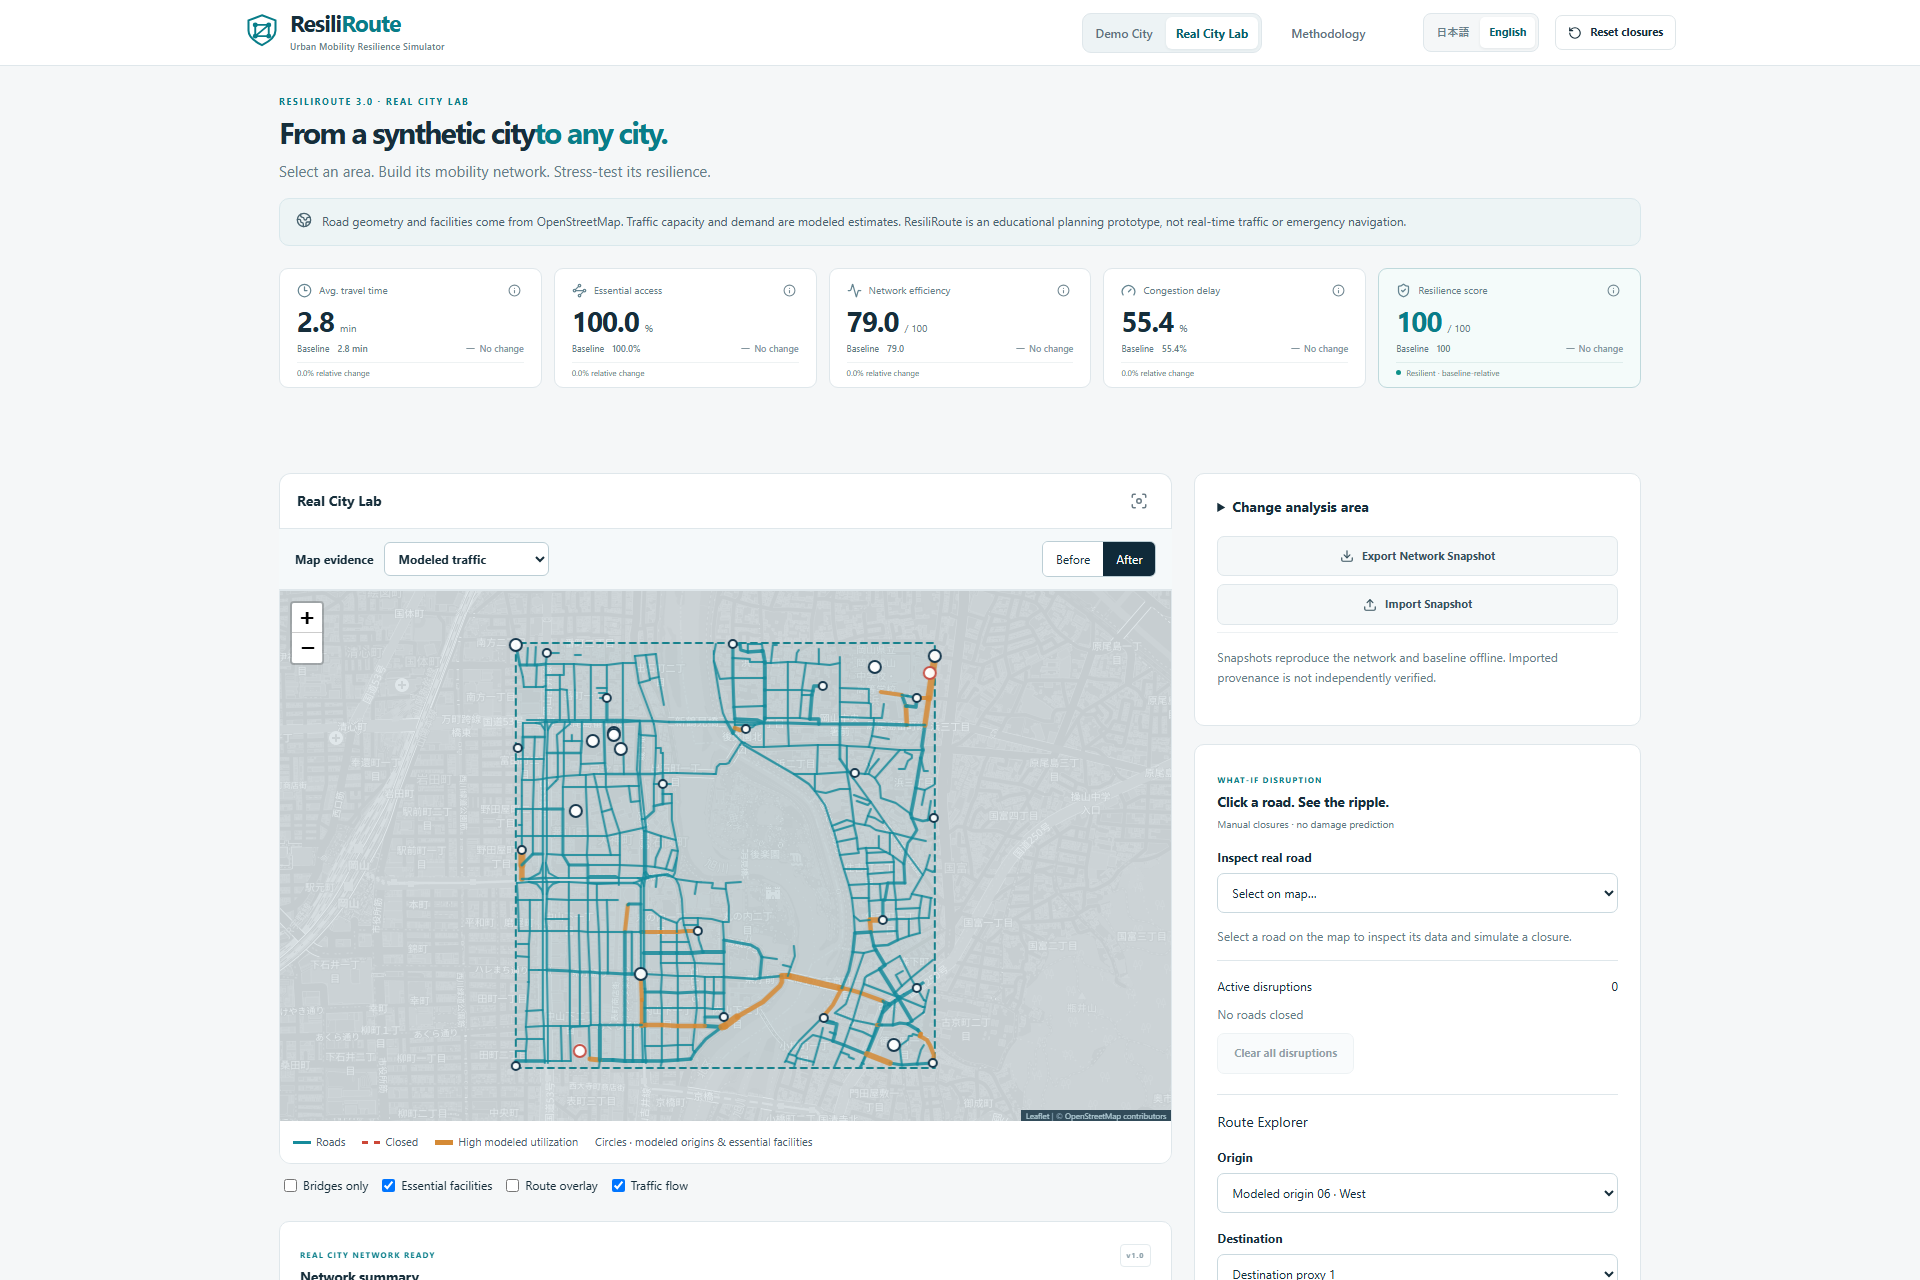
Users can begin with Harbor City, a reproducible synthetic demonstration network, or open Real City Lab to work with a small real-world area. Real City Lab supports map-based selection, coordinates, OpenStreetMap map URLs, saved network snapshots, and local OSM data-file imports.
The main workflow is:
Select an area → Disrupt links → Understand the impact → Compare scenarios → Explore recovery.
Users can:
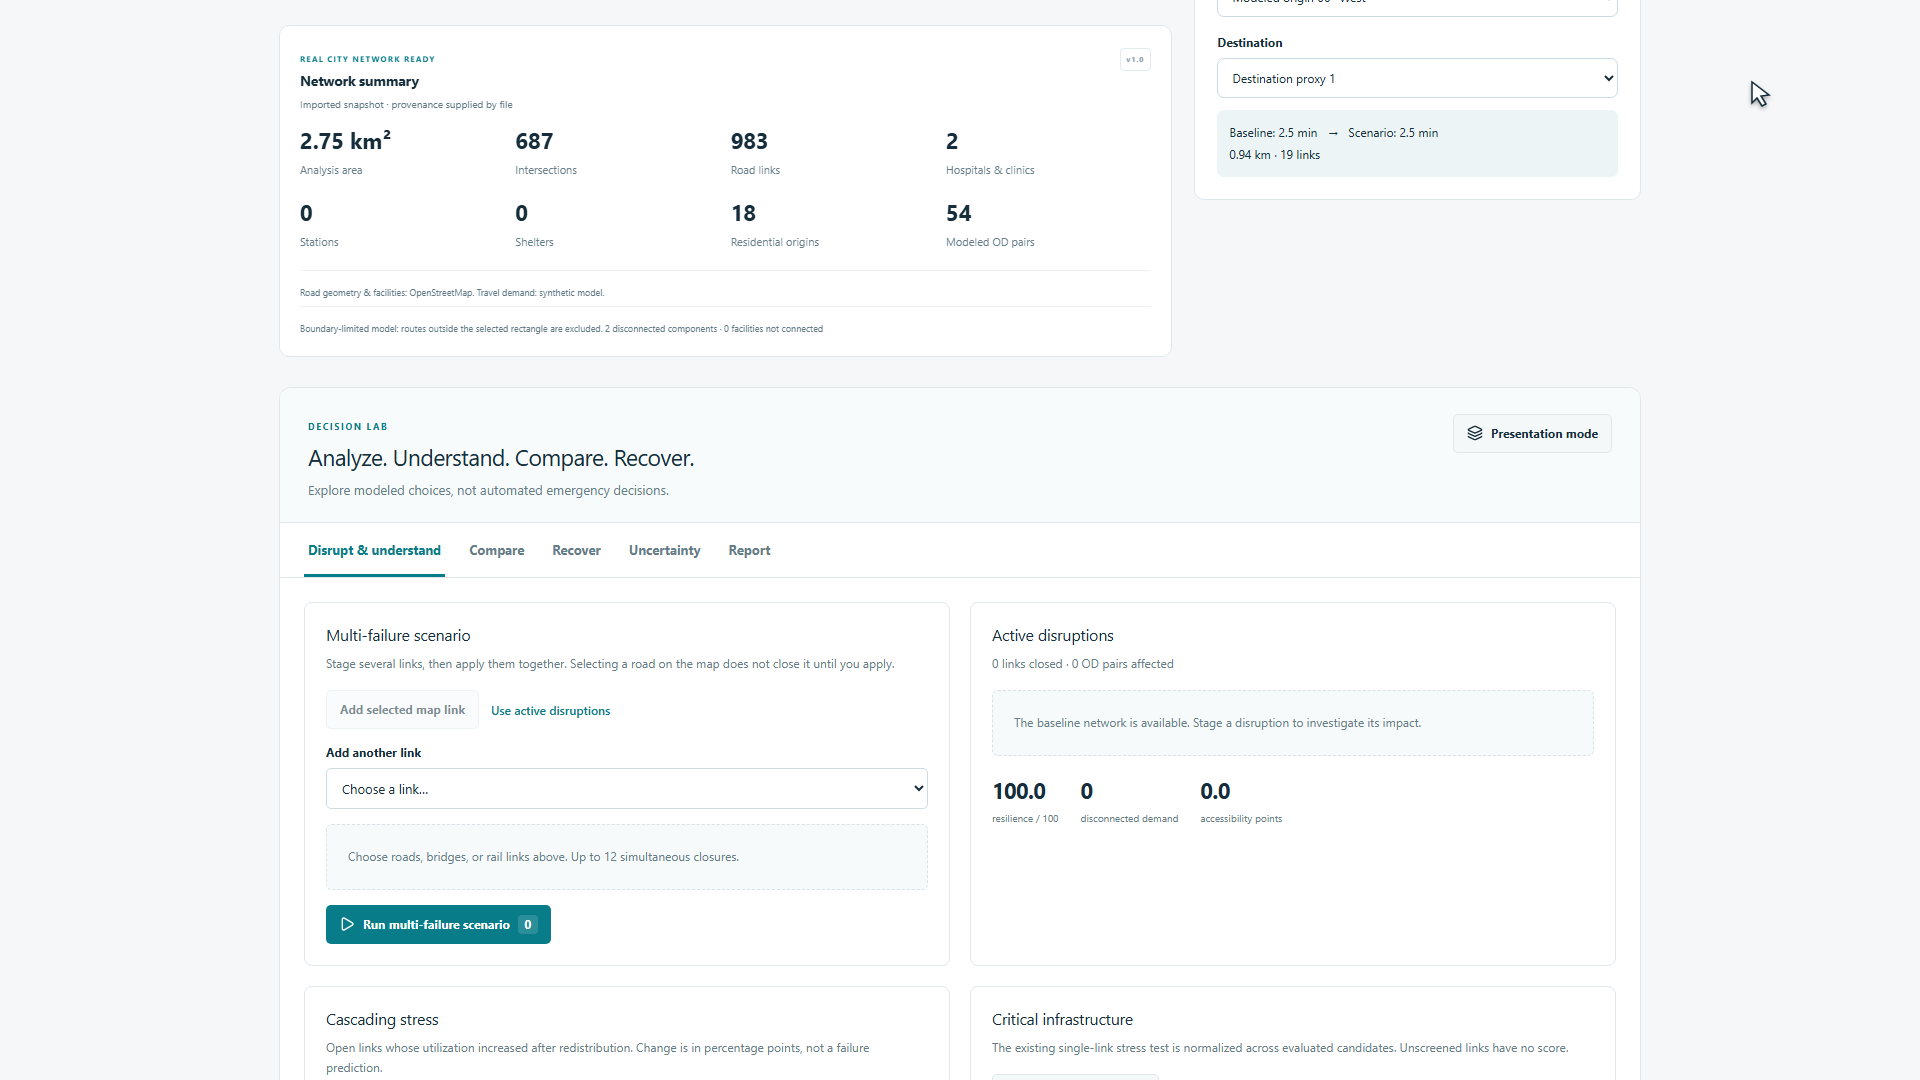
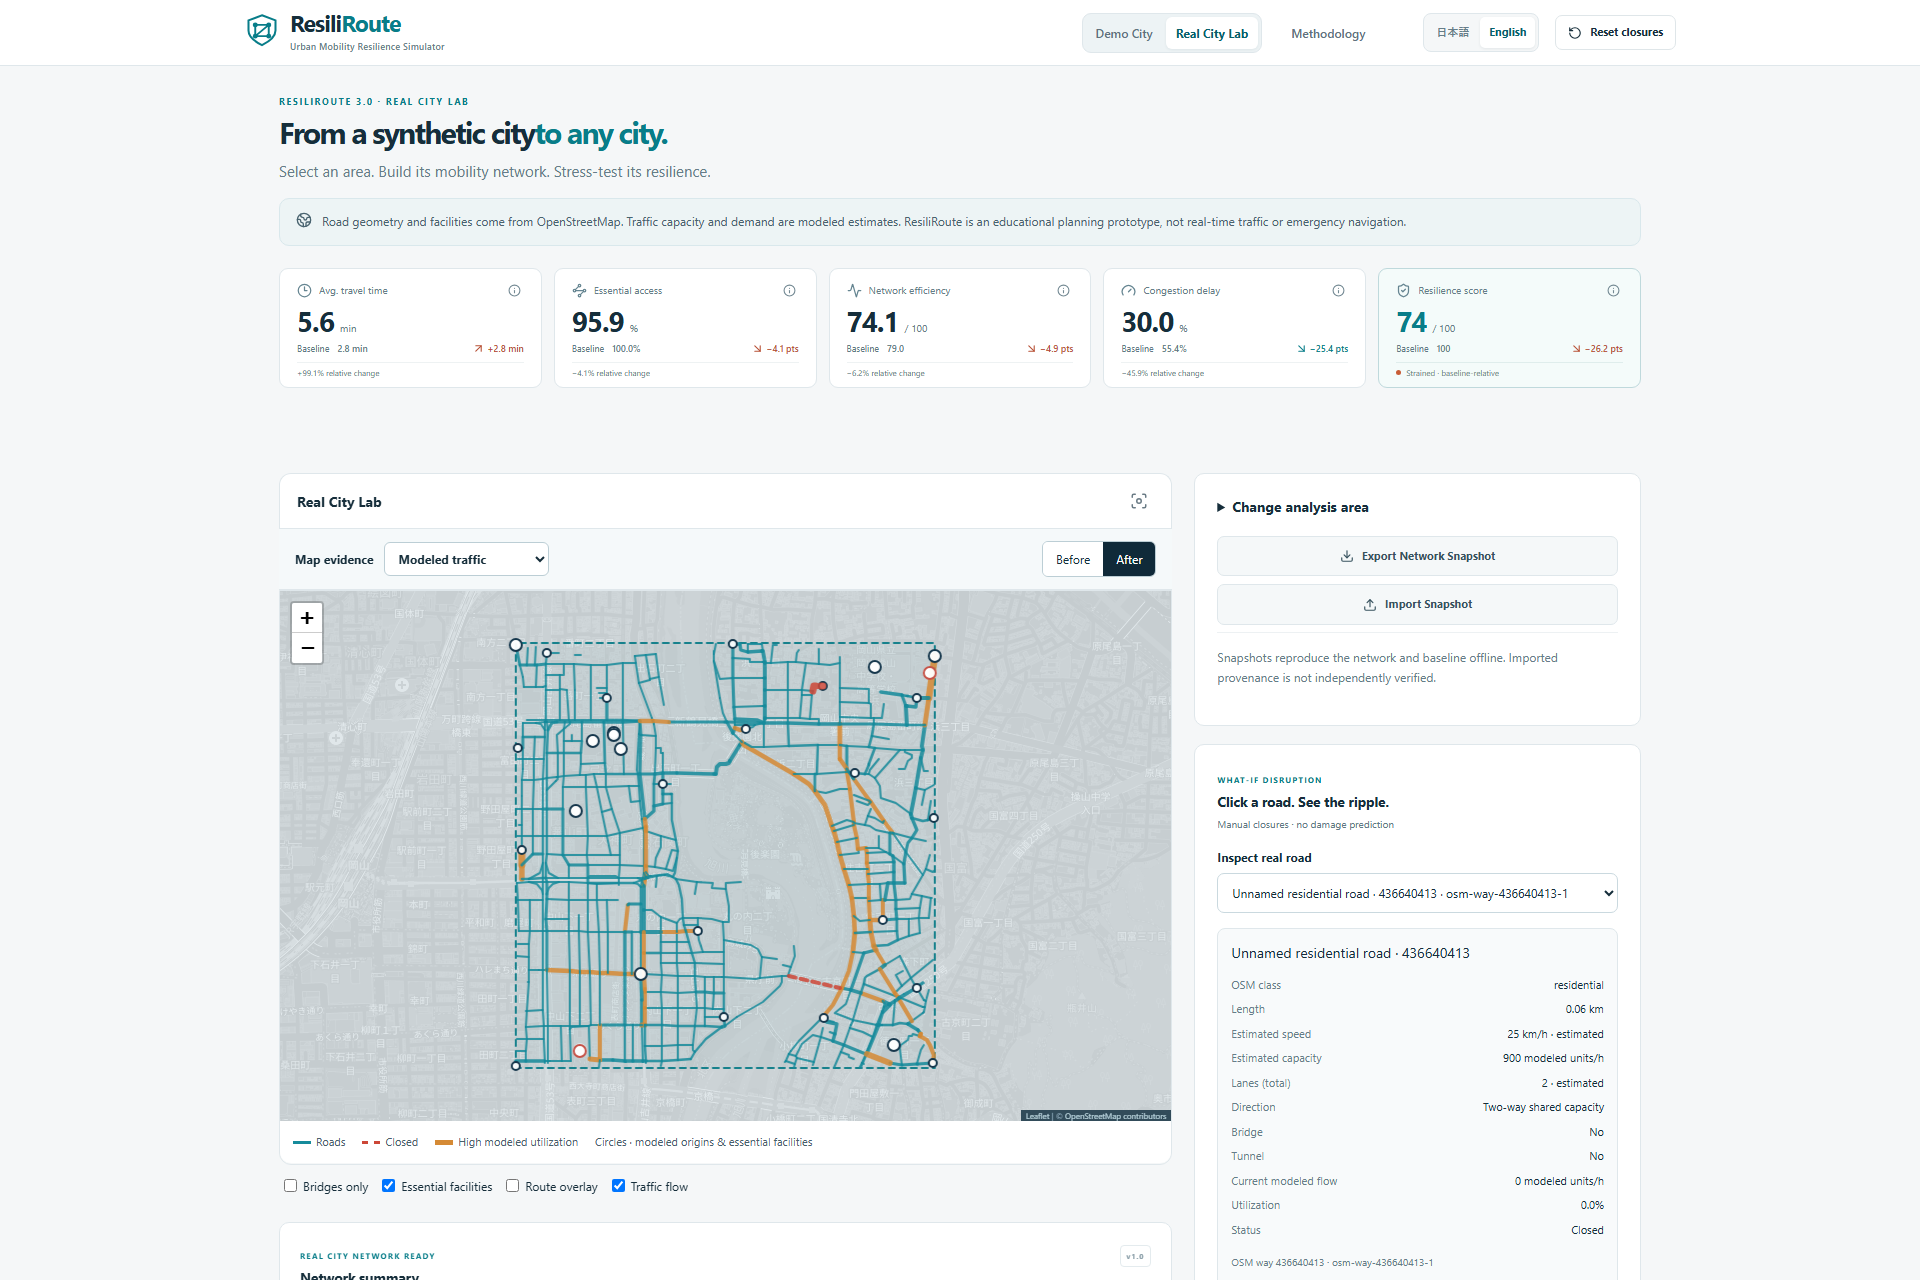
- Close one or several transport links and recalculate how modeled travel demand moves through the remaining network.
- Compare baseline and disrupted travel time, congestion, essential-service accessibility, network efficiency, and resilience.
- Inspect critical links and identify roads experiencing additional stress after a disruption.
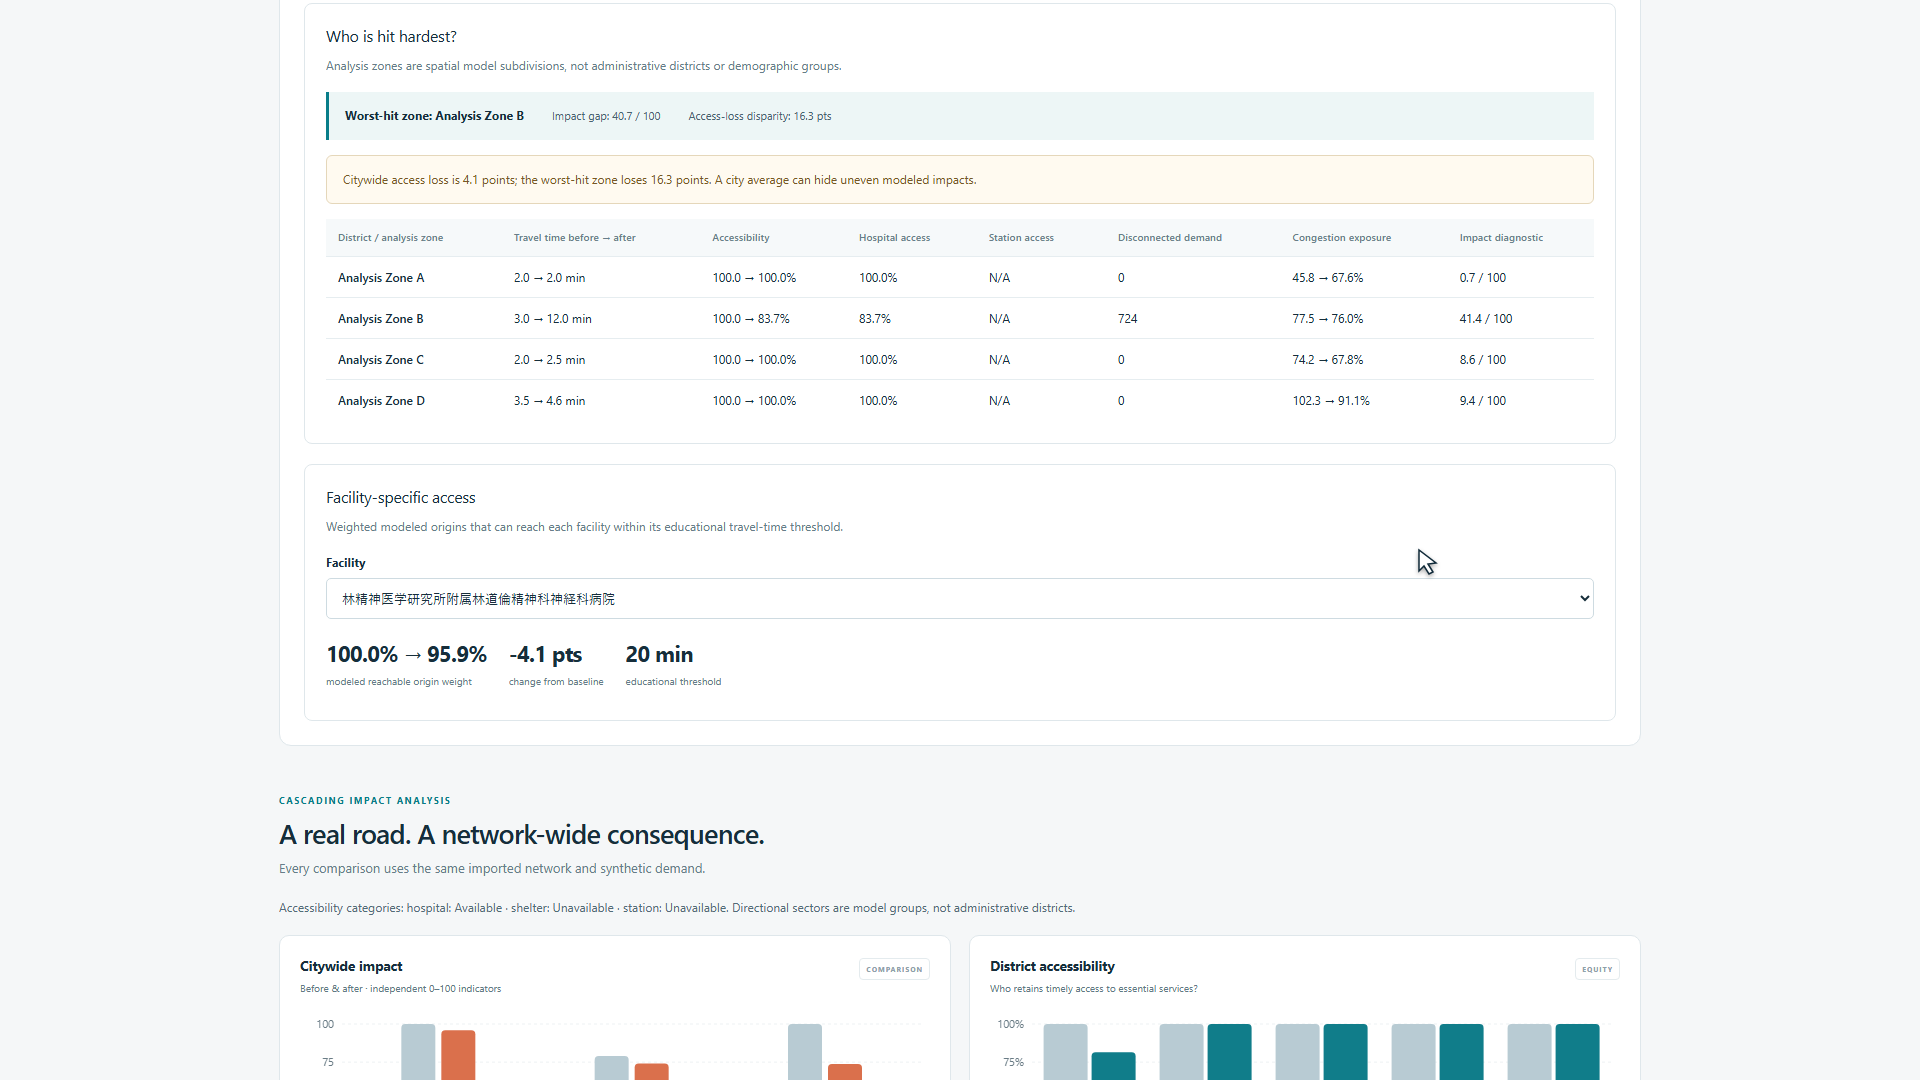
- Compare impacts across districts or neutral analysis zones and examine access to individual facilities.
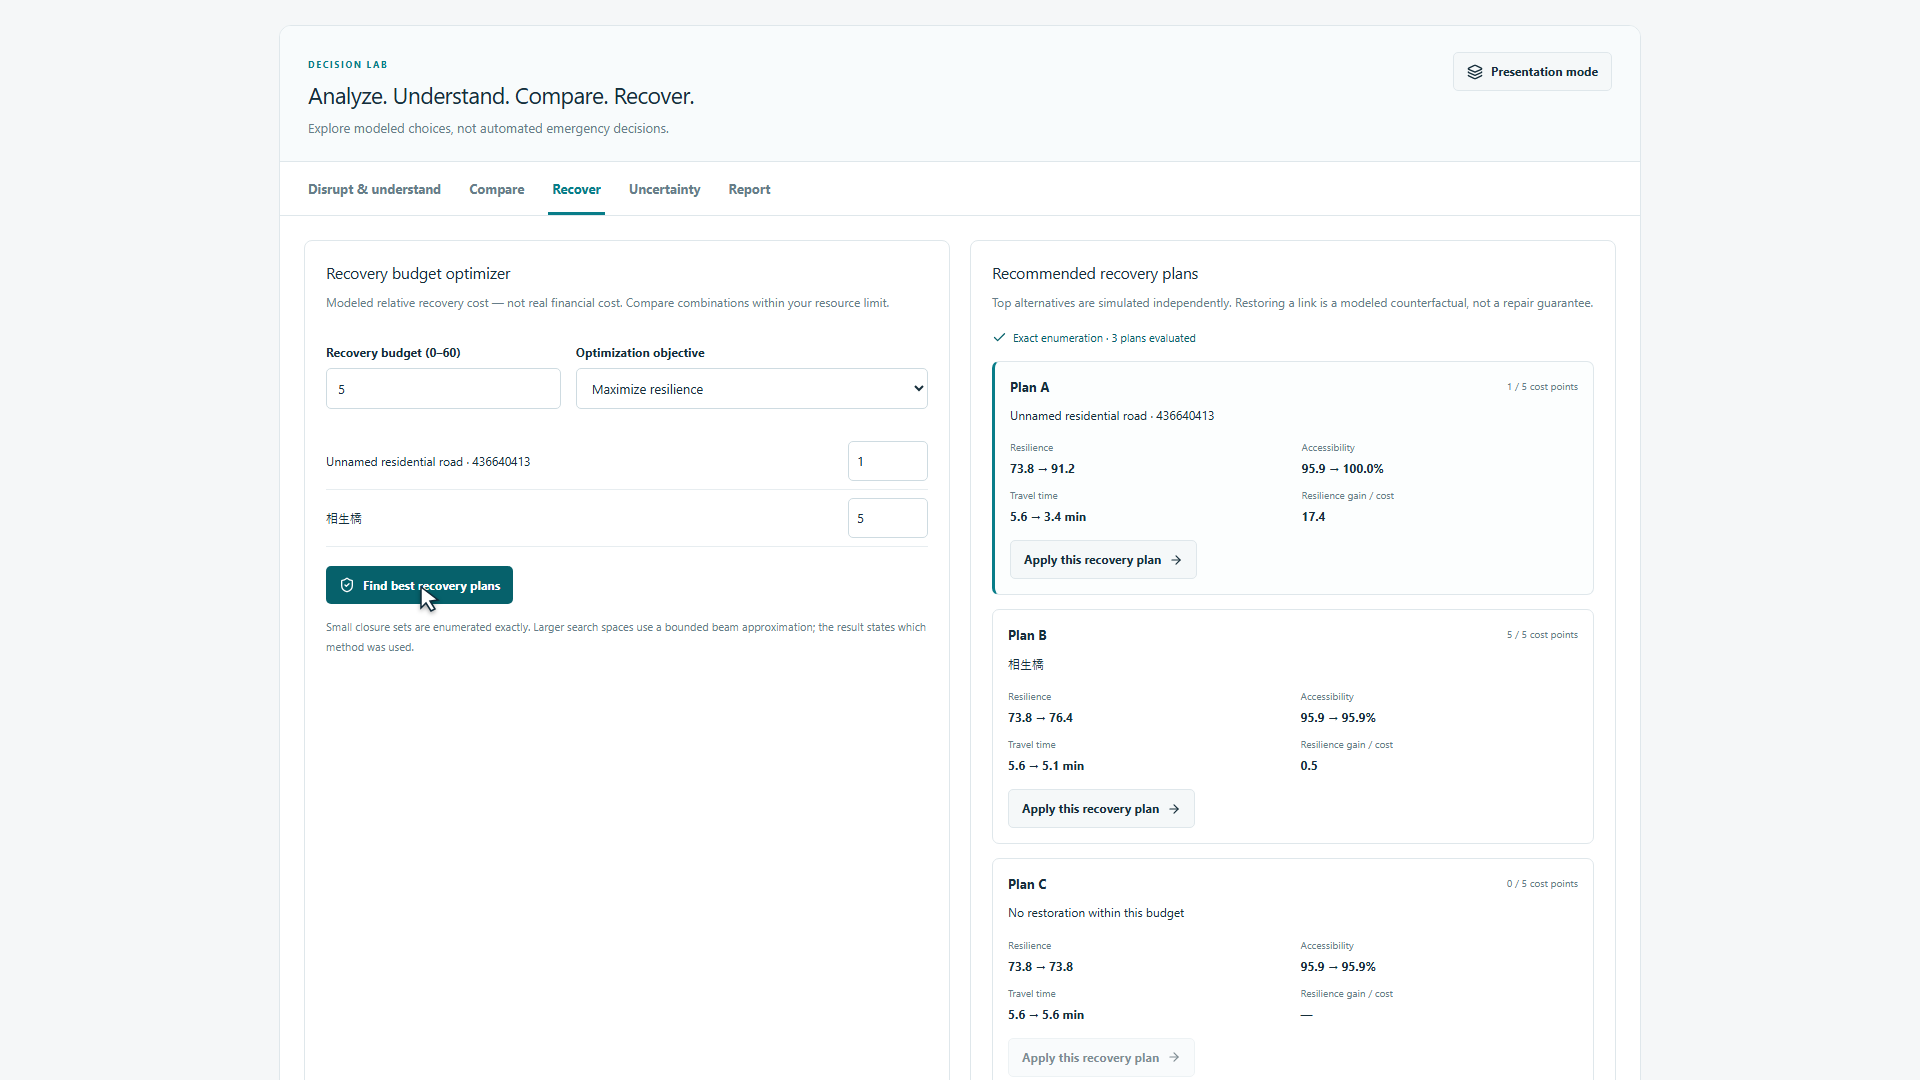
- Set a recovery budget using relative cost points and compare affordable repair combinations.
- Explore recovery stages and test shortlisted plans under user-defined uncertainty assumptions.
- Save scenarios and export printable reports, CSV tables, and analysis JSON.
The distinction between data and assumptions is central to the product: real road geometry does not mean real observed traffic. Real City Lab uses OpenStreetMap infrastructure and facility data, while traffic demand and road capacity are modeled estimates.
How we built it
I developed ResiliRoute as a solo student project with extensive AI-assisted development.
The application uses Next.js App Router, React, strict TypeScript, Leaflet, OpenStreetMap, Recharts, and Tailwind CSS. Both city modes reuse the same simulation engine rather than maintaining separate calculation systems.
Road intersections become graph nodes, and road segments become edges. The OSM importer preserves detailed road geometry, handles supported one-way restrictions, estimates missing road attributes, and connects nearby facilities to the network.
Dijkstra-based routing finds available paths. An iterative origin-destination demand-assignment process redistributes modeled trips. A bounded BPR-style congestion function updates travel costs using the relationship between assigned flow and estimated capacity.
The engine then calculates accessibility, efficiency, and baseline-relative resilience. Unreachable trips receive a disclosed modeled penalty so that disconnected journeys do not simply disappear from the travel-time metric.
Critical-link analysis tests the consequences of removing individual links. Recovery planning evaluates affordable repair sets exactly for small problems and uses a disclosed bounded approximation for larger ones. Seeded uncertainty experiments make results reproducible. Longer calculations run in workers with progress reporting and cancellation.
AI serves as an interpretation layer. Optional server-side language-model access can turn structured simulation evidence into a concise resilience brief. A deterministic local analyst provides an explanation when no API key is configured or the external service fails. Numerical results always come from the simulation.
Challenges we ran into
The first challenge was converting real map data into a usable network. Roads contain many points that describe shape but do not represent intersections. One-way rules, disconnected components, missing attributes, and facilities located away from road nodes all required careful handling.
A second challenge was preserving the original application while adding more advanced analysis. Shared types, pure calculation functions, regression fixtures, and desktop/mobile browser tests helped keep Harbor City and Real City Lab consistent.
External-data reliability also became a practical limitation. Public Overpass services can time out or reject requests, and direct acquisition was unavailable during the latest environment checks. ResiliRoute now provides explicit errors, bounded requests, caching, saved snapshots, and local OSM-file import. A small Tokyo OSM export was successfully imported and tested through road closure, recalculation, and reset.
Another challenge was making complex results understandable without overstating them. Recovery costs are relative scores, uncertainty probabilities are user assumptions, and spatial zones are analytical groupings—not demographic evidence or predictions of actual disaster damage.
Accomplishments that we're proud of
- Expanded a fixed synthetic demonstration into a reusable workflow for supported real-world road areas.
- Connected disruption, access loss, scenario comparison, and recovery planning in one application.
- Added budget-constrained recovery alternatives and reproducible uncertainty experiments.
- Preserved clear explanations of imported data, modeled estimates, and user assumptions.
- Verified the latest application with 120 unit/data tests, 60 desktop/mobile browser tests, lint, type checking, formatting checks, and a production build.
- Kept the core simulator and local explanations usable without an AI API key.
The most valuable result is that users can investigate a complete question: if several links become unavailable, which areas lose access, and what could a limited recovery budget improve?
What we learned
The main lesson was that realistic-looking geography is only one part of a useful model. Demand assumptions, capacity estimates, network boundaries, and missing facilities can materially change the results. Making those assumptions visible is essential.
We also learned that a citywide average can hide important local differences. Looking at individual facilities and analysis zones adds context that a single resilience score cannot provide.
Finally, recovery choices need comparison rather than intuition alone. The most prominent piece of infrastructure is not automatically the best first repair under every budget and objective. The value of the simulator is making those trade-offs inspectable.
What's next for ResiliRoute
The next priority is a small educator-led pilot. I want to test whether students can use the application to explain rerouting, identify localized access losses, and justify a recovery choice using evidence. No learning outcomes or customer adoption have been established yet.
The initial business hypothesis is a free educational core, with schools or workshop providers potentially paying for prepared lessons, custom datasets, facilitated sessions, or support. This is a proposed model, not an existing paid service.
A larger deployment would need shared caching, deployment-wide rate limiting, stronger data maintenance, and measured load testing. Browser-side simulation reduces server computation, but the current prototype does not demonstrate unlimited scale.
Other priorities include better validation against suitable reference data, clearer guidance on area boundaries, and more reliable import options.
ResiliRoute remains an educational planning prototype. It does not predict disasters, provide real-time traffic information, guarantee safe routes, or replace official emergency guidance.
AI and third-party resources
AI coding tools were used extensively for system design support, implementation, debugging, testing, documentation, and iteration. I defined the project goals, requirements, and development priorities. The project should not be interpreted as entirely hand-written code.
Road and facility data are © OpenStreetMap contributors and available under the Open Database License. Map attribution is retained, and the project uses open-source libraries with their respective licenses.
Built With
- codex
- leaflet.js
- next.js
- node.js
- openstreetmap
- react
- typescript


Log in or sign up for Devpost to join the conversation.