
Inspiration
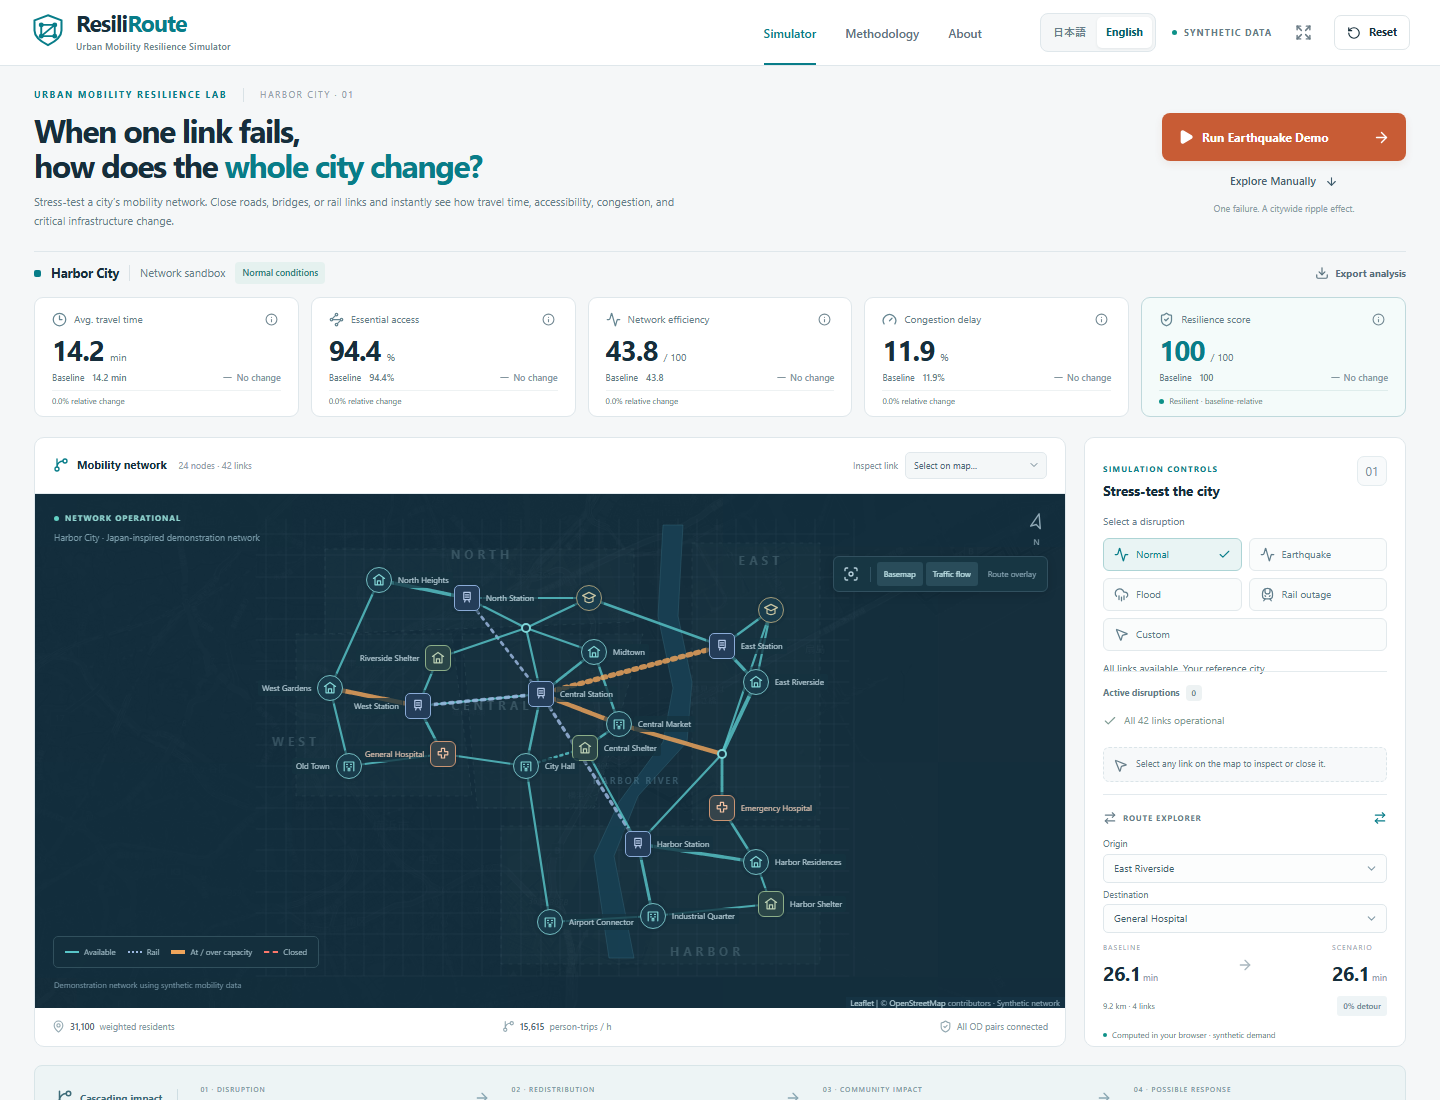
When roads, bridges, and railways become impassable, the impact isn’t limited to the areas that are cut off. Traffic can become concentrated on other roads, potentially altering travel times in distant areas and even affecting access to hospitals. I wanted to illustrate this “mechanism by which a disruption in one location spreads throughout an entire city” in a way that is easy to understand, even for non-experts. Drawing inspiration from Japan’s railways, rivers, and waterfront areas, I created ResiliRoute—a tool that allows users to learn about the strengths and weaknesses of transportation networks by actually manipulating them.
What it does
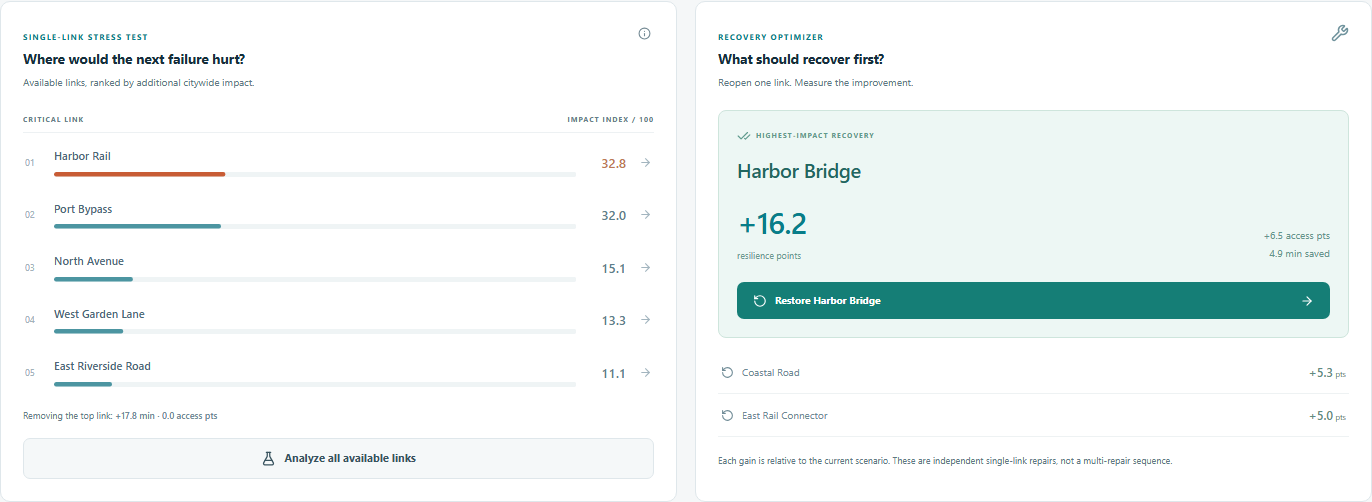
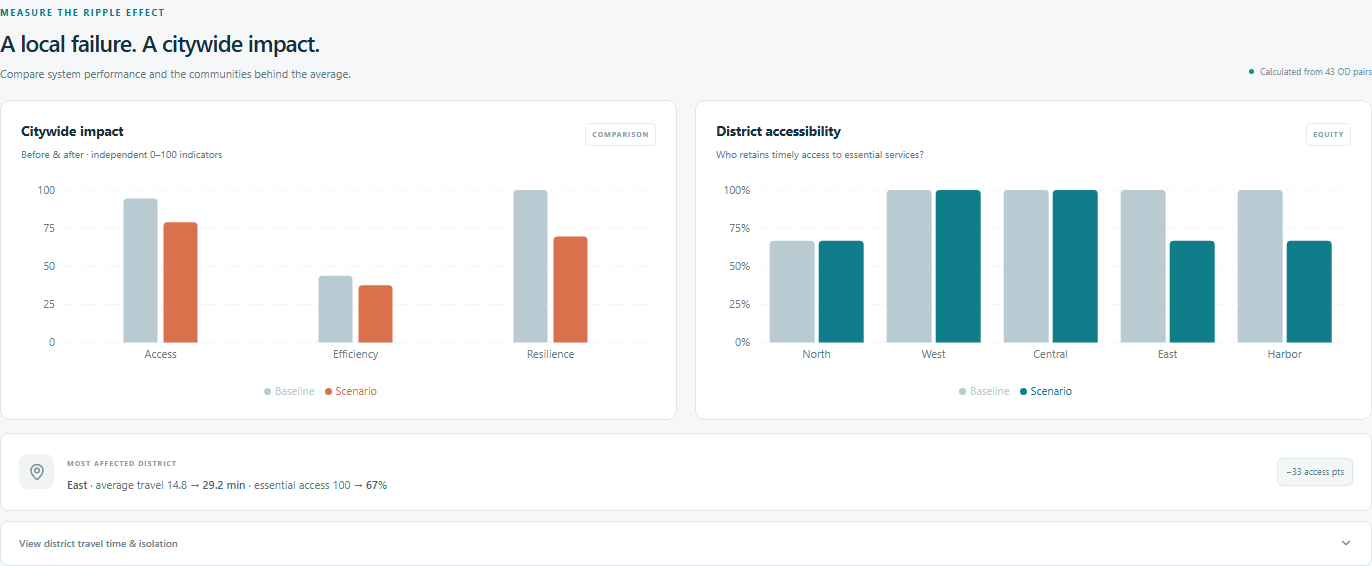
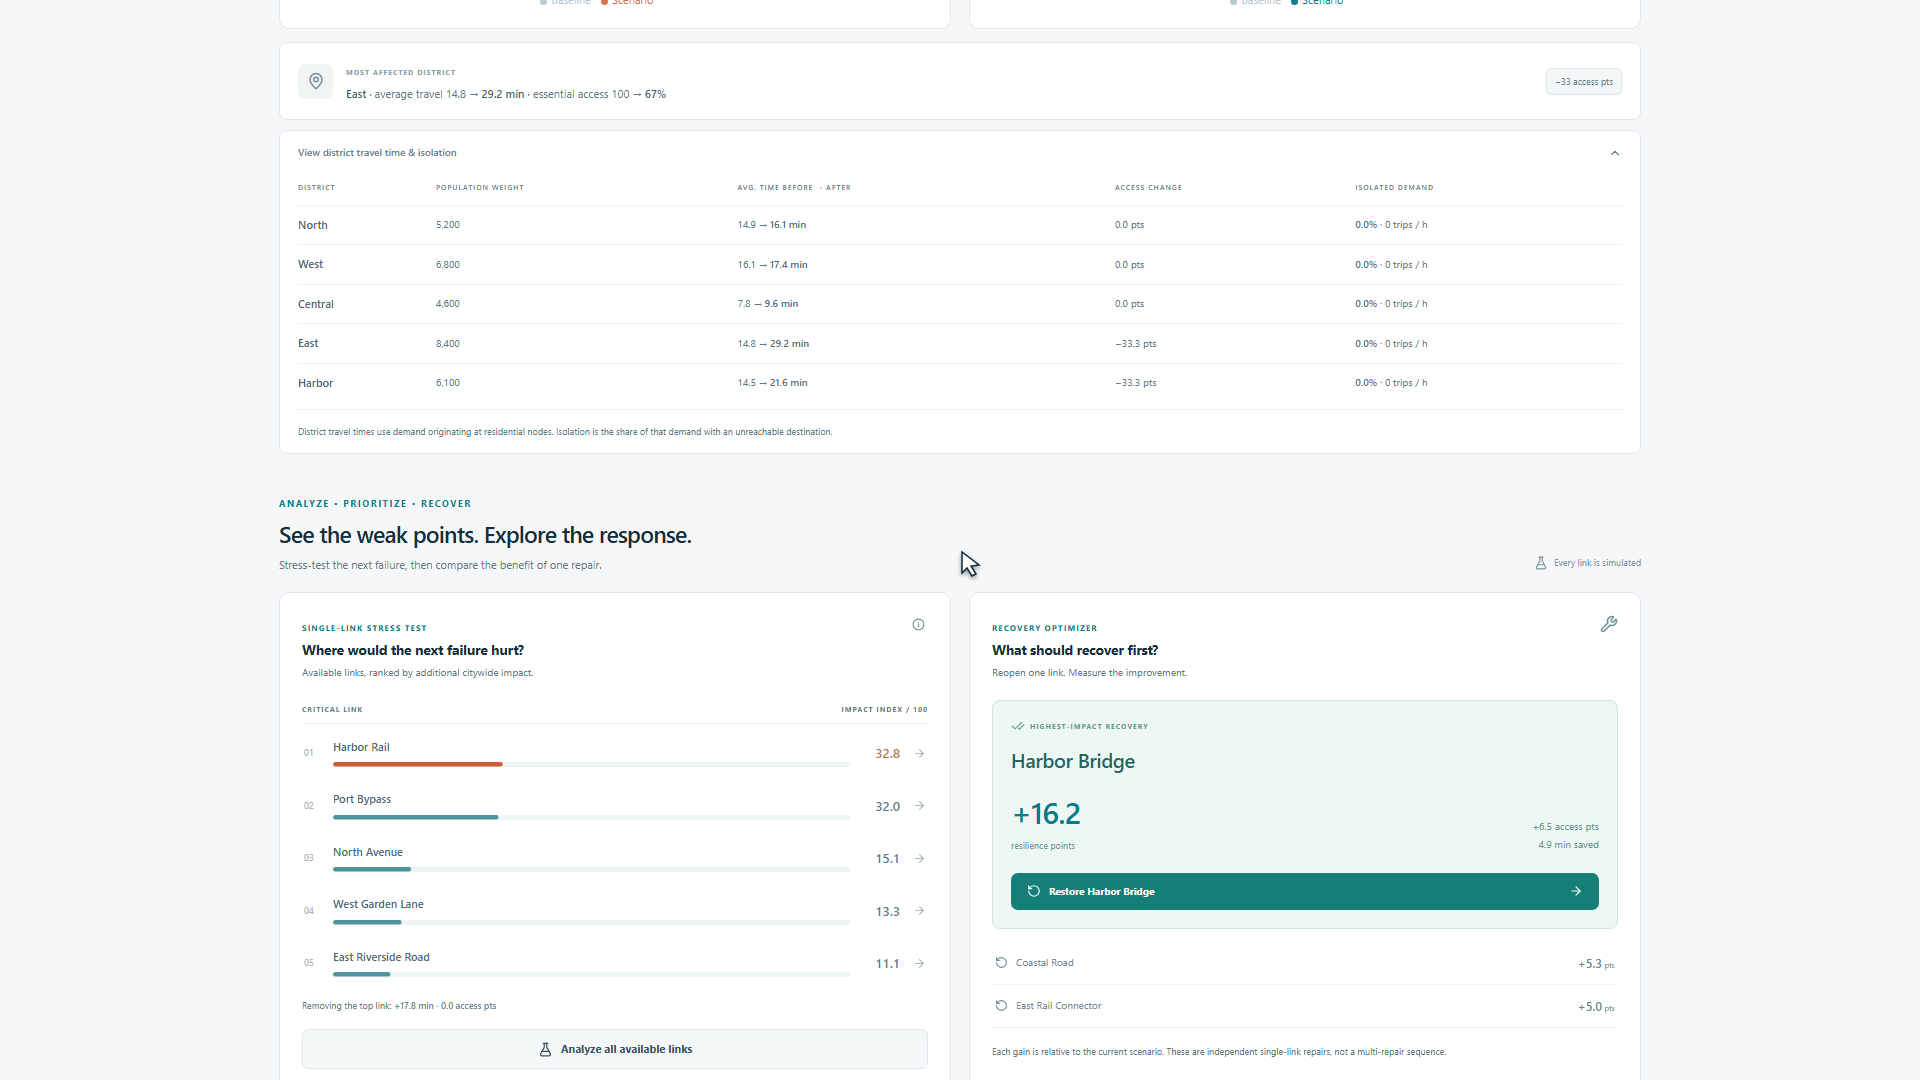
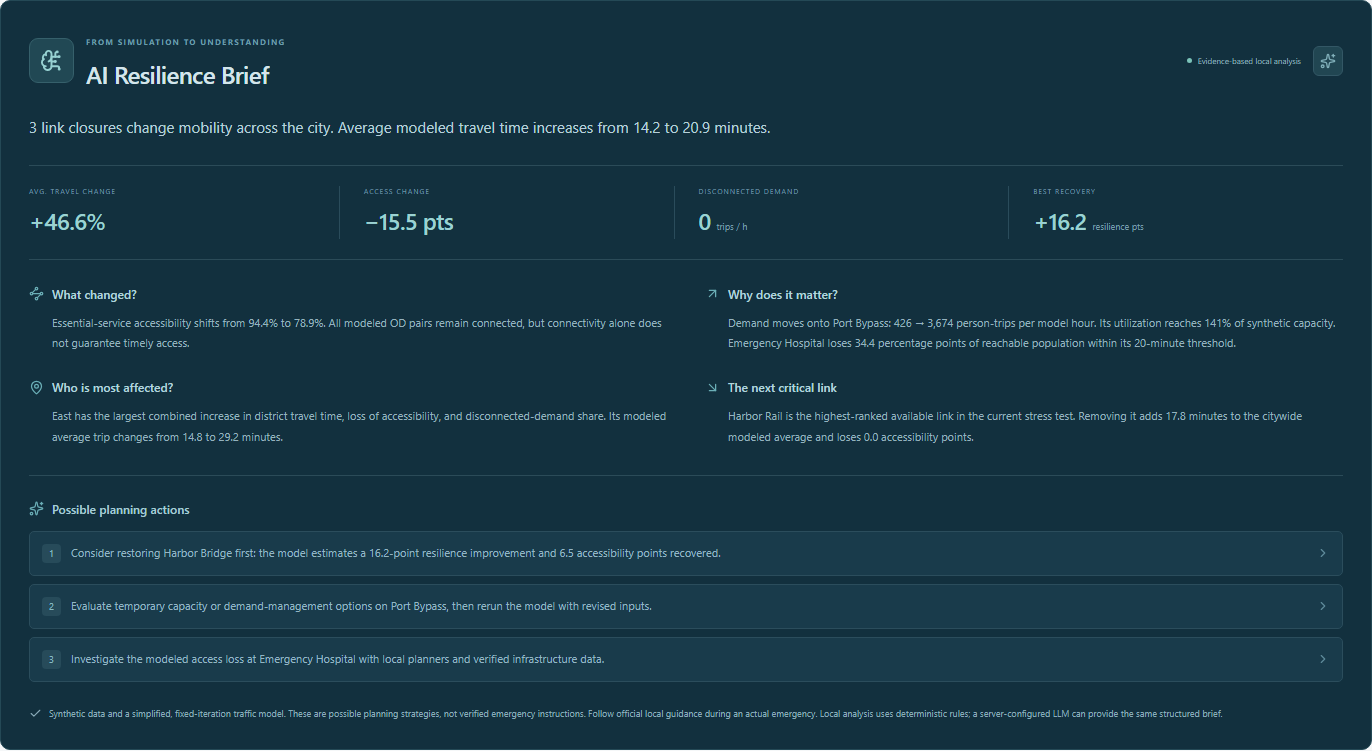
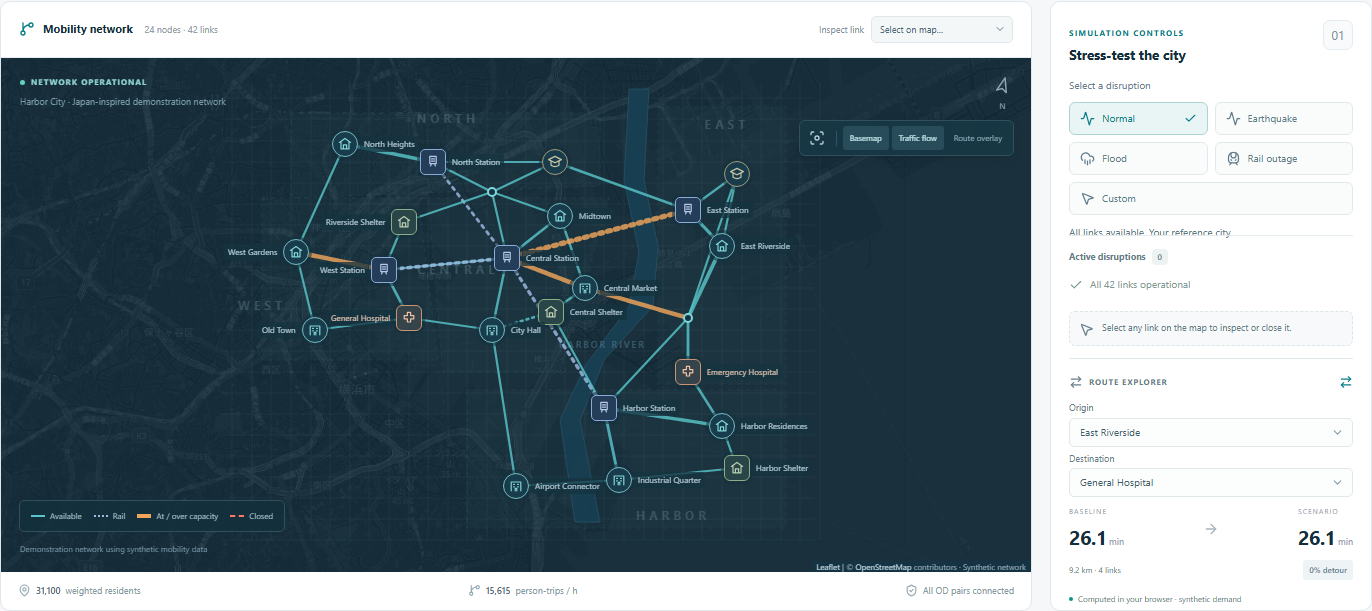
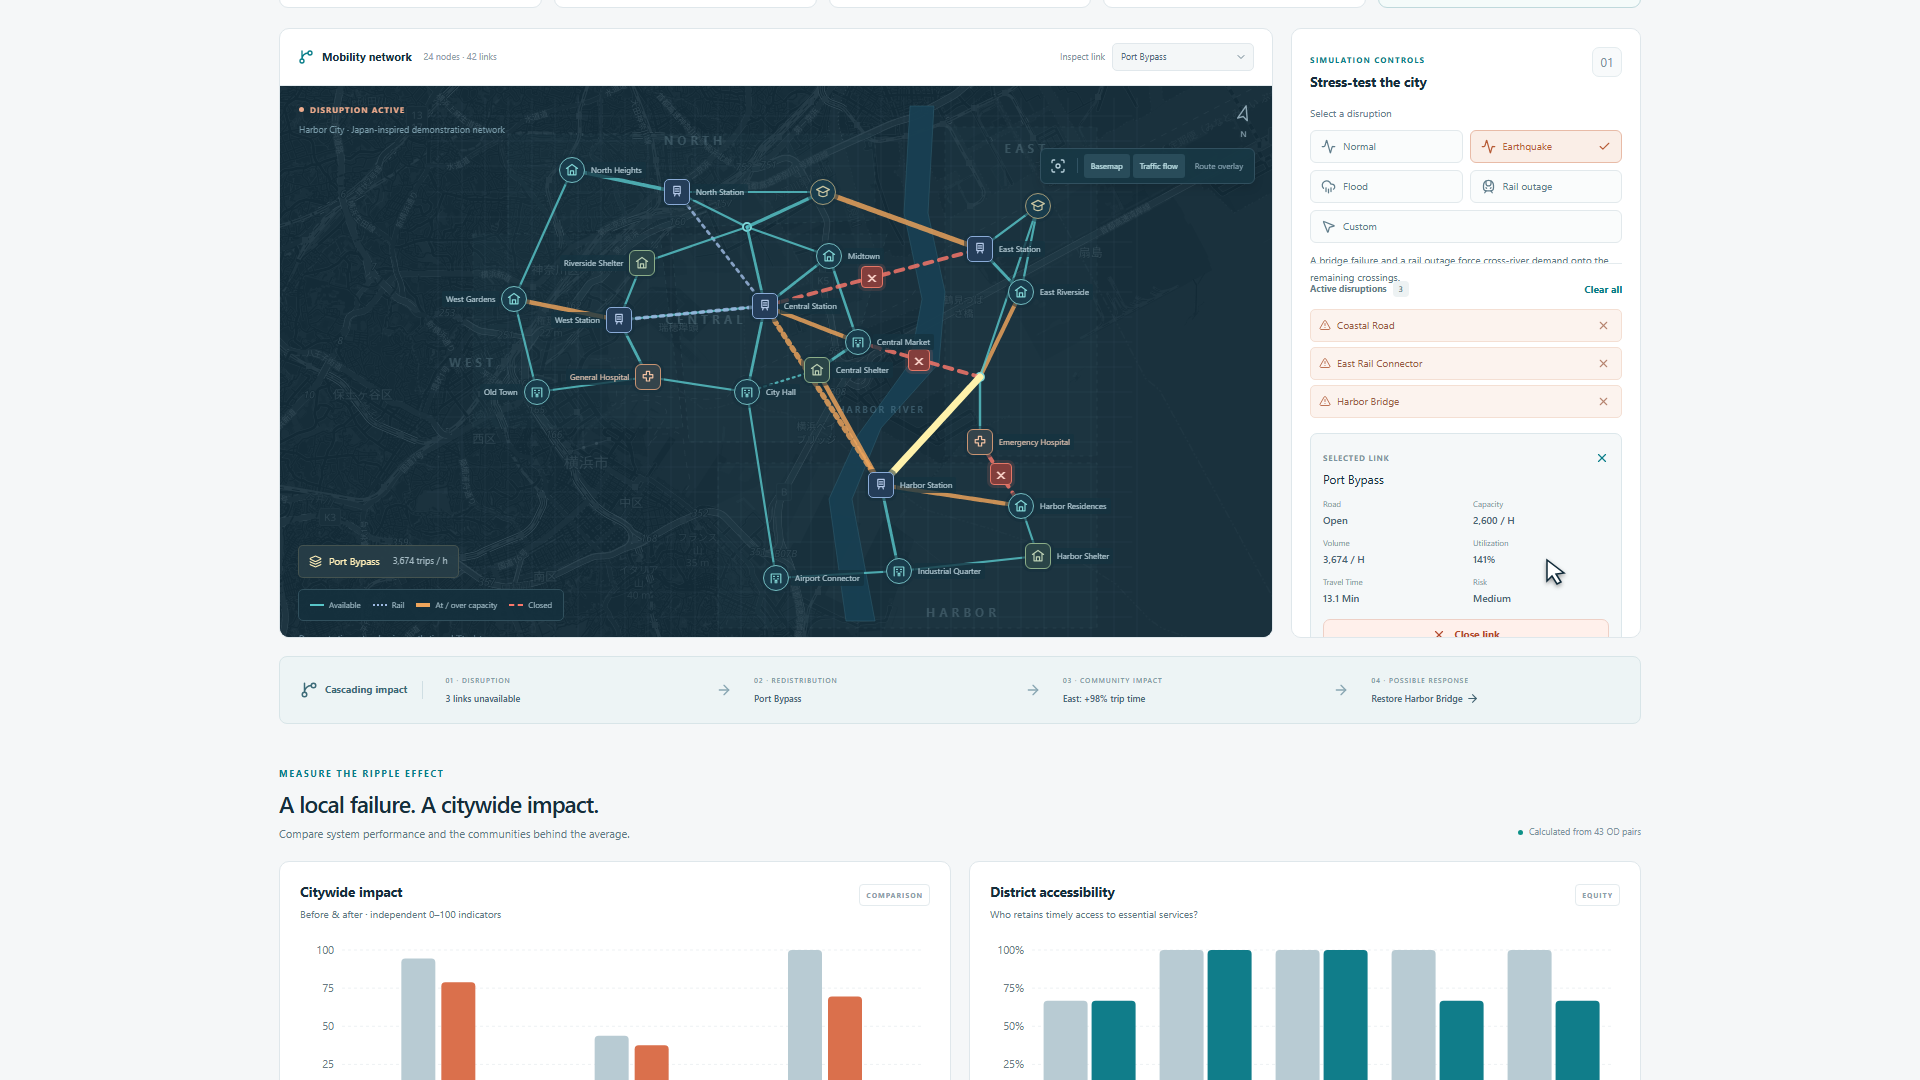
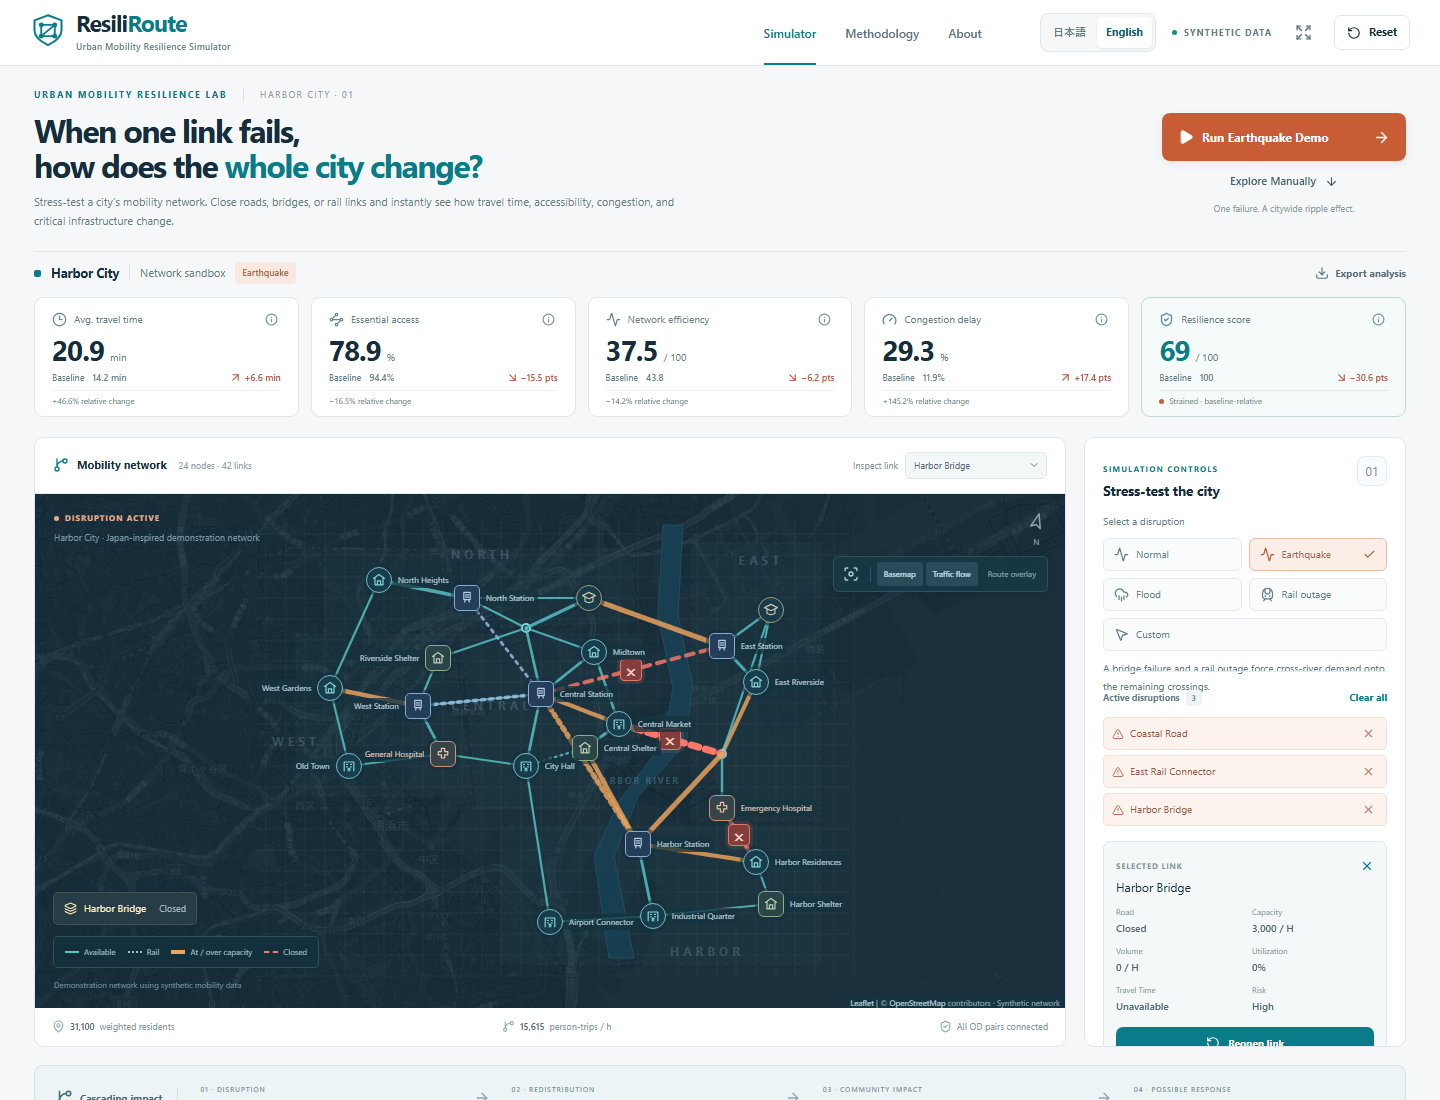
ResiliRoute is a web application that analyzes the ripple effects of disruptions to transportation infrastructure. When users select events such as earthquakes, floods, or rail service suspensions—or manually close links on the map—the application recalculates routes and transportation demand, displaying changes in congestion, travel time, and access to critical facilities. In the earthquake scenario, average travel time increases from 14.2 minutes to 20.9 minutes, and accessibility to critical facilities decreases from 94.4% to 78.9%. These figures are not fixed values but are calculated based on network and demand data. Furthermore, you can analyze the impact by region, rank critical links, and assess the improvement effects of restoring links one by one. The analysis results are summarized into concise explanations and suggested countermeasures using a local analysis engine or an optional LLM integration. The city used in this simulation is based on fictional, synthetic data. It is designed as a prototype to support disaster preparedness education and planning, and is not a system intended for making actual evacuation decisions.
How we built it
I built this as a personal project while in high school using Next.js, React, and TypeScript. I used Leaflet and OpenStreetMap for the maps, and Recharts for the charts. The main simulations run within the browser. I represented the city as 24 nodes connected by 42 links and defined traffic demand between 43 pairs of origin and destination points. I use a custom Dijkstra’s algorithm to find the shortest paths and allocate the traffic demand. Travel times are updated using a simplified BPR function based on traffic volume and capacity, and the effects of congestion and detours are analyzed through iterative calculations. I also calculate population-weighted accessibility, network efficiency, and resilience scores. To analyze critical links, I remove links one by one and compare the impact on the entire city. I utilized AI coding assistance tools, such as Codex, for design, implementation, debugging, testing, and documentation.
Challenges we ran into
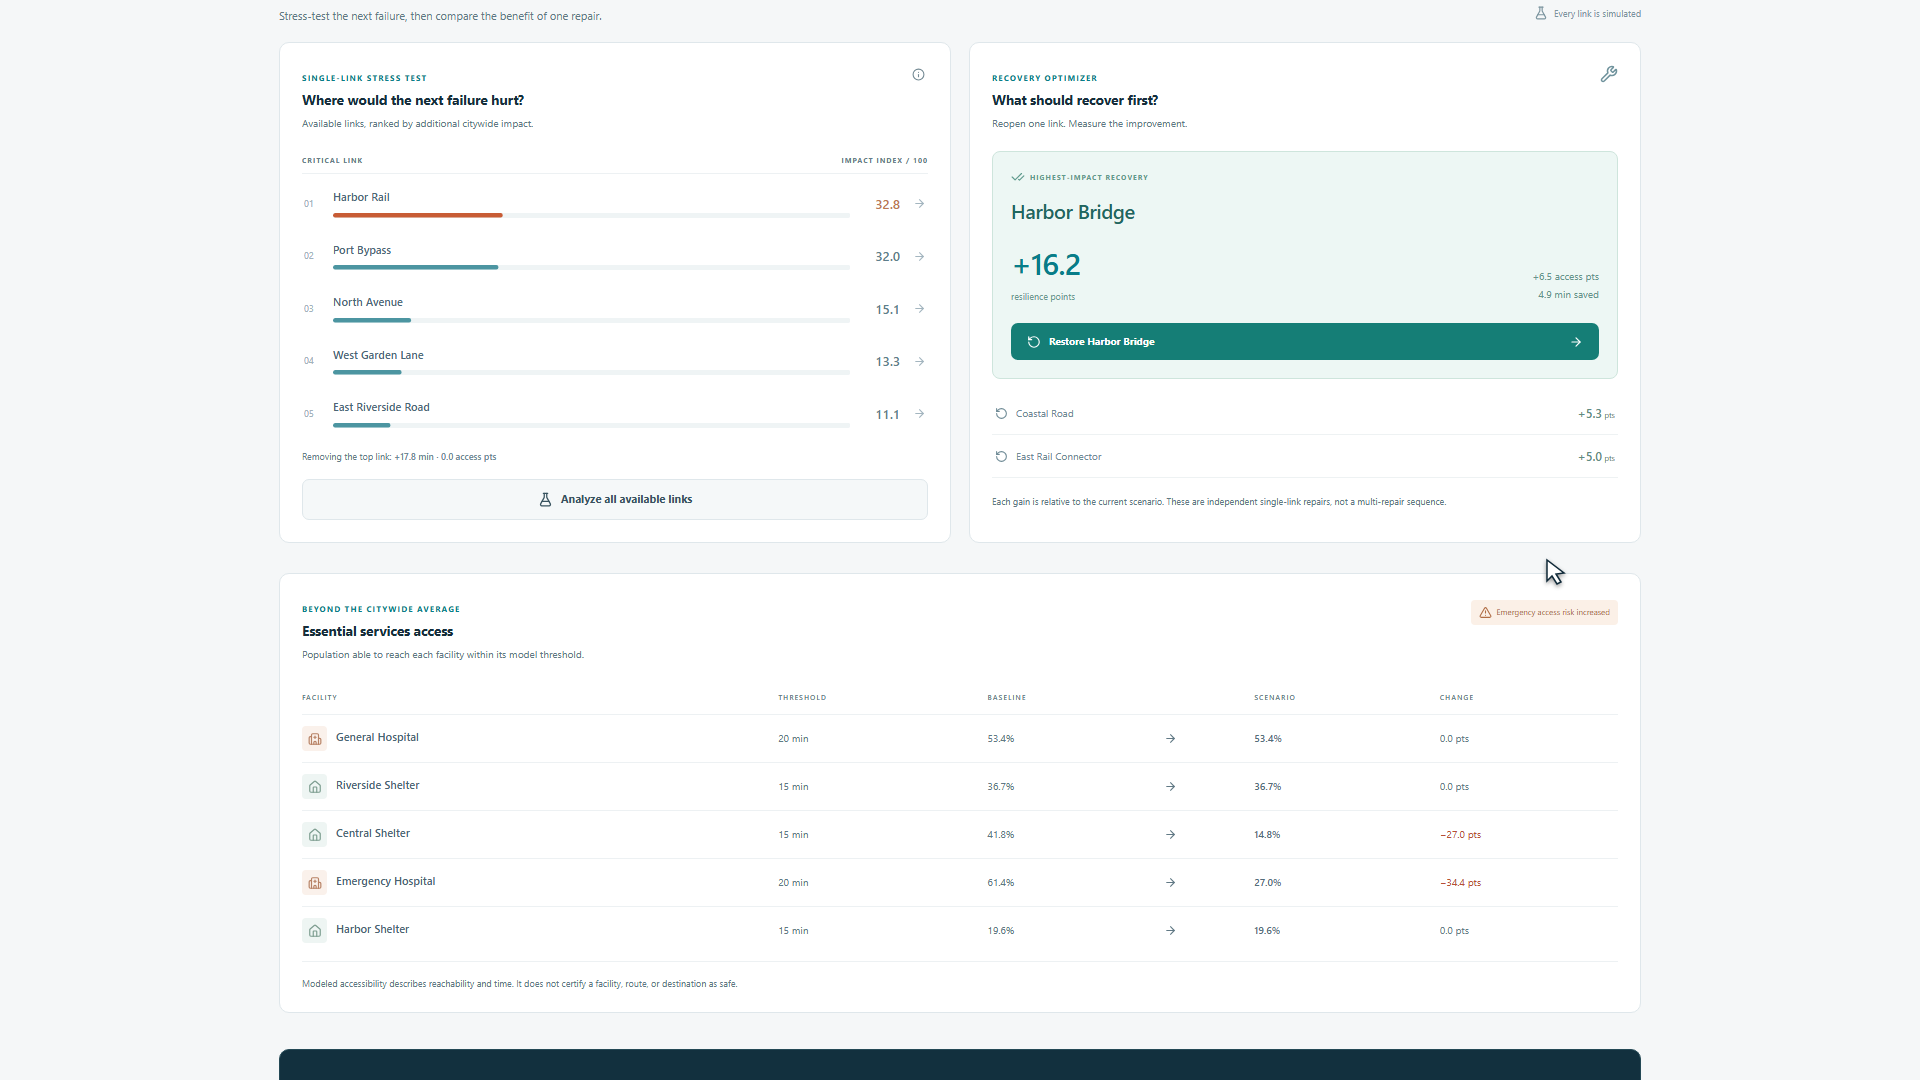
The most challenging part was implementing a system that not only changed the color of the roads but also accounted for traffic that had been traveling along closed links being rerouted to alternative paths, where new congestion would then occur. We adjusted the calculations to ensure they did not produce extreme values while properly redistributing demand. Furthermore, relying solely on citywide averages obscures the severe impacts on specific areas. Therefore, we added analyses by region as well as analyses of access to hospitals and shelters.
Accomplishments that we're proud of
Our greatest achievement was demonstrating the chain of events—“disruption → detours → congestion → reduced accessibility”—using interactive maps and computational results. With a single click on the earthquake simulation, users can view the impact by region, critical infrastructure, and potential recovery options. In the earthquake scenario, even when routes remain between all origins and destinations for transportation demand, access to critical facilities within the specified time window deteriorates. These results demonstrate that urban issues cannot be assessed solely based on whether connections are intact. We also implemented language switching between Japanese and English, mobile support, and explanations of the calculation methods. The system passed 24 unit tests and 20 browser end-to-end (E2E) tests, and we have verified type checking, Lint, and production builds.
What we learned
I learned that when considering the resilience of a transportation network, it is necessary to examine not only the availability of alternative routes but also their capacity, travel time, and accessibility to critical facilities. It was also important to combine citywide averages with the specific impacts on each neighborhood. I learned that when utilizing AI, it is necessary to clearly define the roles of the simulation that performs the calculations and the analysis function that explains the results. By limiting the basis for explanations to structured data and ensuring that the numbers can be verified, we can achieve both ease of understanding and transparency. I also learned that creating compelling demonstrations and honestly communicating the model’s limitations both contribute to the credibility of a technical project.
What's next for ResiliRoute
Going forward, we plan to add a mechanism that can incorporate open data from local governments and expand our analysis to focus on specific regions. In doing so, we will need to verify transportation demand and capacity, as well as highlight the uncertainties in the analysis results. We also aim to expand beyond the current “comparison of restoring one link at a time” to explore restoration plans for multiple links that take budget and restoration time into account. In the future, we aim to utilize this tool to help people understand the cascading effects of transportation disruptions in school disaster preparedness education, community workshops, and urban planning discussions.
Built With
- codex
- css
- html
- node.js
- openstreetmap
- playwright
- typescript


Log in or sign up for Devpost to join the conversation.