Inspiration
During the COVID winters, the headline number was always "hospitalizations." But a full hospital is not just one building's problem. Its overflow lands on the hospital next door, and the neighborhoods that depended on it quietly lose easy access to care. We wanted to see that chain reaction for Boston: if one hospital goes down, who loses care, how far does the strain spread, and what would actually help?
What it does
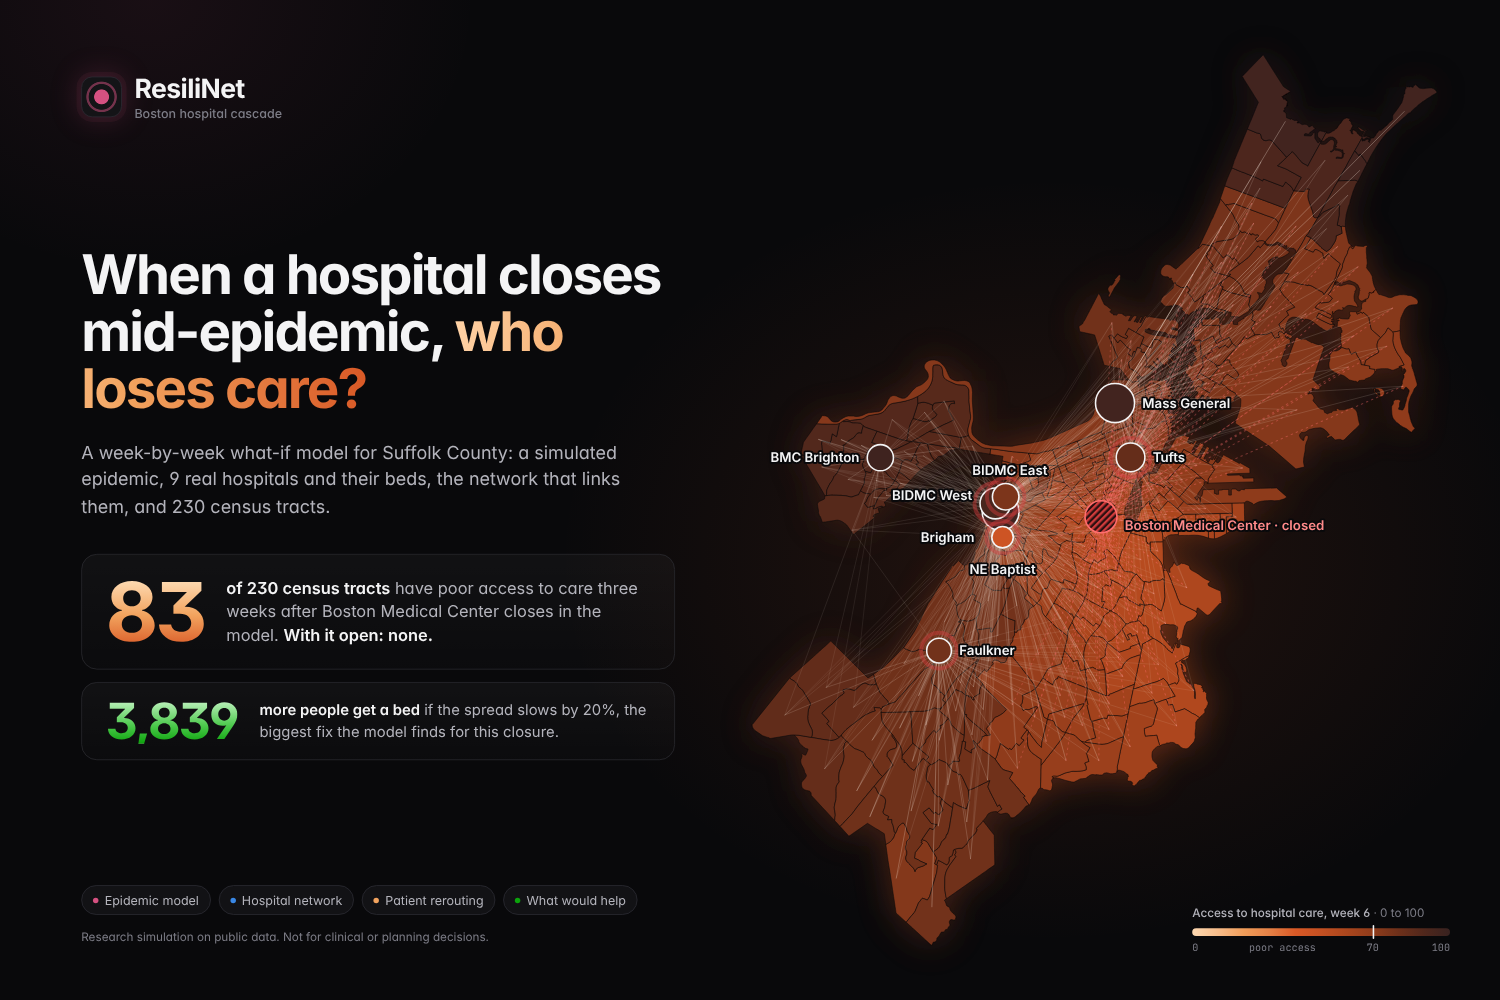
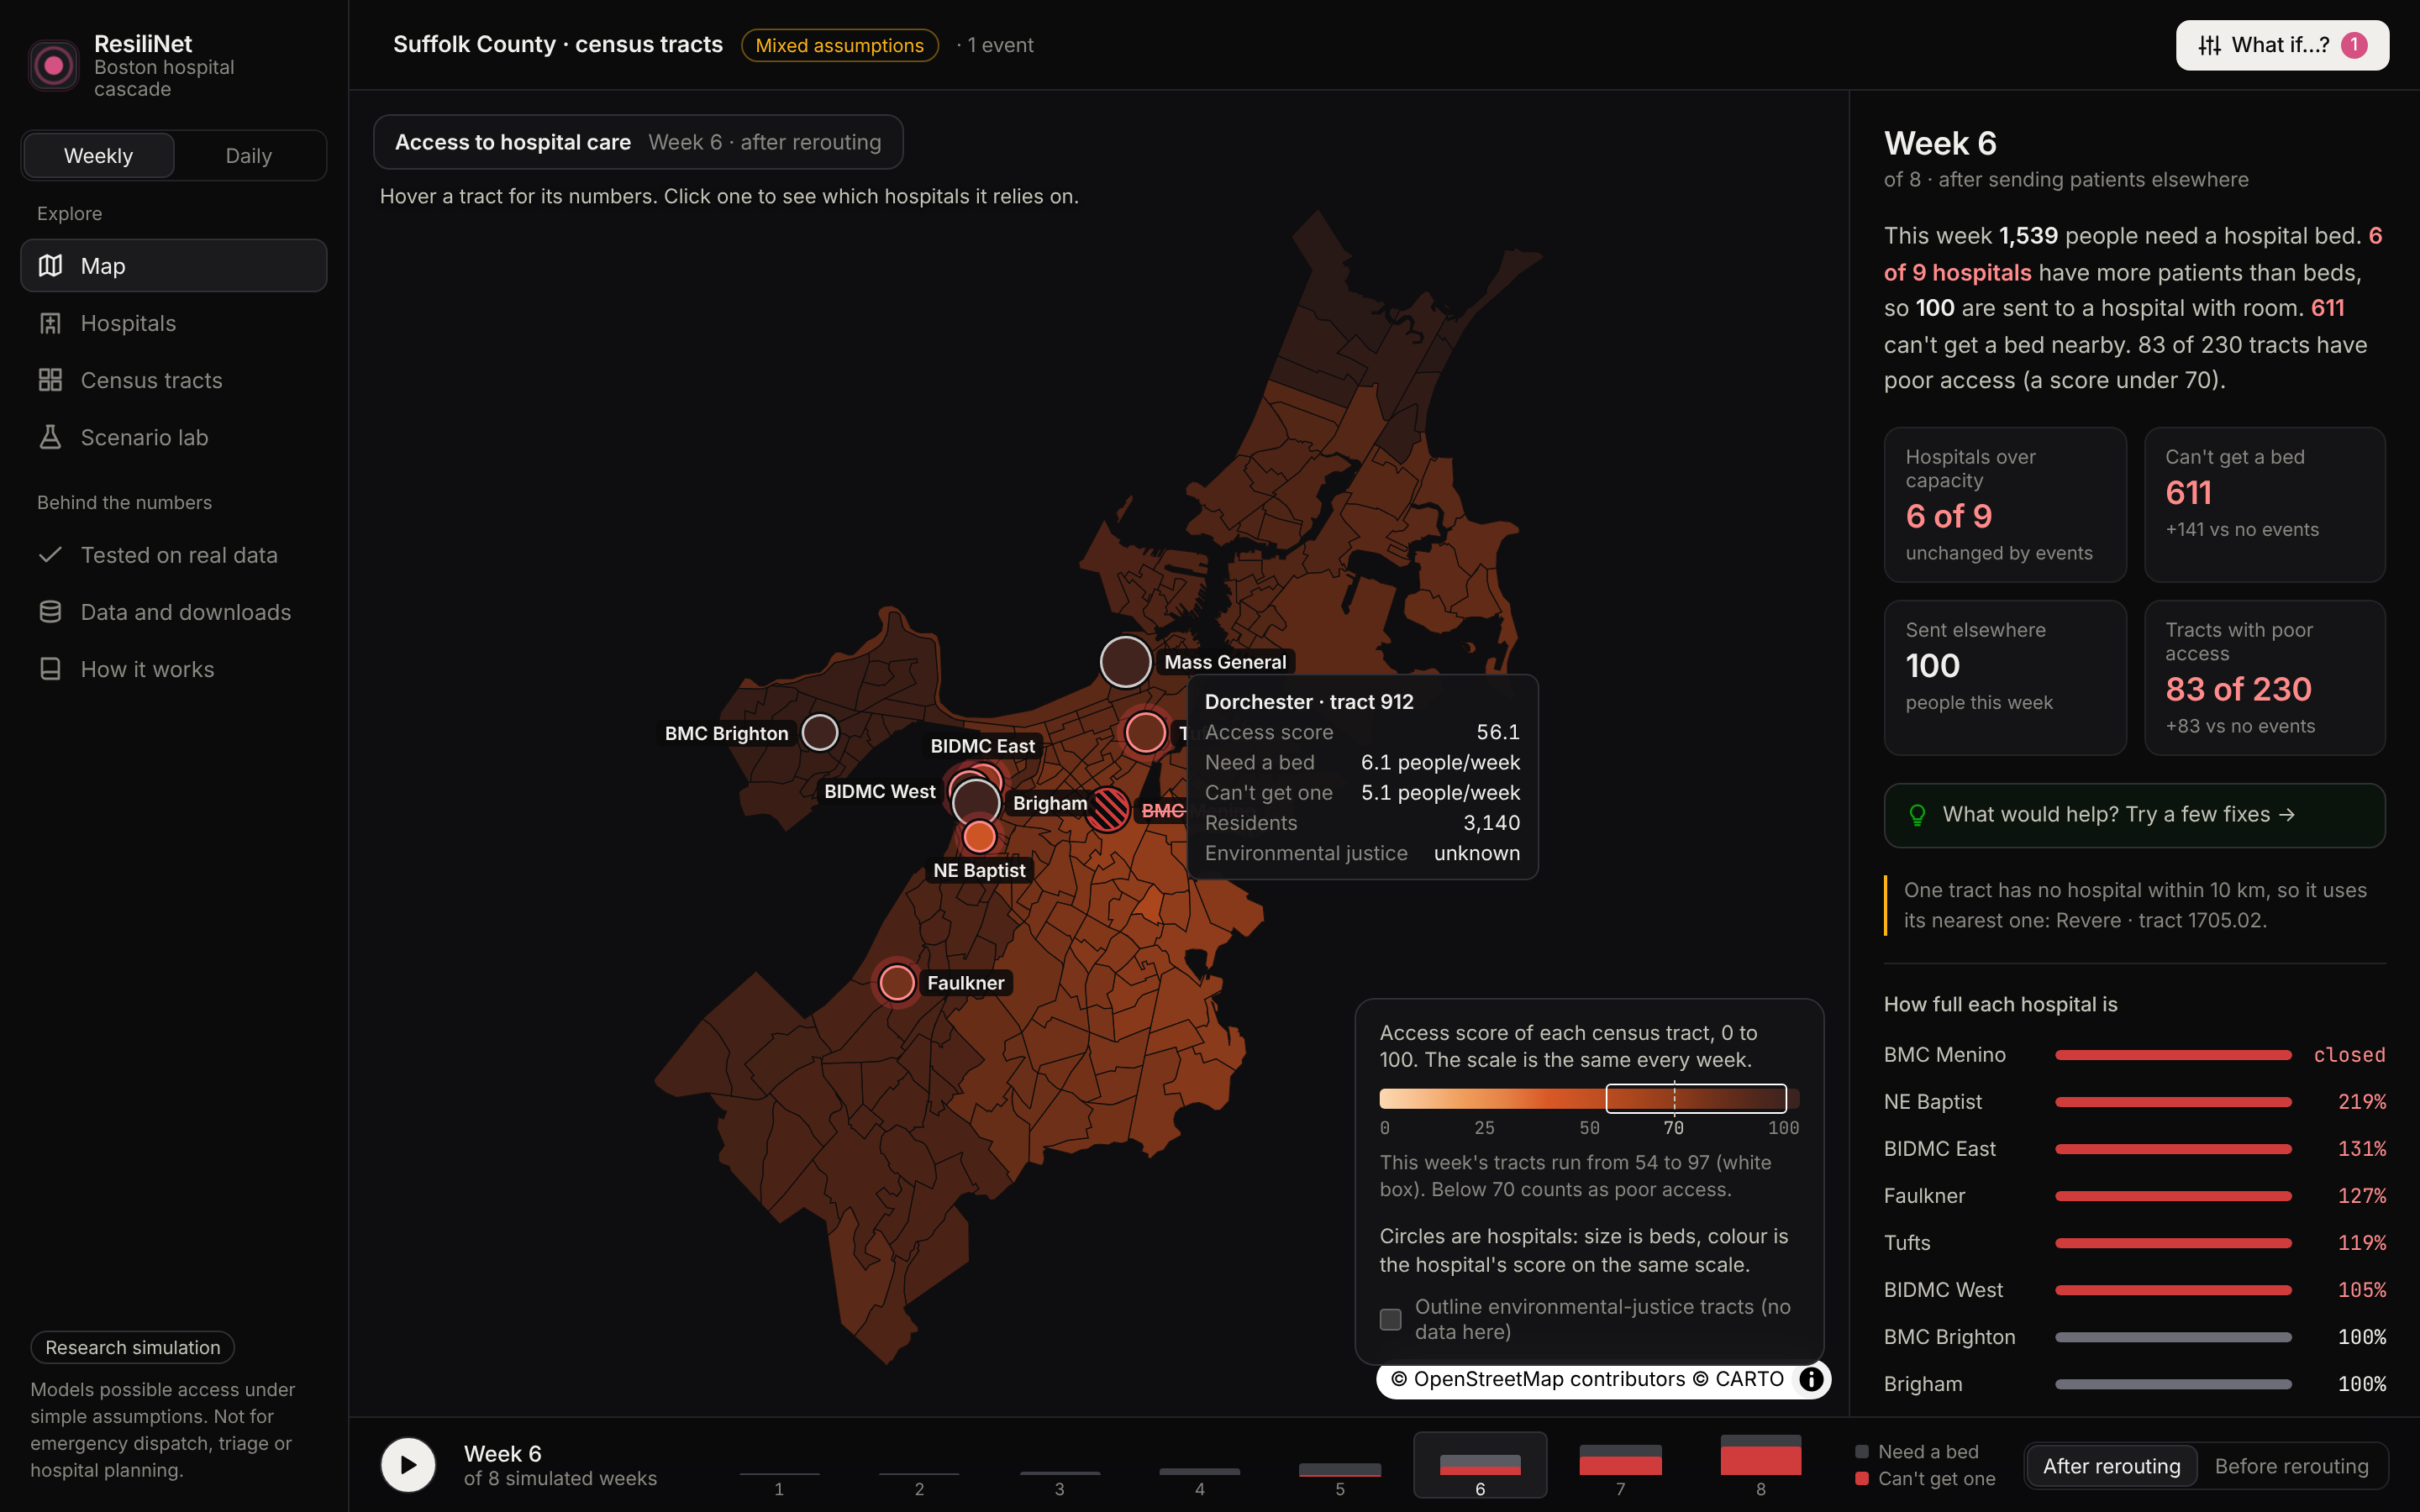
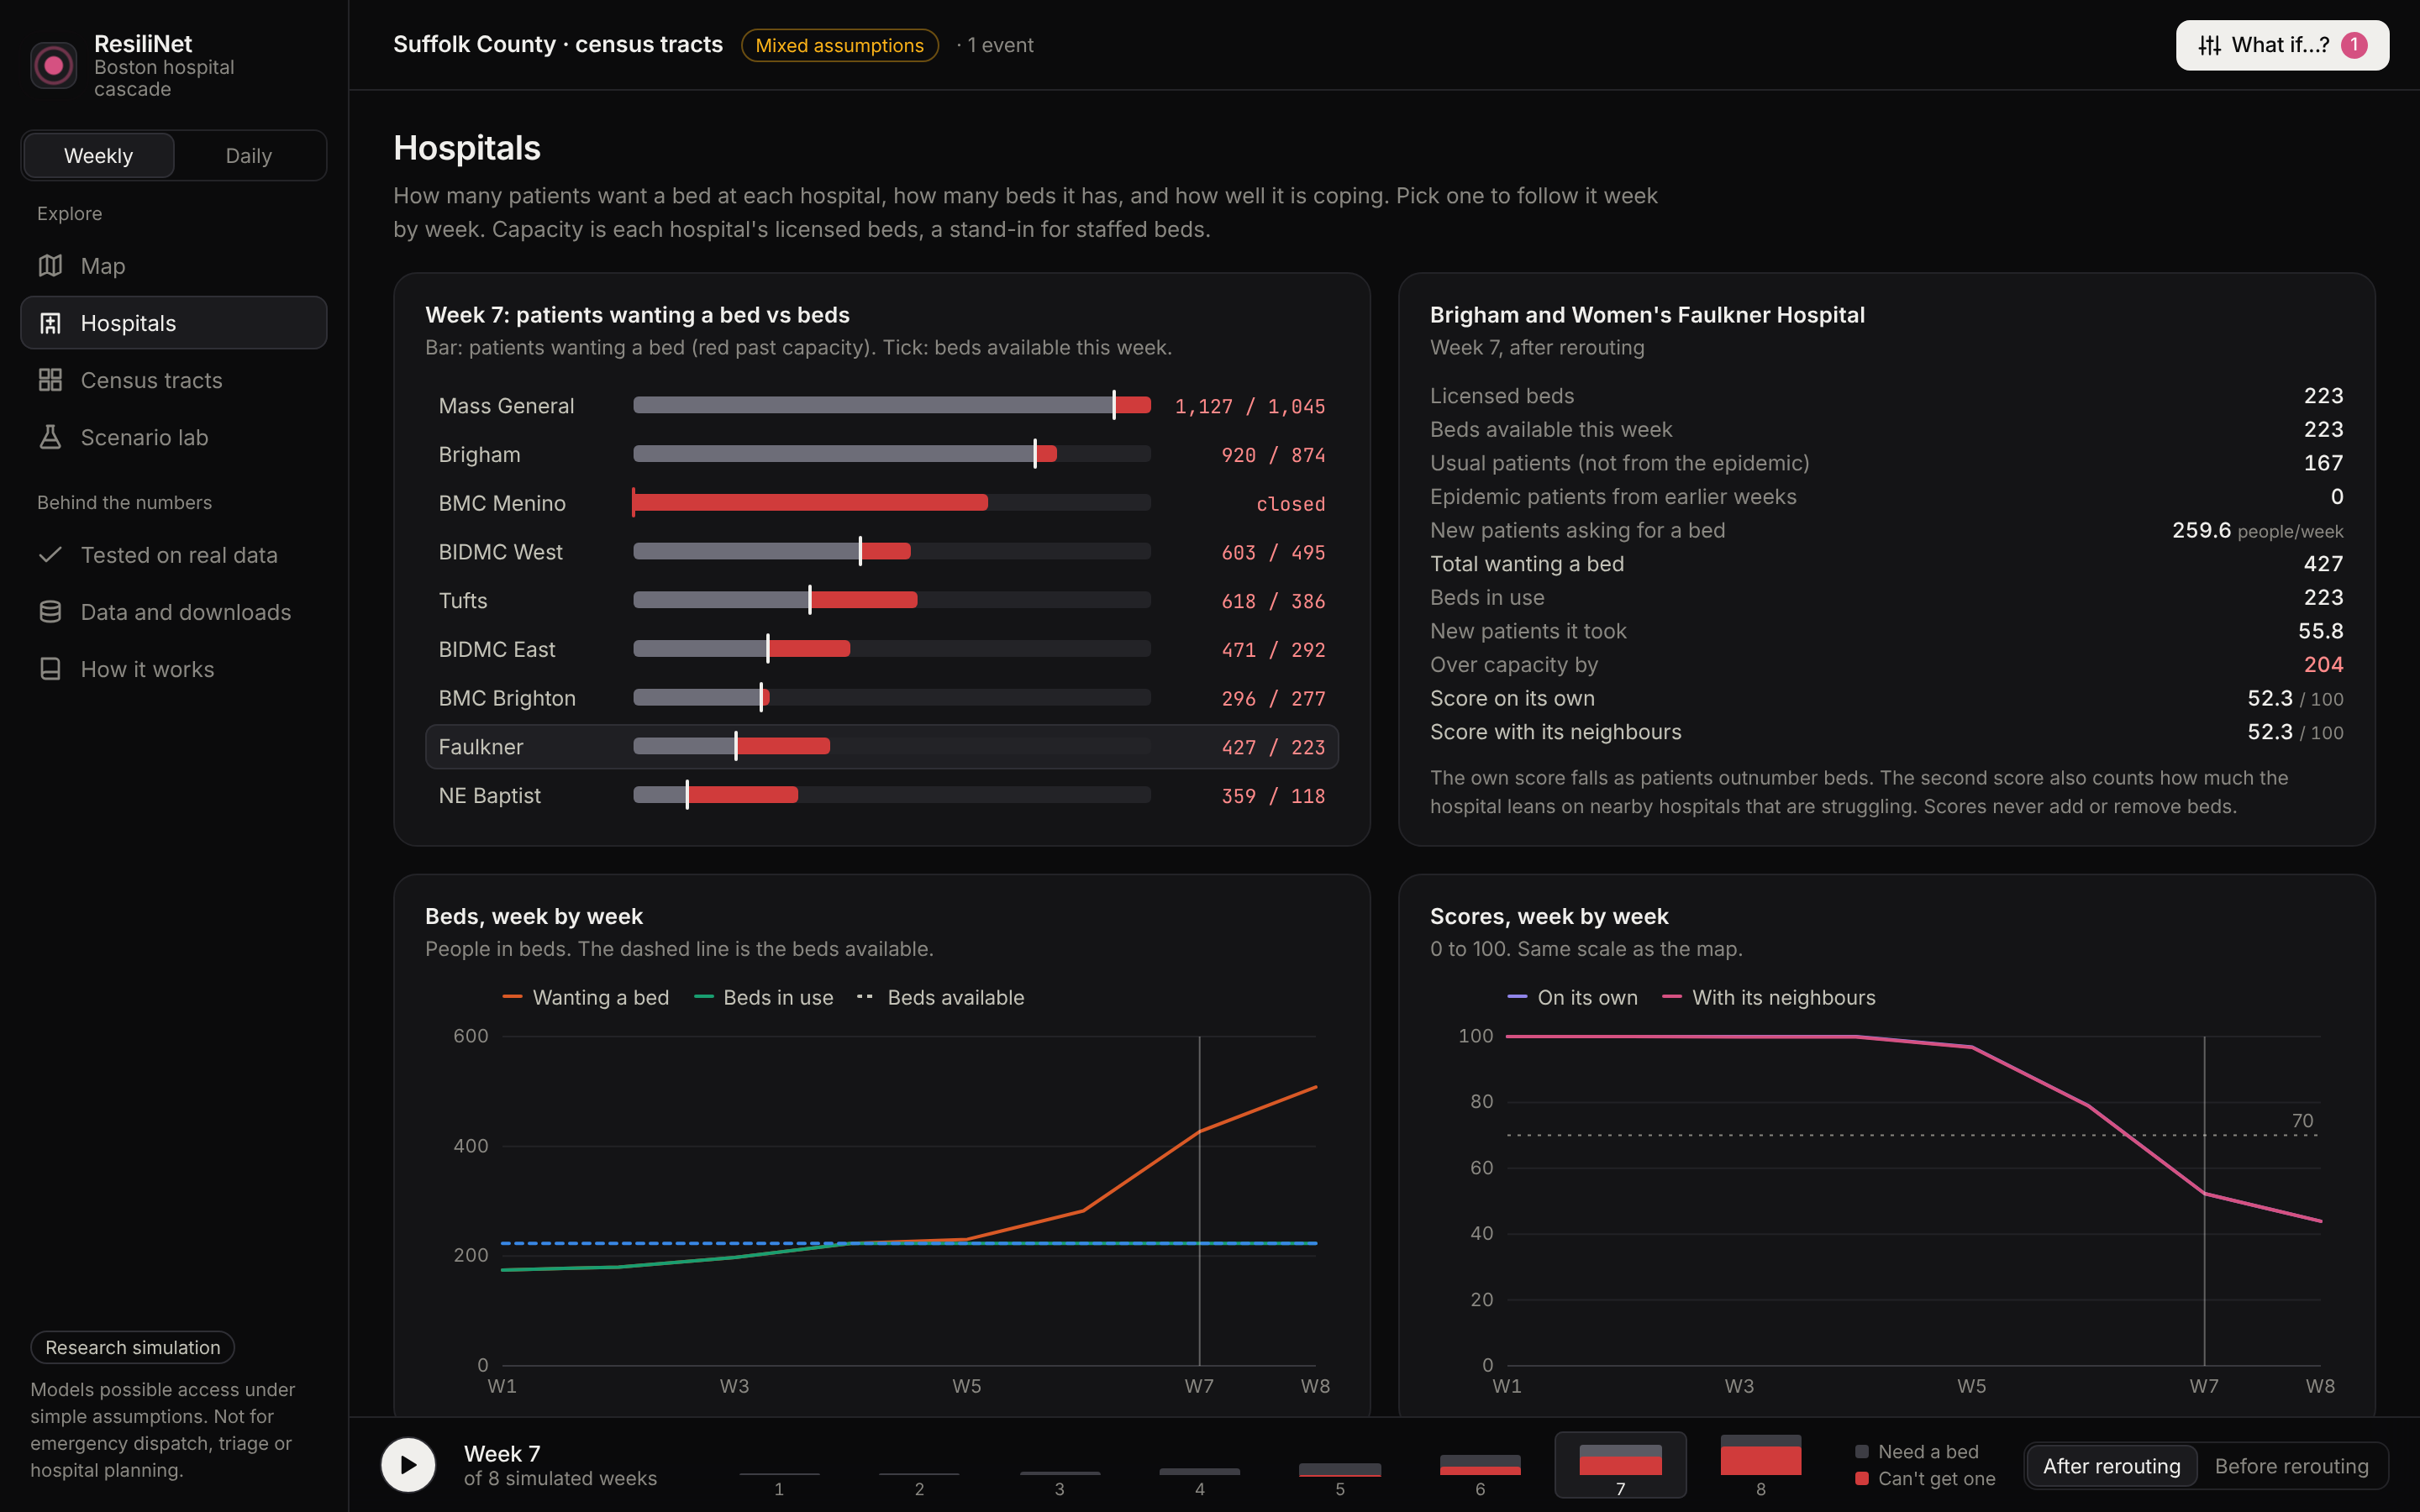
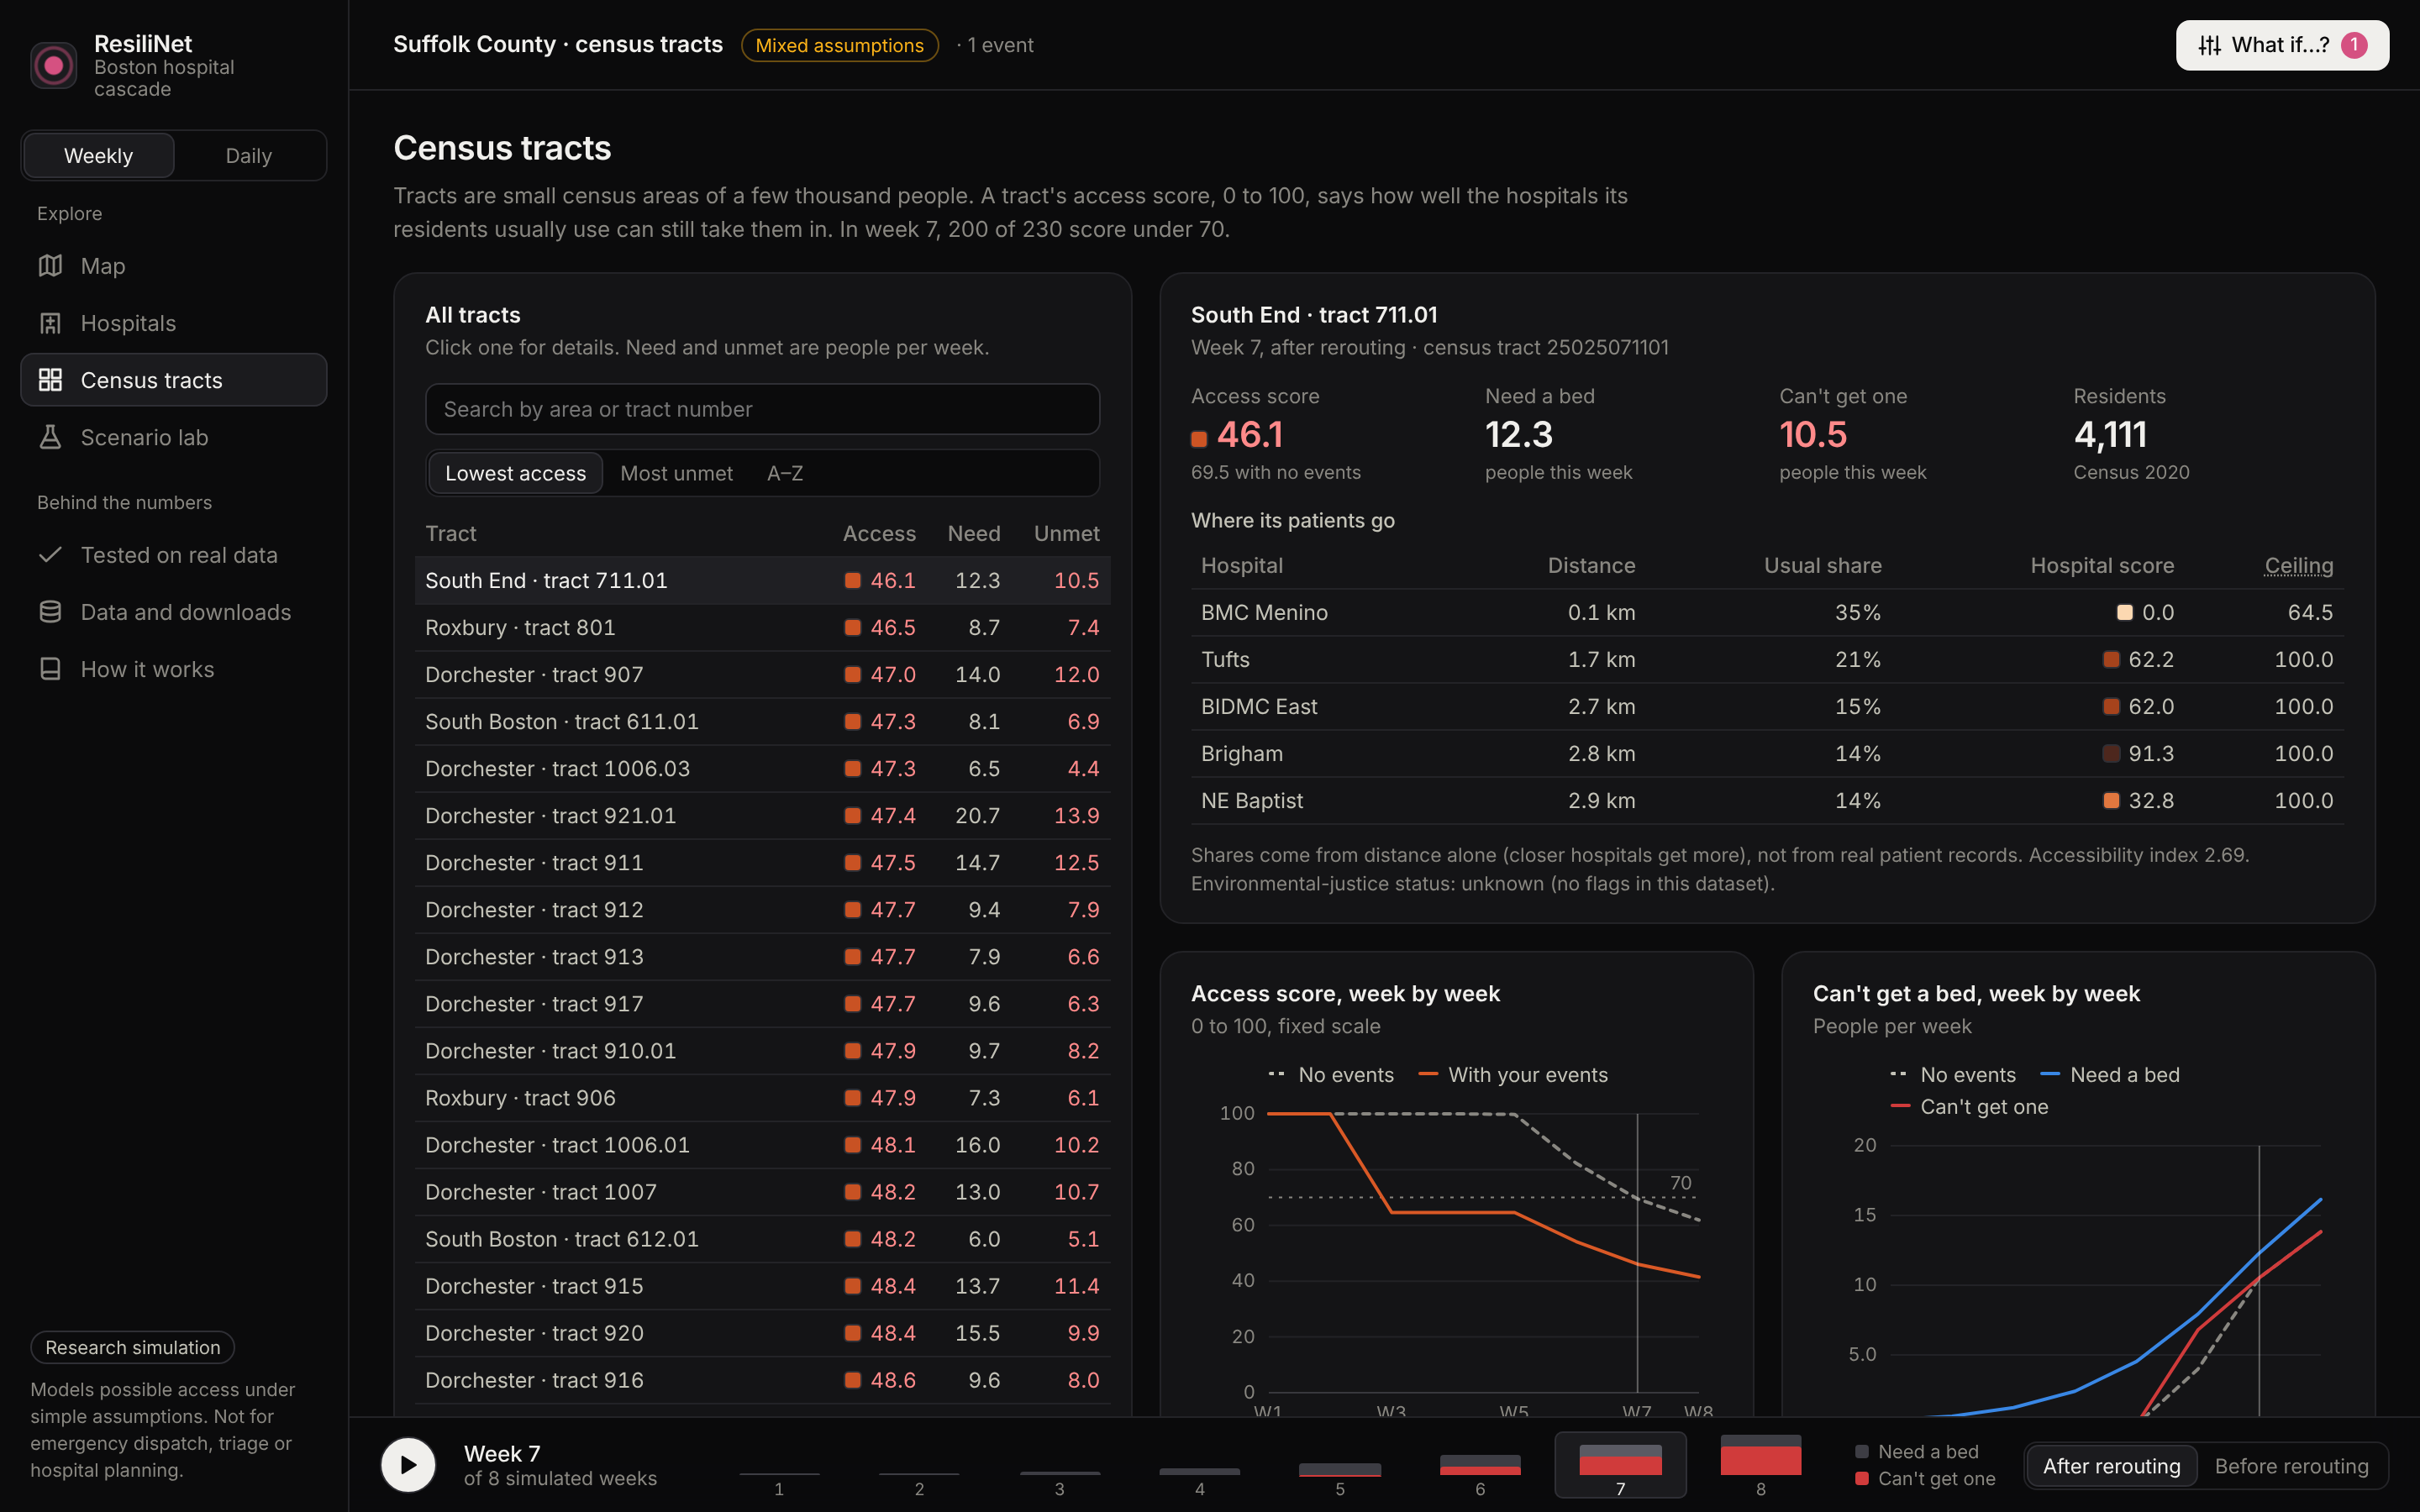
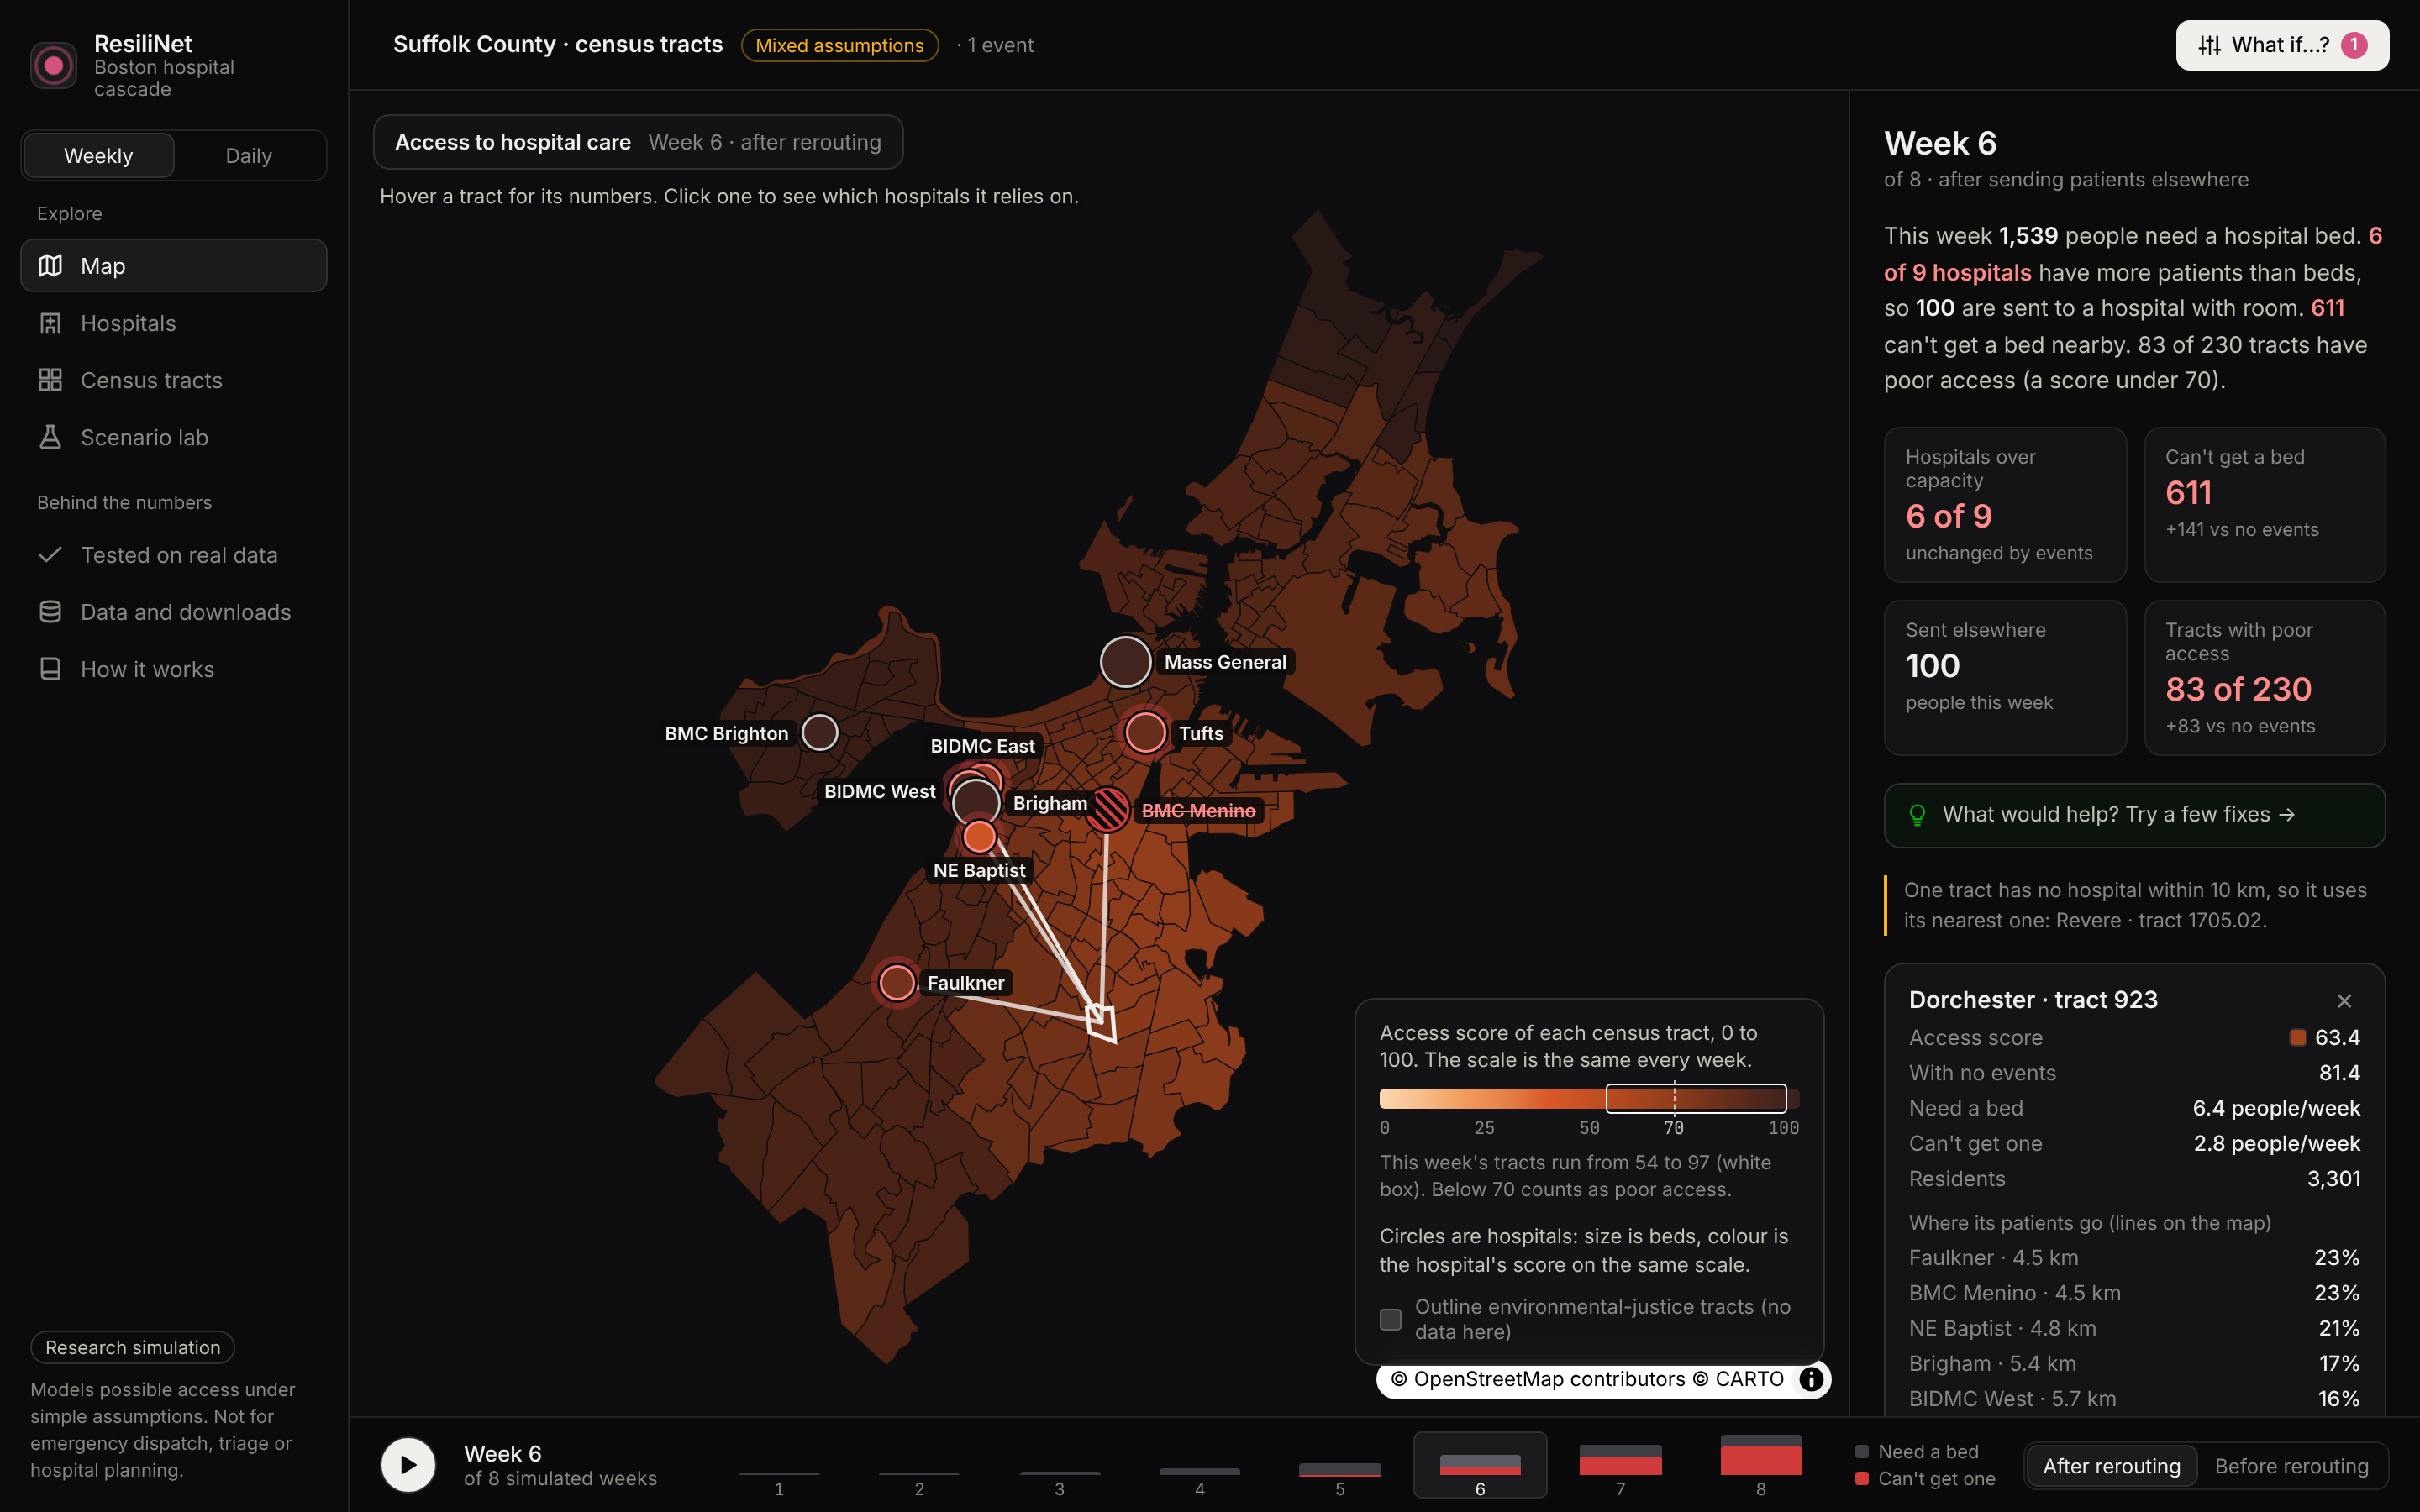
ResiliNet simulates an outbreak across Boston's 230 populated census tracts, sends the sick people who need a bed to nearby hospitals, reroutes overflow to hospitals that still have room, and scores how well each neighborhood can still reach care.
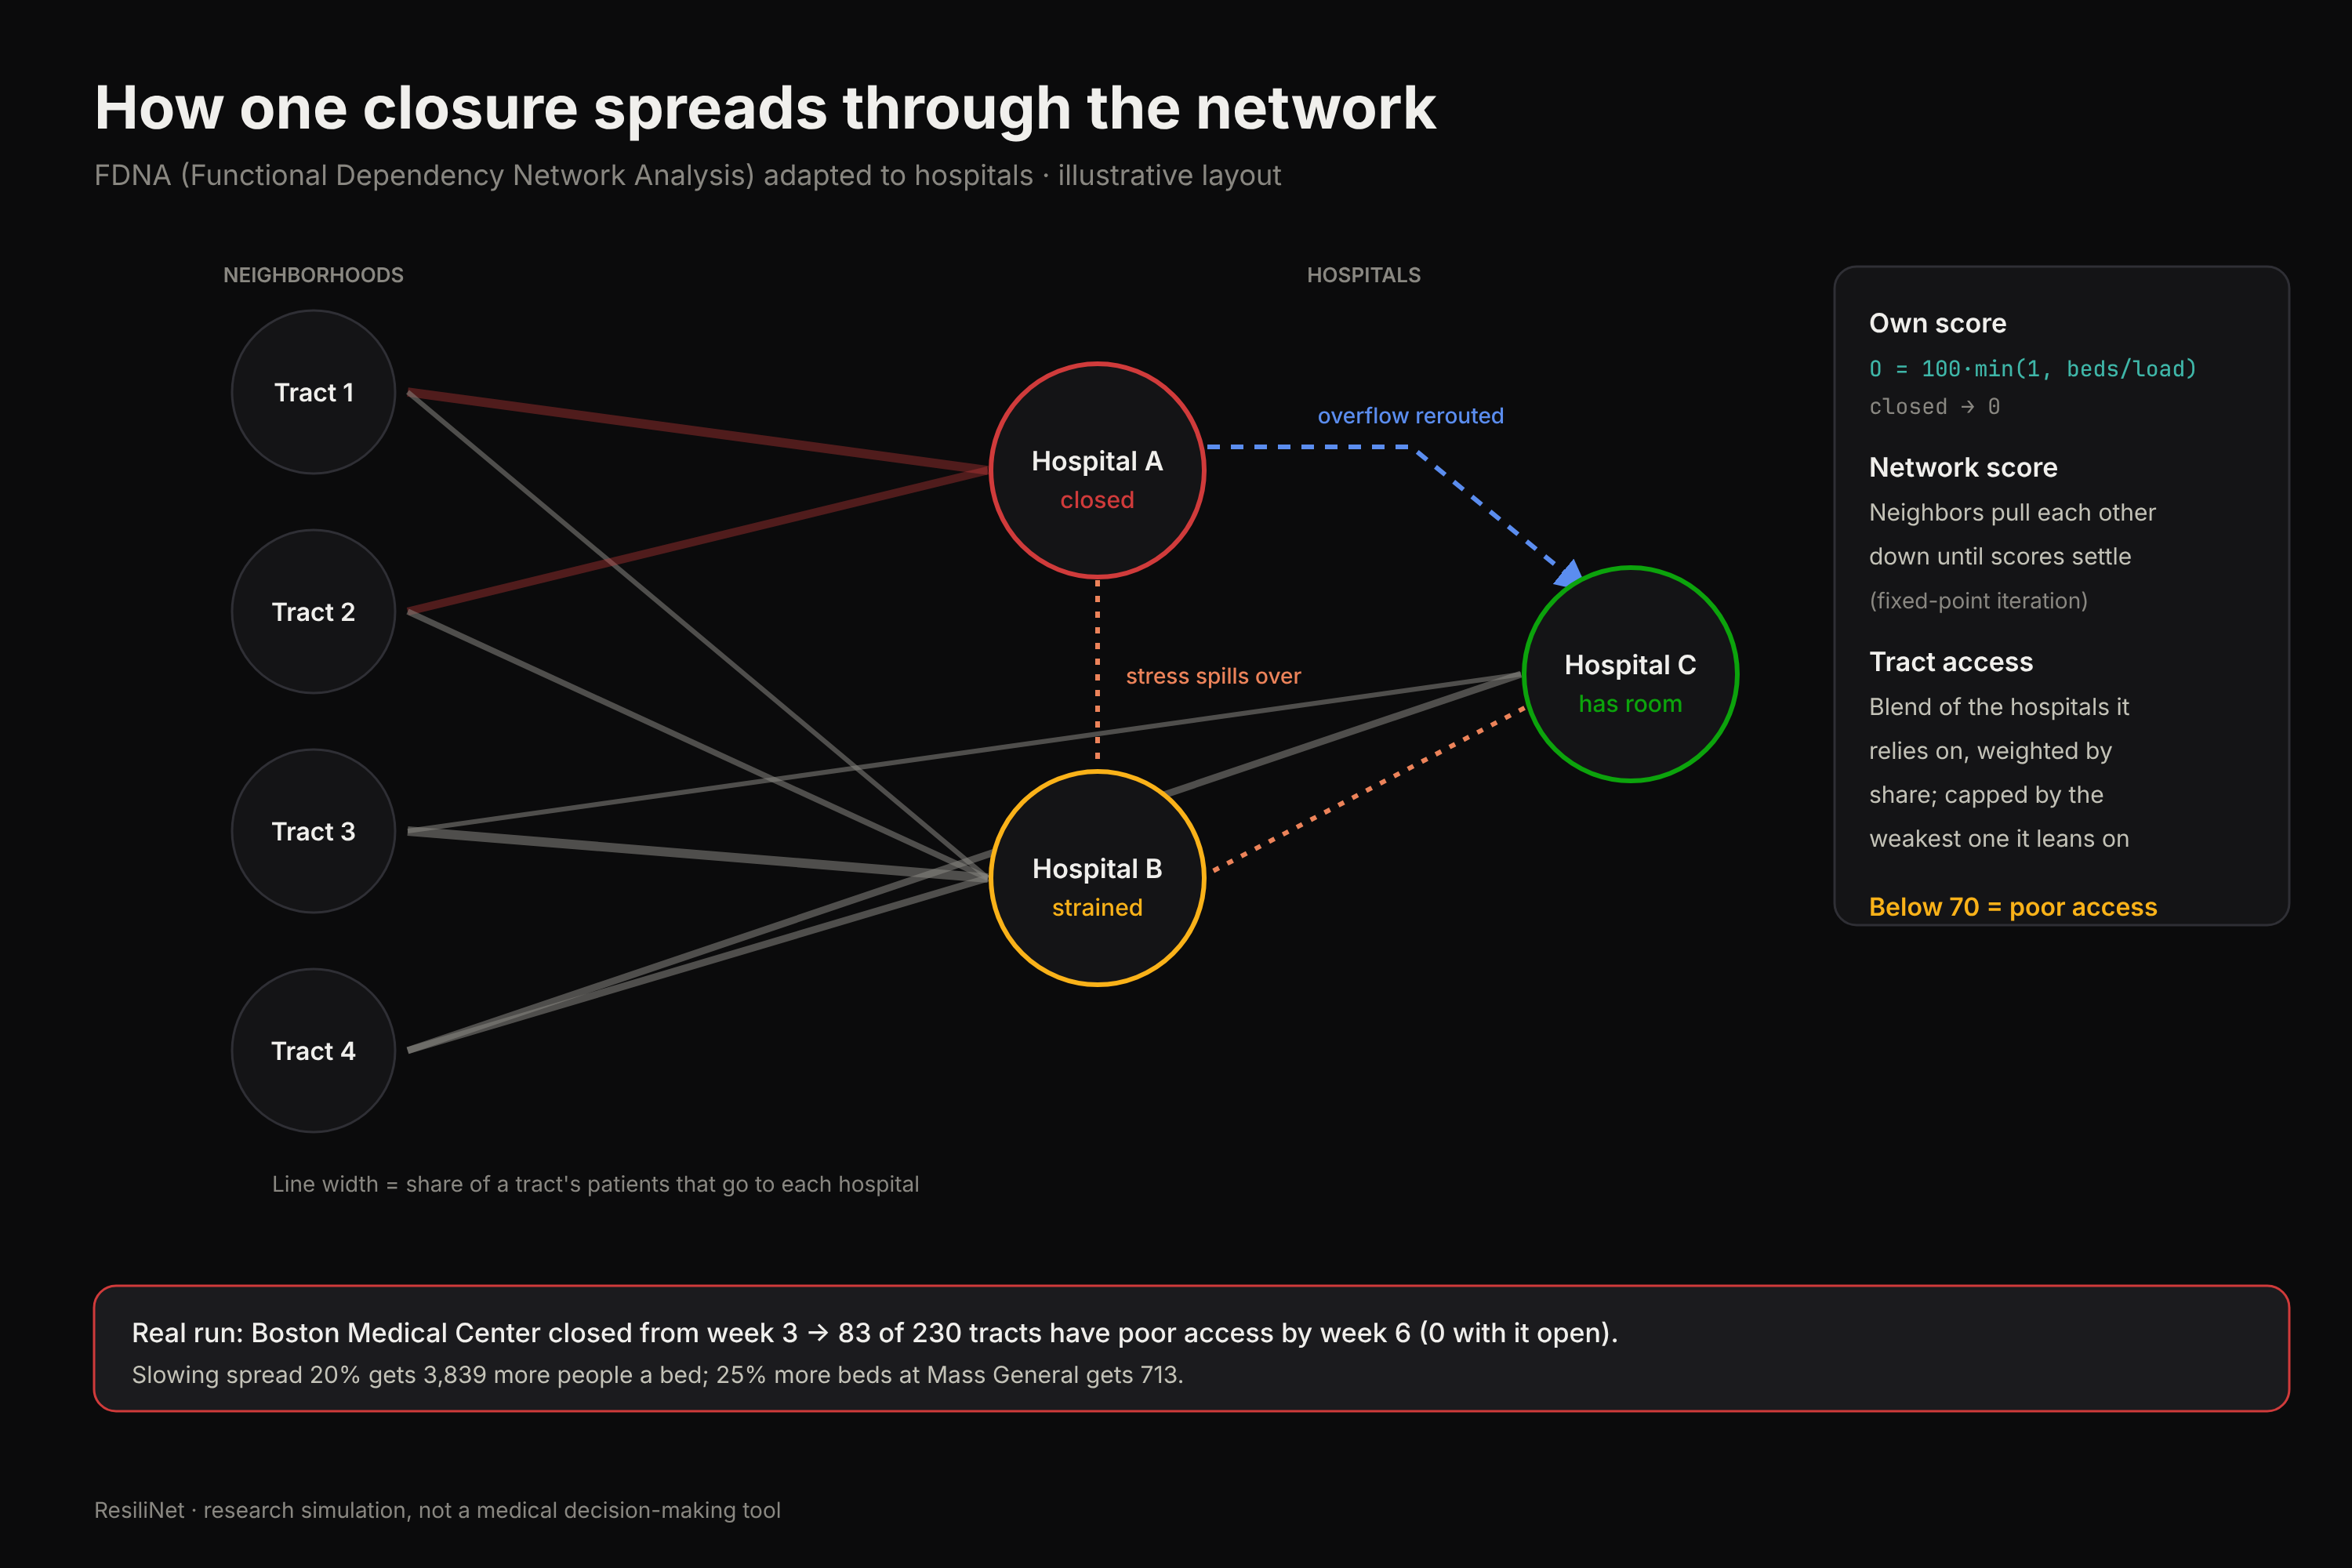
You can then ask "what if?" Close a hospital, cut its beds, or slow the spread, and compare against the run where nothing happened. For example, with Boston Medical Center closed from week 3, 83 of 230 tracts end up with poor access to care by week 6. With it open, none do.
The What would help panel reruns the model with each possible fix and ranks them by how many more people get a bed. In that same scenario, slowing the spread by 20% gets 3,839 more people a bed, against 713 for 25% more beds at Mass General and 444 for keeping BMC open. Prevention beat adding capacity by about five to one, which surprised us.
How we built it
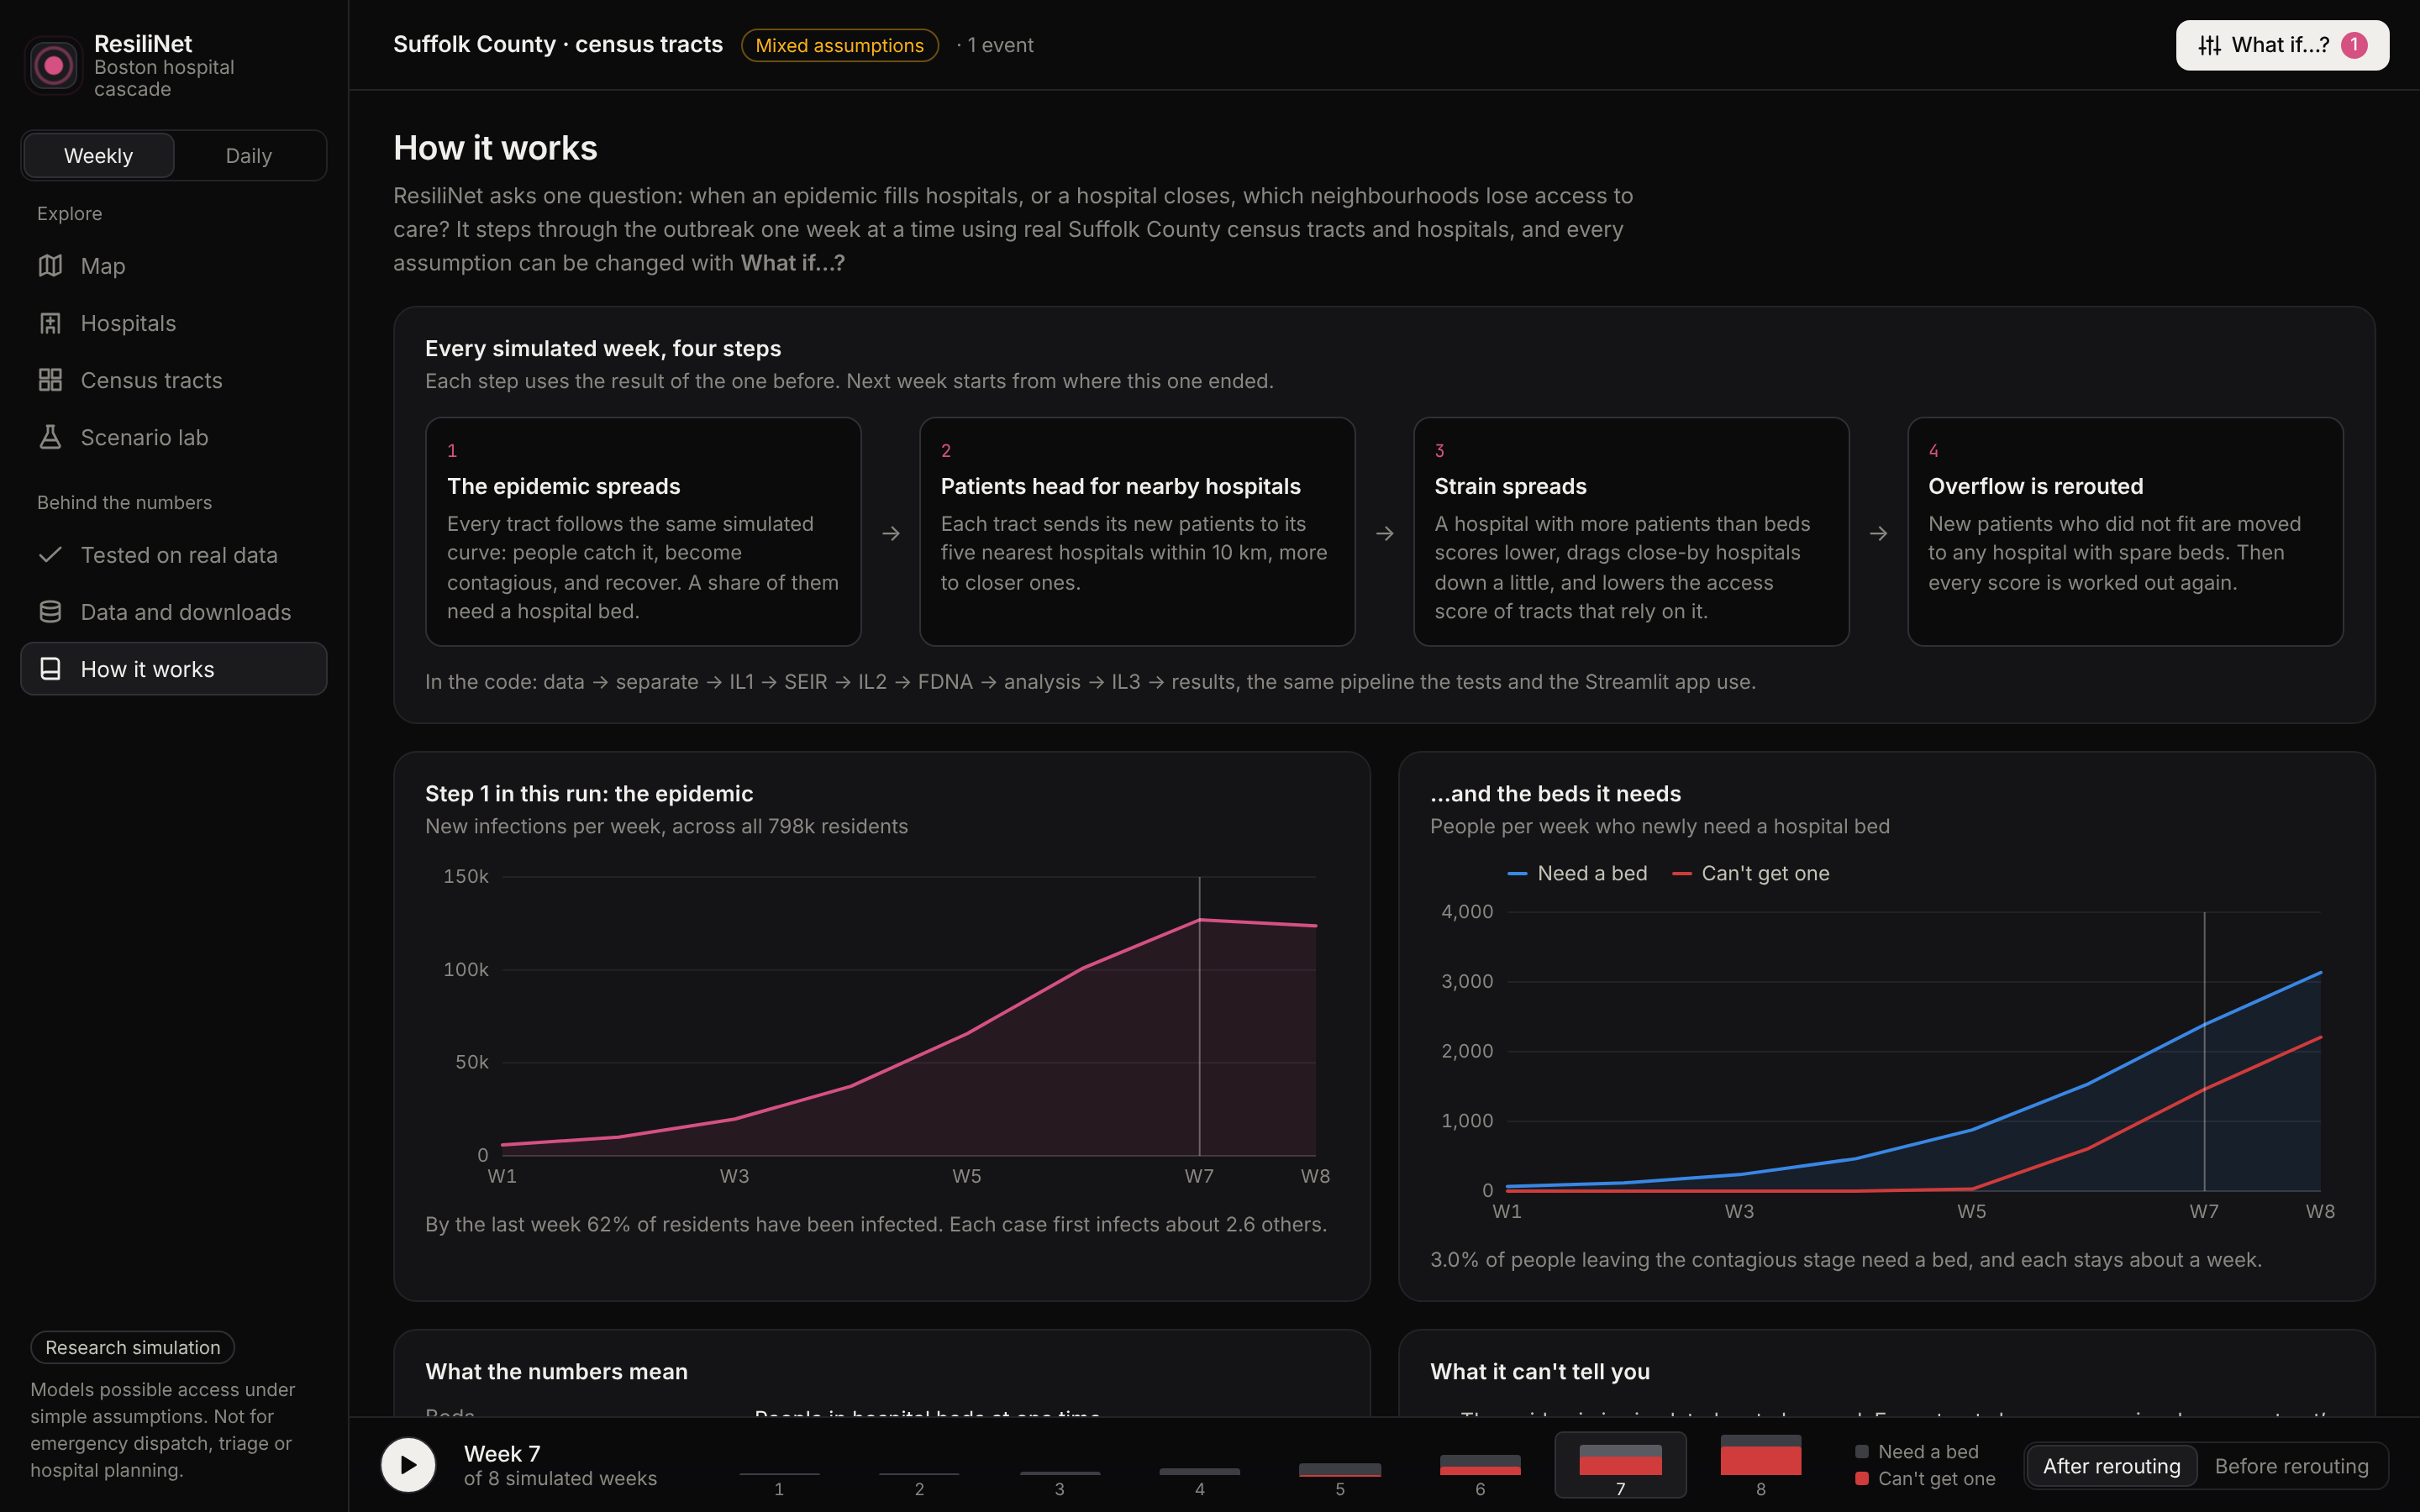
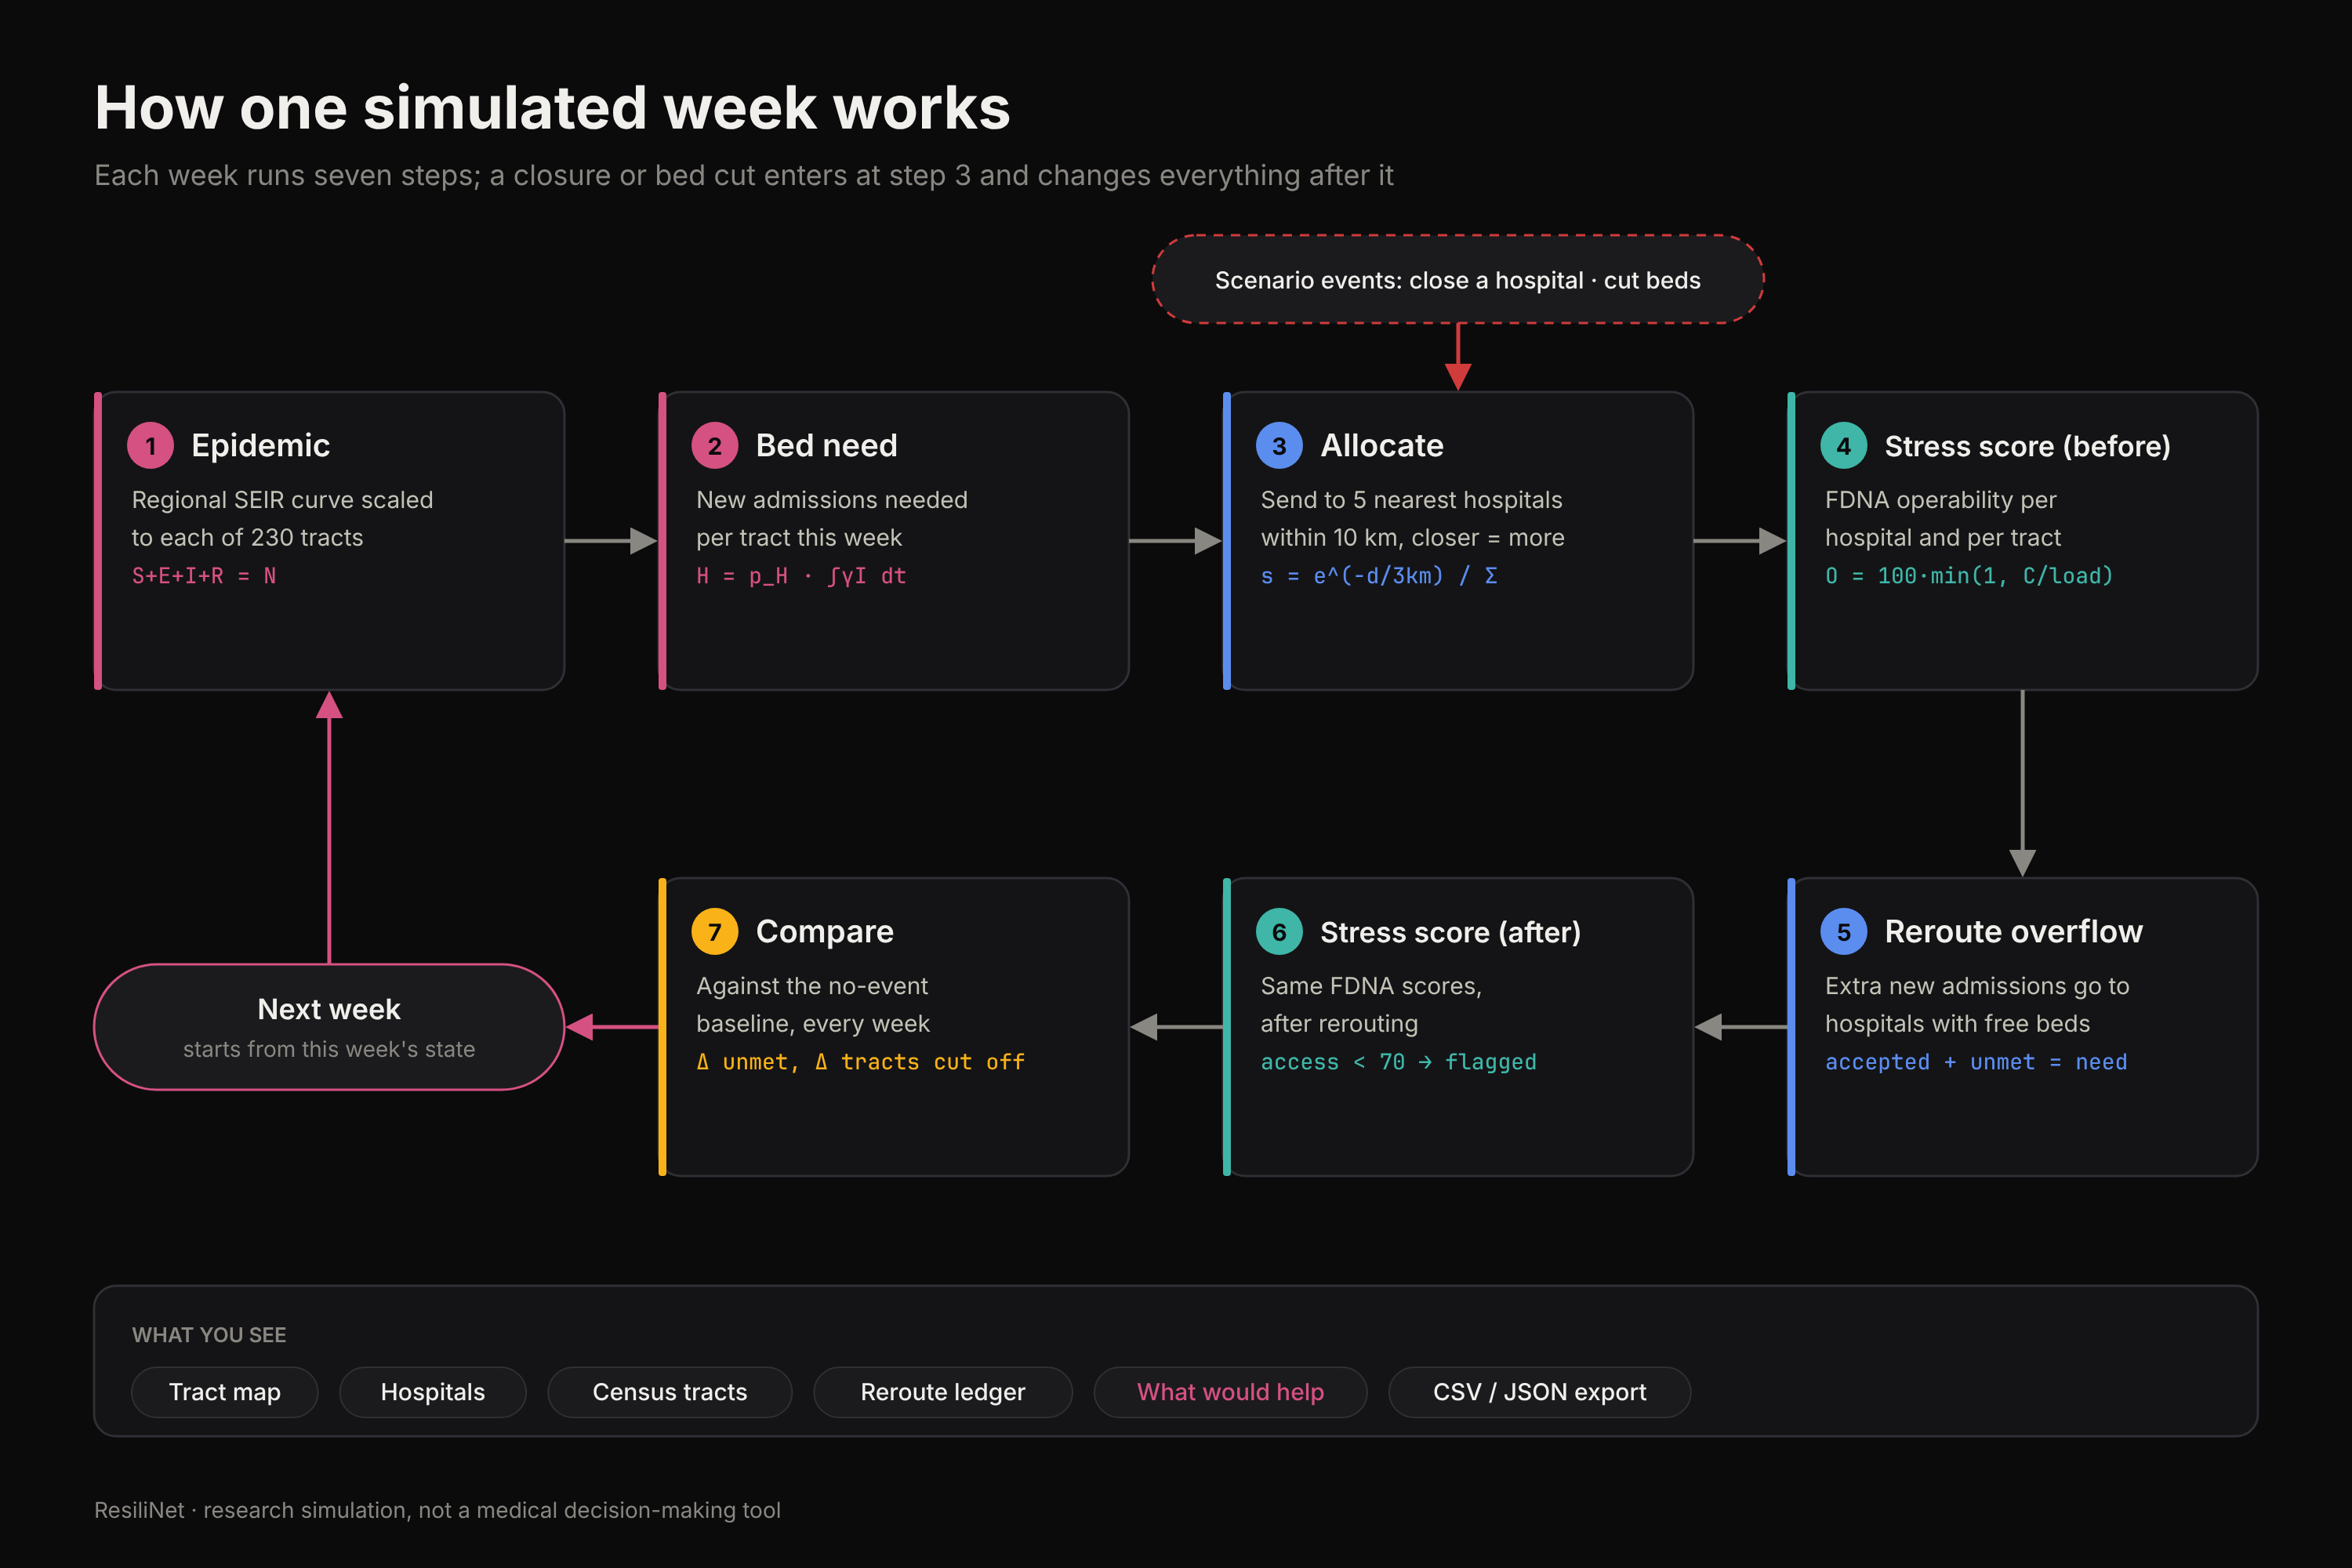
ResiliNet runs one simulated week at a time through four stages.
1. Epidemic. A regional SEIR model, scaled to each tract's population:
$$ \begin{aligned} \frac{dS}{dt} &= -\beta \frac{S I}{N} \ \frac{dE}{dt} &= \beta \frac{S I}{N} - \sigma E \ \frac{dI}{dt} &= \sigma E - \gamma I \ \frac{dR}{dt} &= \gamma I \end{aligned} \qquad \beta = \frac{R_0}{T_{\text{inf}}},\quad \sigma = \frac{1}{T_{\text{lat}}},\quad \gamma = \frac{1}{T_{\text{inf}}} $$
with $S + E + I + R = N$ checked every week. The weekly need for new beds in tract $j$ is a share of the people leaving $I$:
$$ H^{\text{need}}j(t) = p{H,j} \int_{t}^{t+1} \gamma \, I_j(\tau)\, d\tau $$
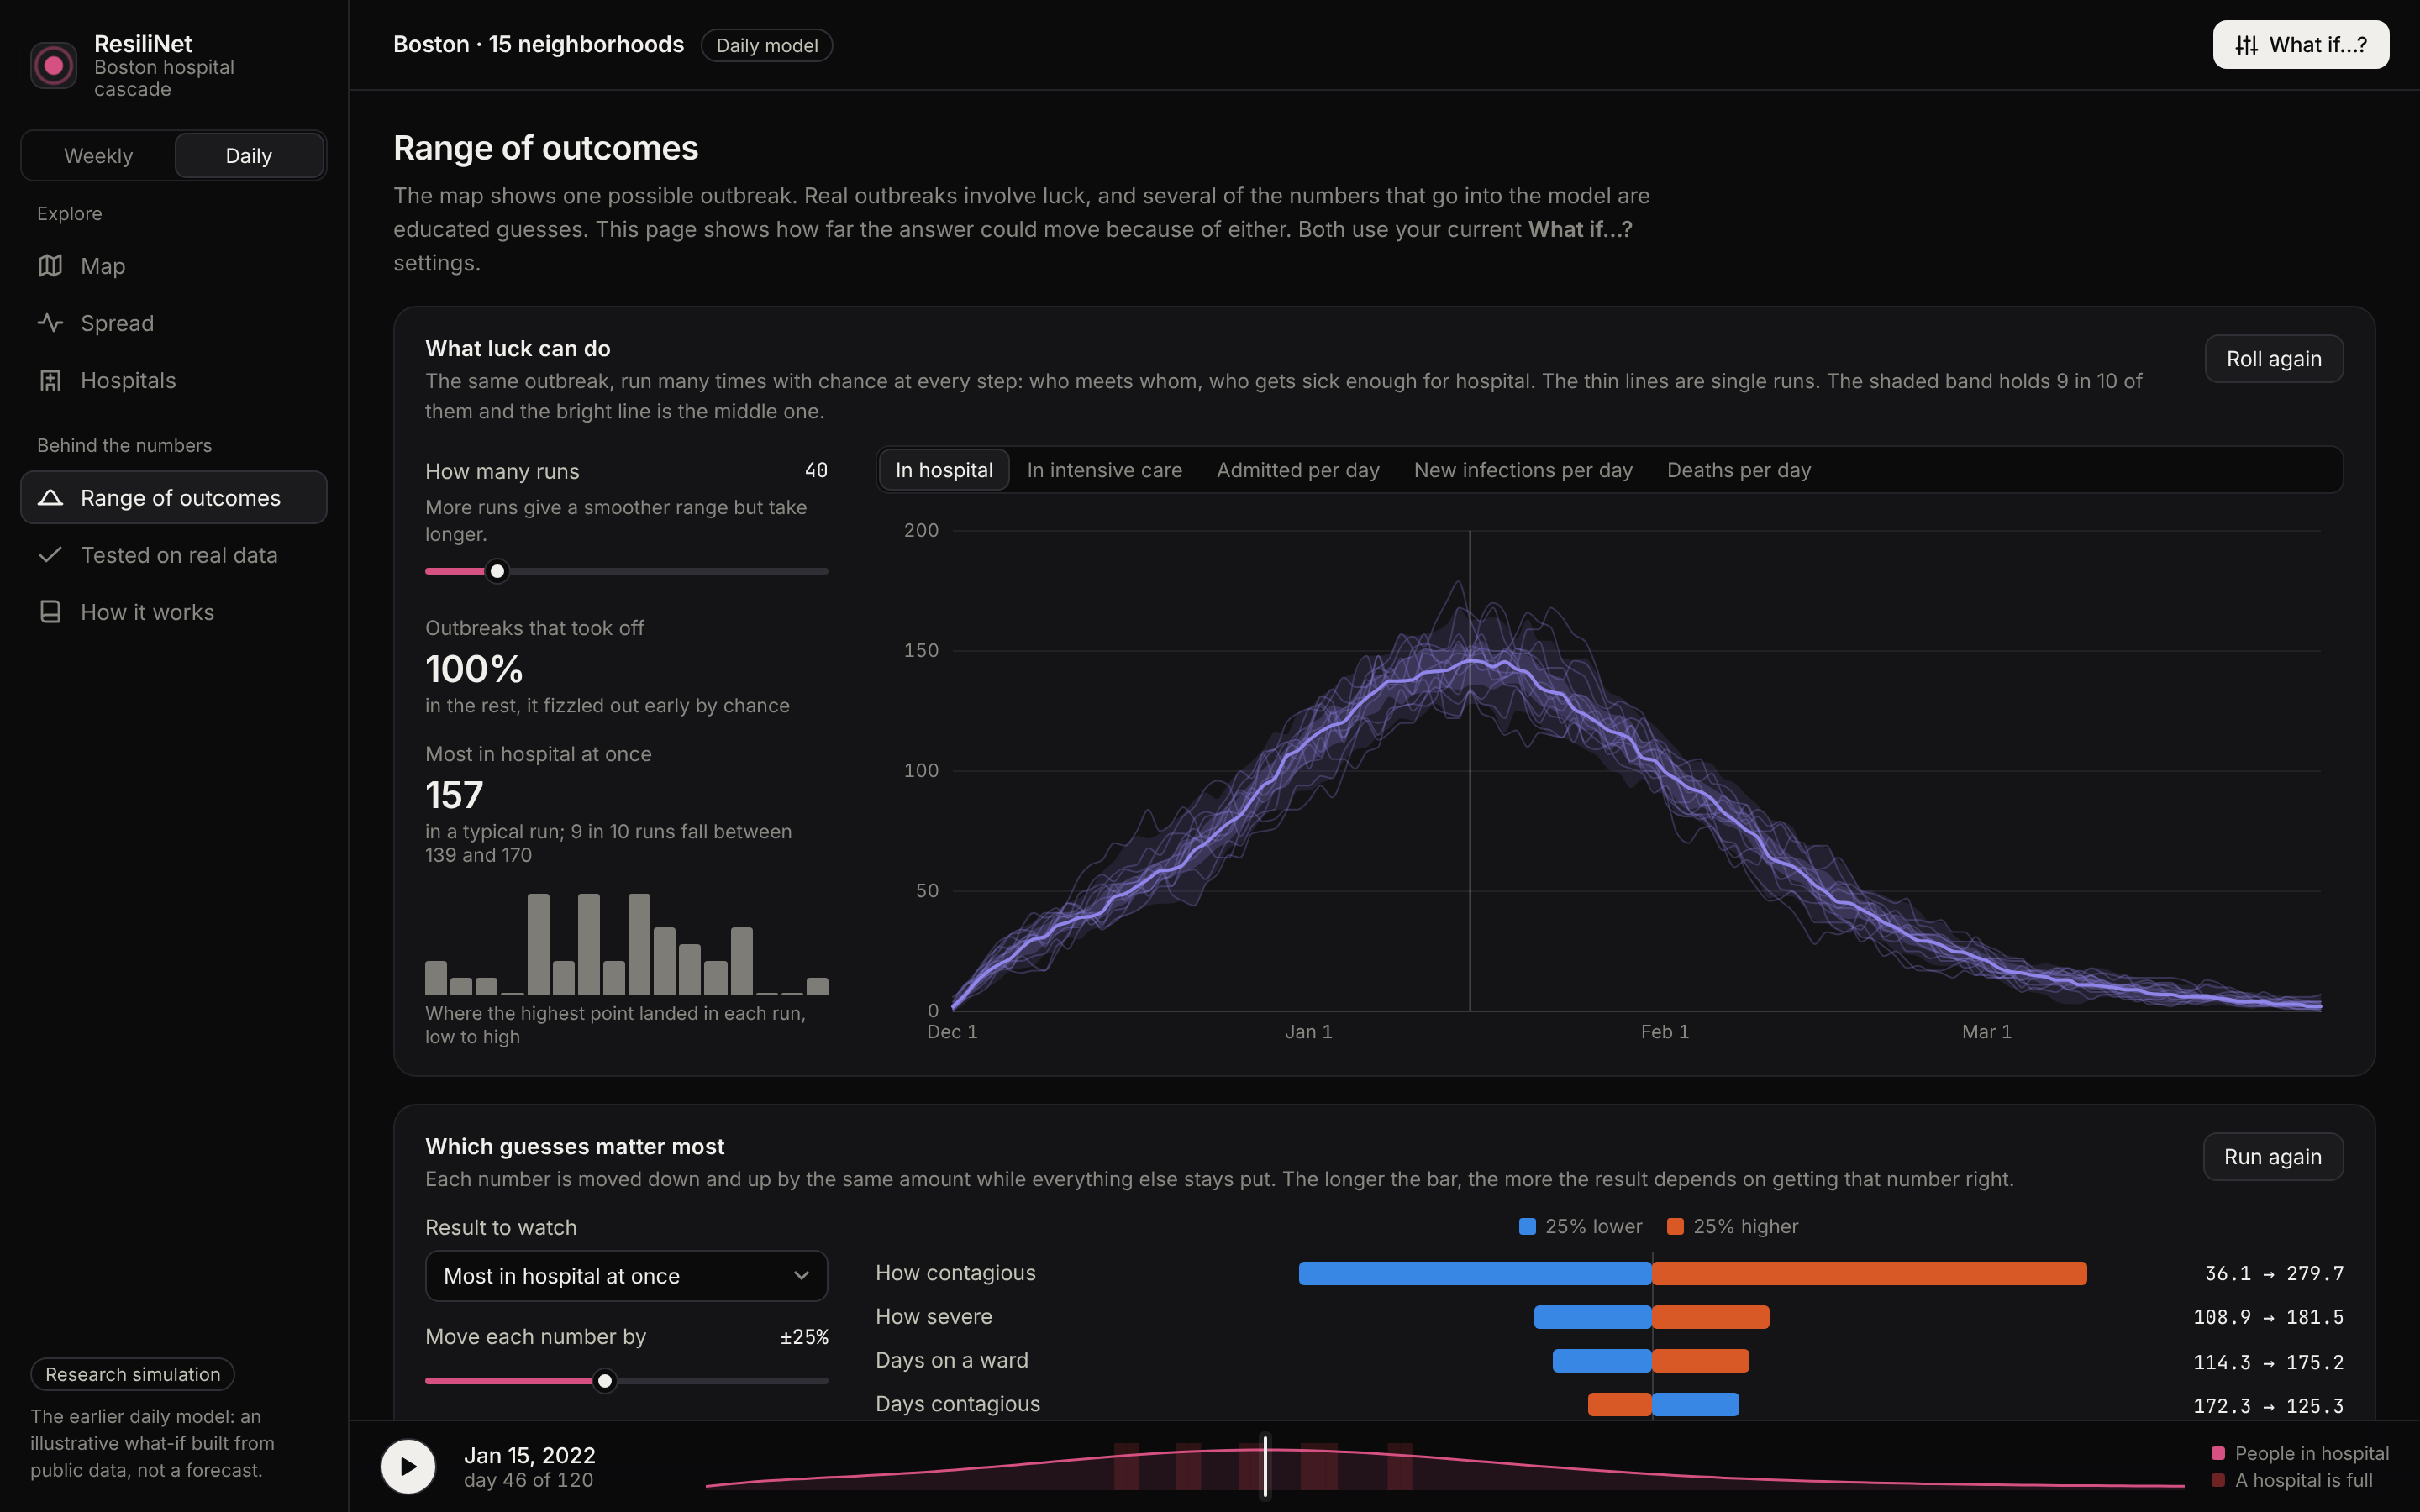
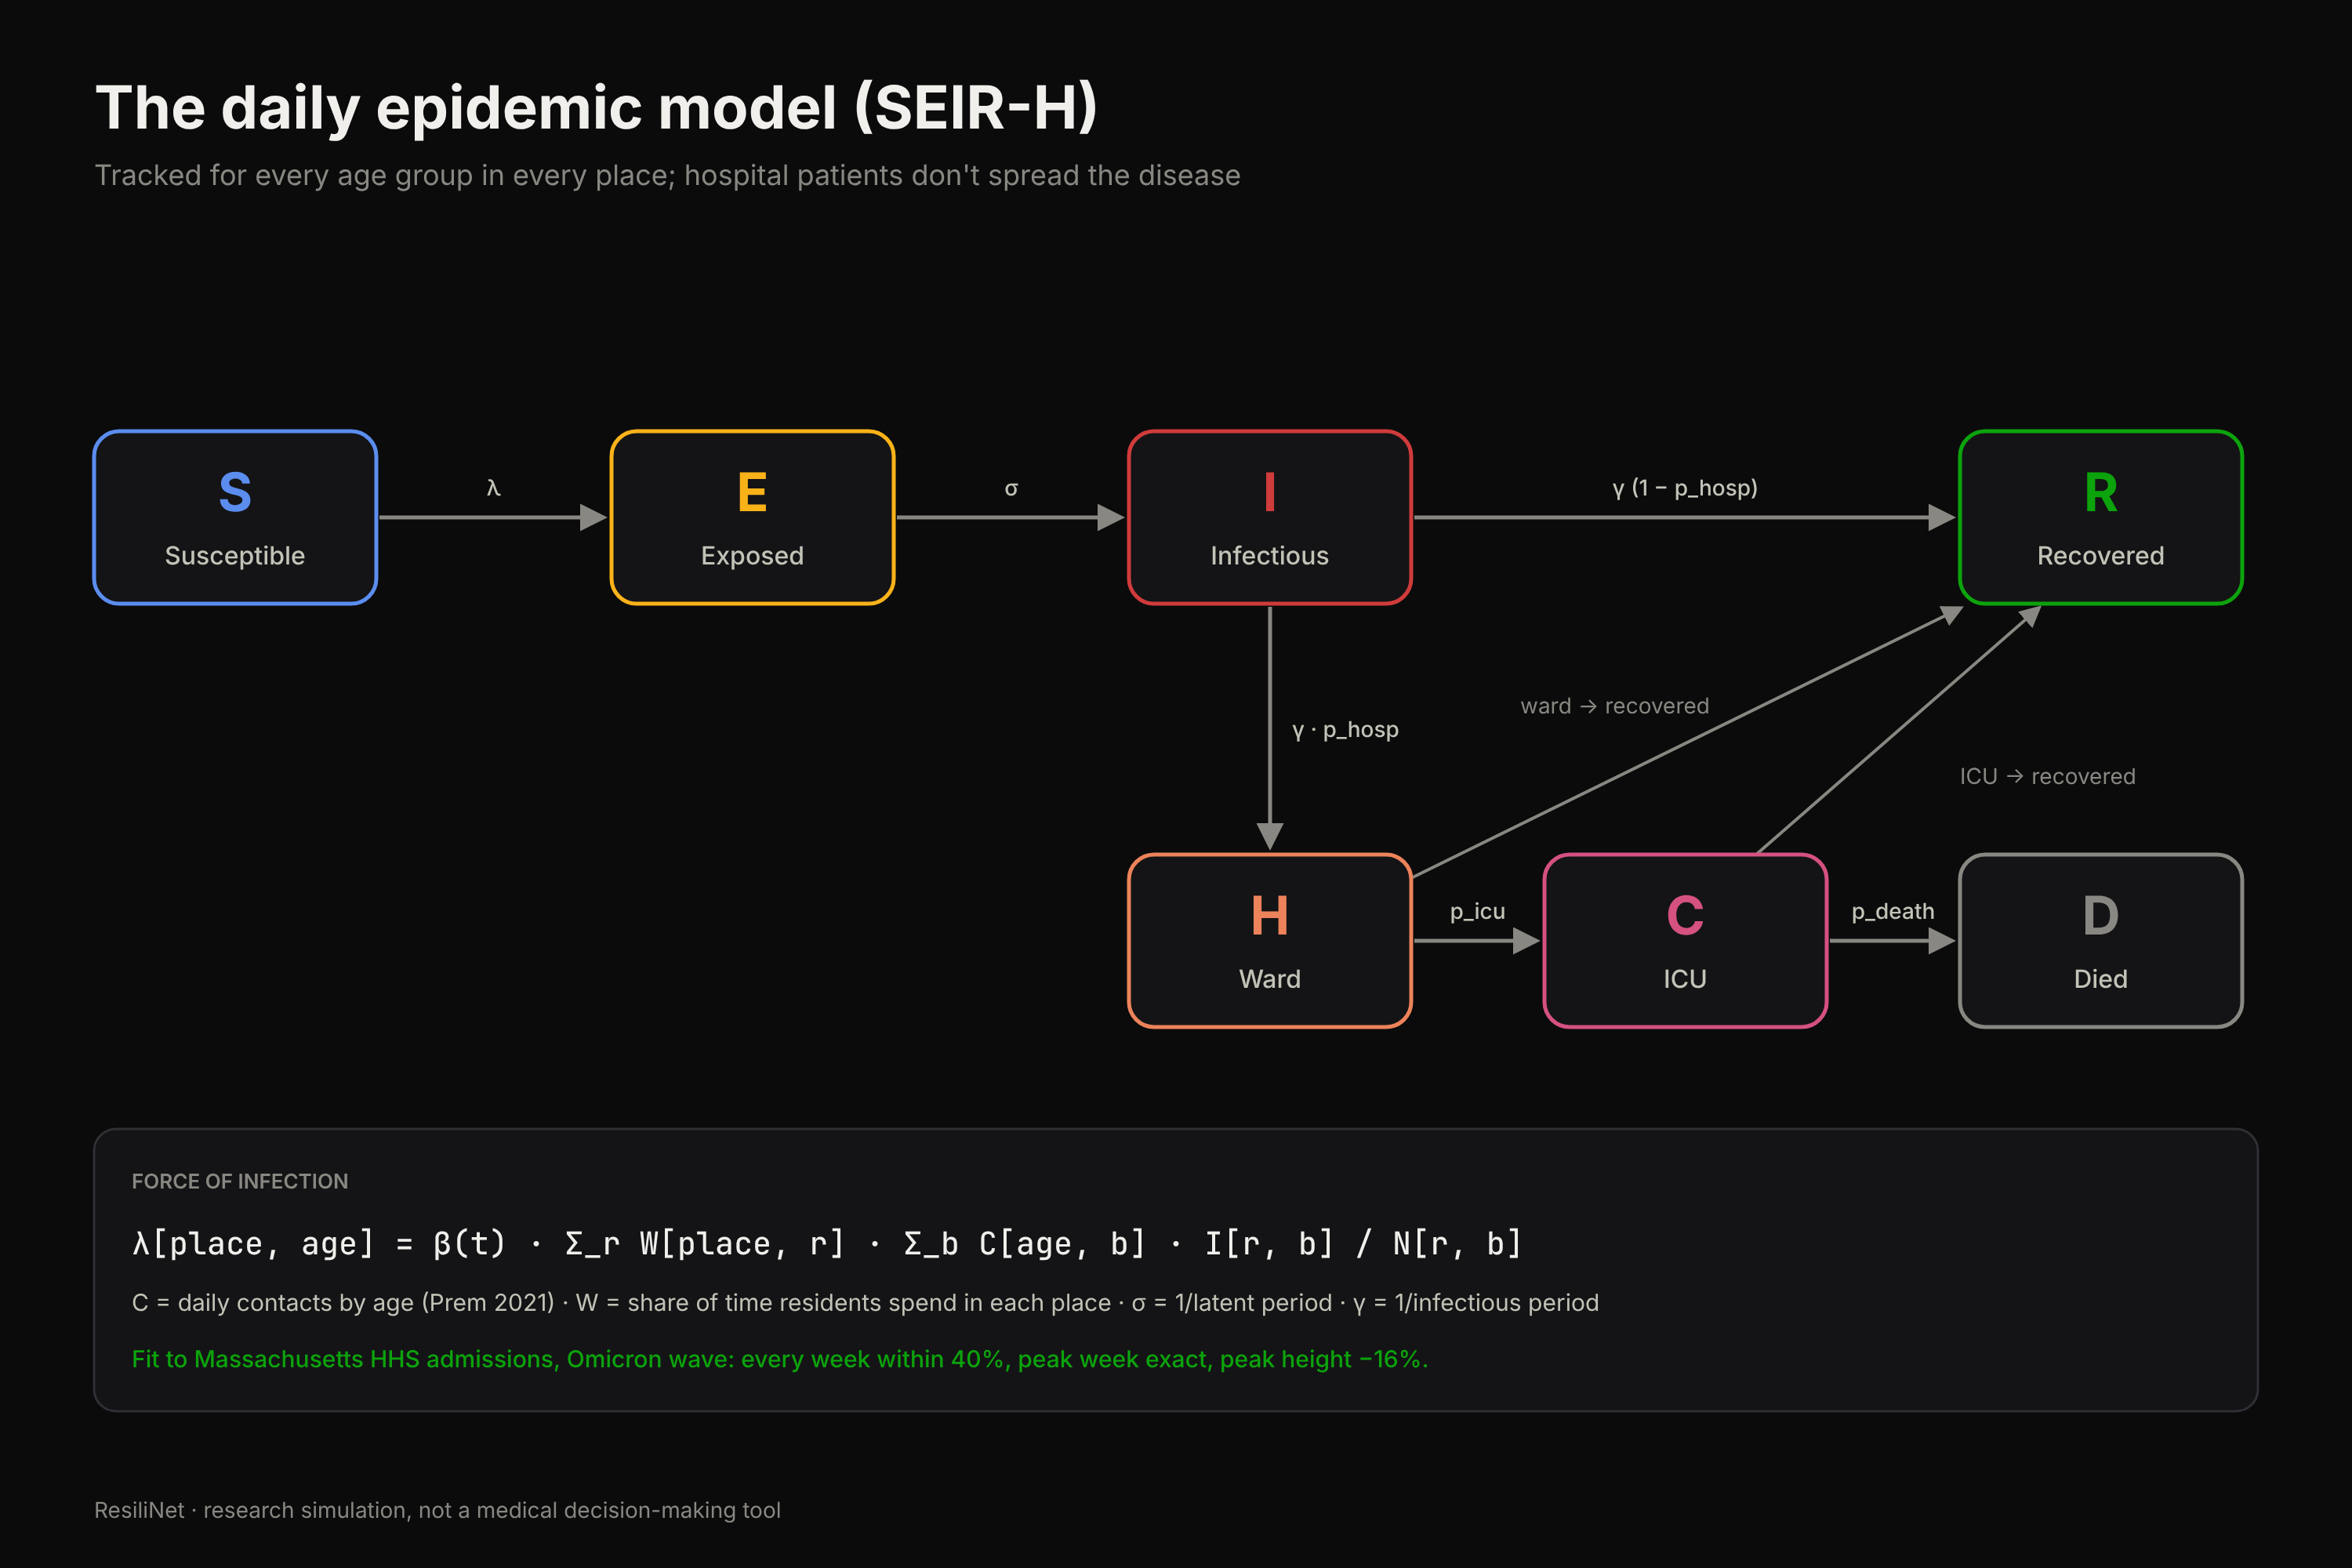
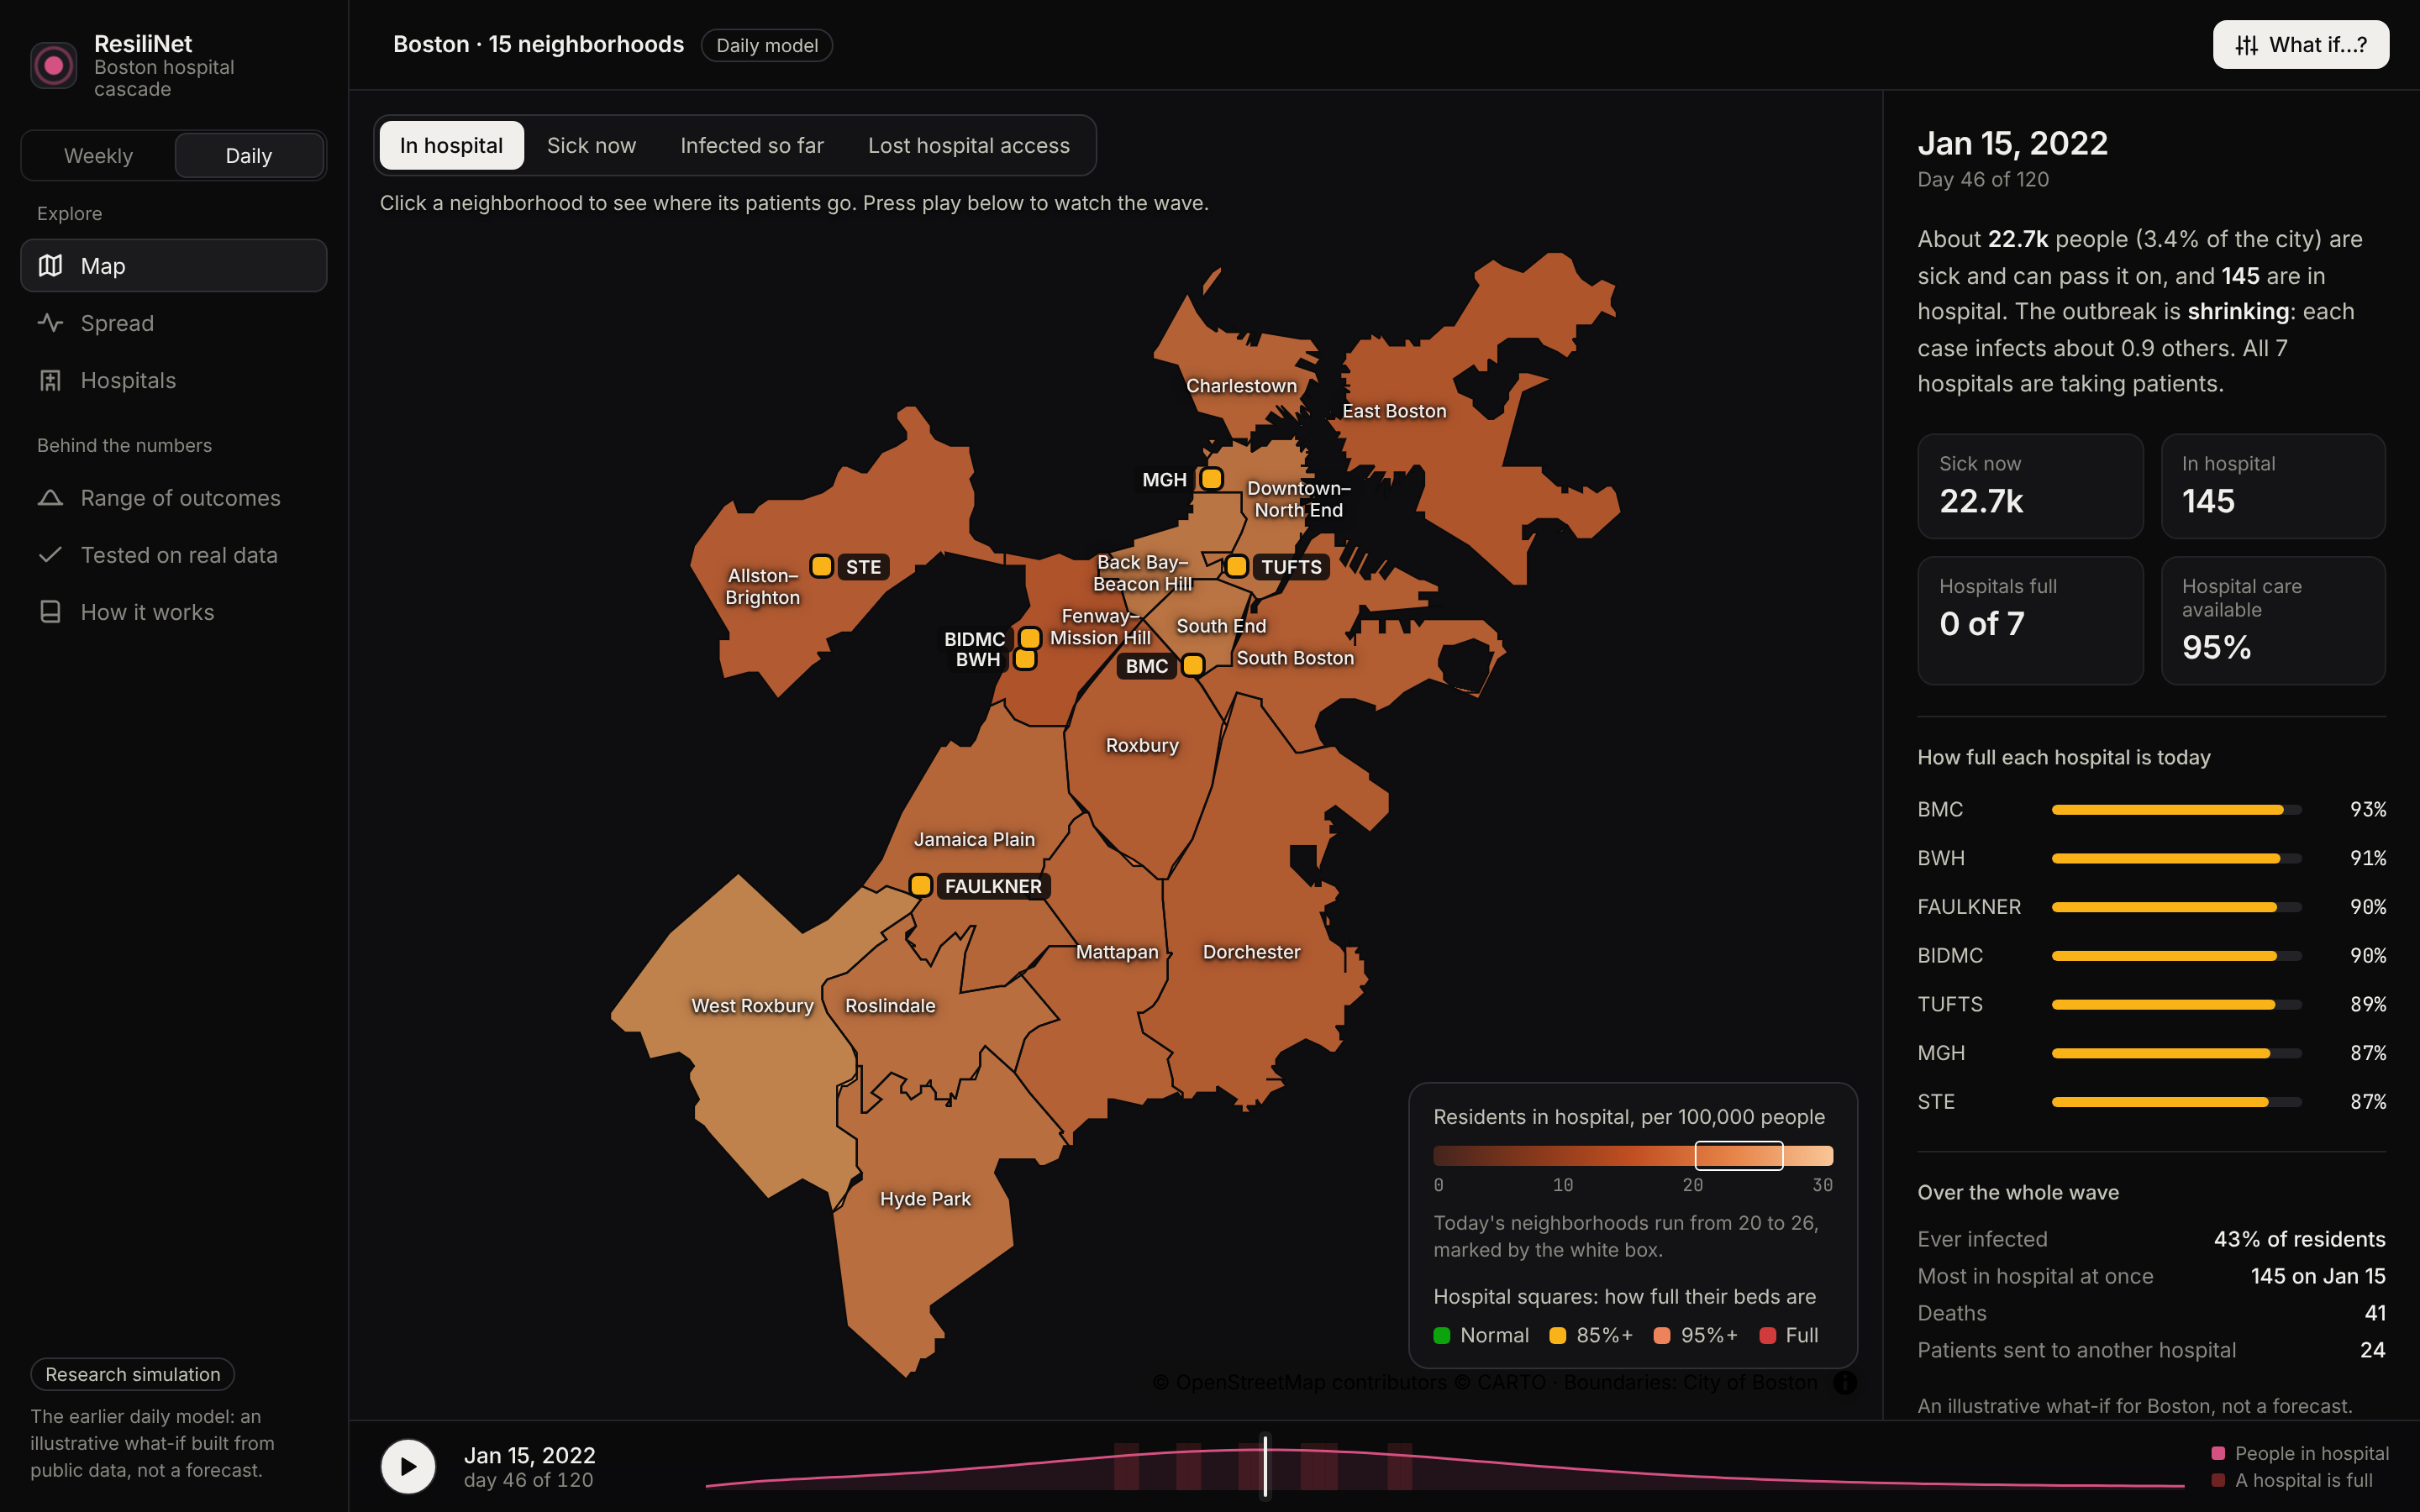
We also built a richer daily model with age groups, ward and ICU stays, and a mixing matrix between places:
$$ \lambda_{p,a} = \beta(t) \sum_r W_{p r} \sum_b C_{a b} \frac{I^{\text{loc}}{r b}}{N^{\text{loc}}{r b}} $$
where $C$ is daily contacts by age (Prem et al. 2021) and $W_{pr}$ is how much time residents of place $p$ spend in place $r$. We fit it to Massachusetts HHS weekly COVID admissions for the Omicron wave: every week landed within 40% of the real number, the peak week was exact, and the peak height was 16% low.
2. Where patients go. Each tract sends its patients to its five nearest hospitals within 10 km, with closer ones getting a larger share:
$$ a_{ji} = e^{-d_{ji}/d_0}, \qquad s_{ji} = \frac{a_{ji}}{\sum_h a_{jh}} $$
If a hospital is full, the extra new admissions are offered to other eligible hospitals with free beds. Whatever still can't be placed is counted as unmet need. Patients already in a bed never move.
3. How stress spreads (FDNA). We adapted Functional Dependency Network Analysis, an idea from infrastructure engineering, to hospitals. Each hospital gets an operability score from its load:
$$ O_i = 100 \cdot \min!\left(1, \frac{C^{\text{eff}}_i}{\text{load}_i}\right) $$
Nearby hospitals then pull each other down through a fixed-point iteration, and each tract's access score blends the hospitals it depends on:
$$ \text{Score}j = \min!\Big(\alpha_D \sum_i s{ji} P_i + (1-\alpha_D)\cdot 100,\;\; \min_{i} \big(P_i + 100(1 - s_{ji})\big)\Big) $$
4. Compare. Scores are computed before and after rerouting, and every scenario is compared with the no-event baseline.
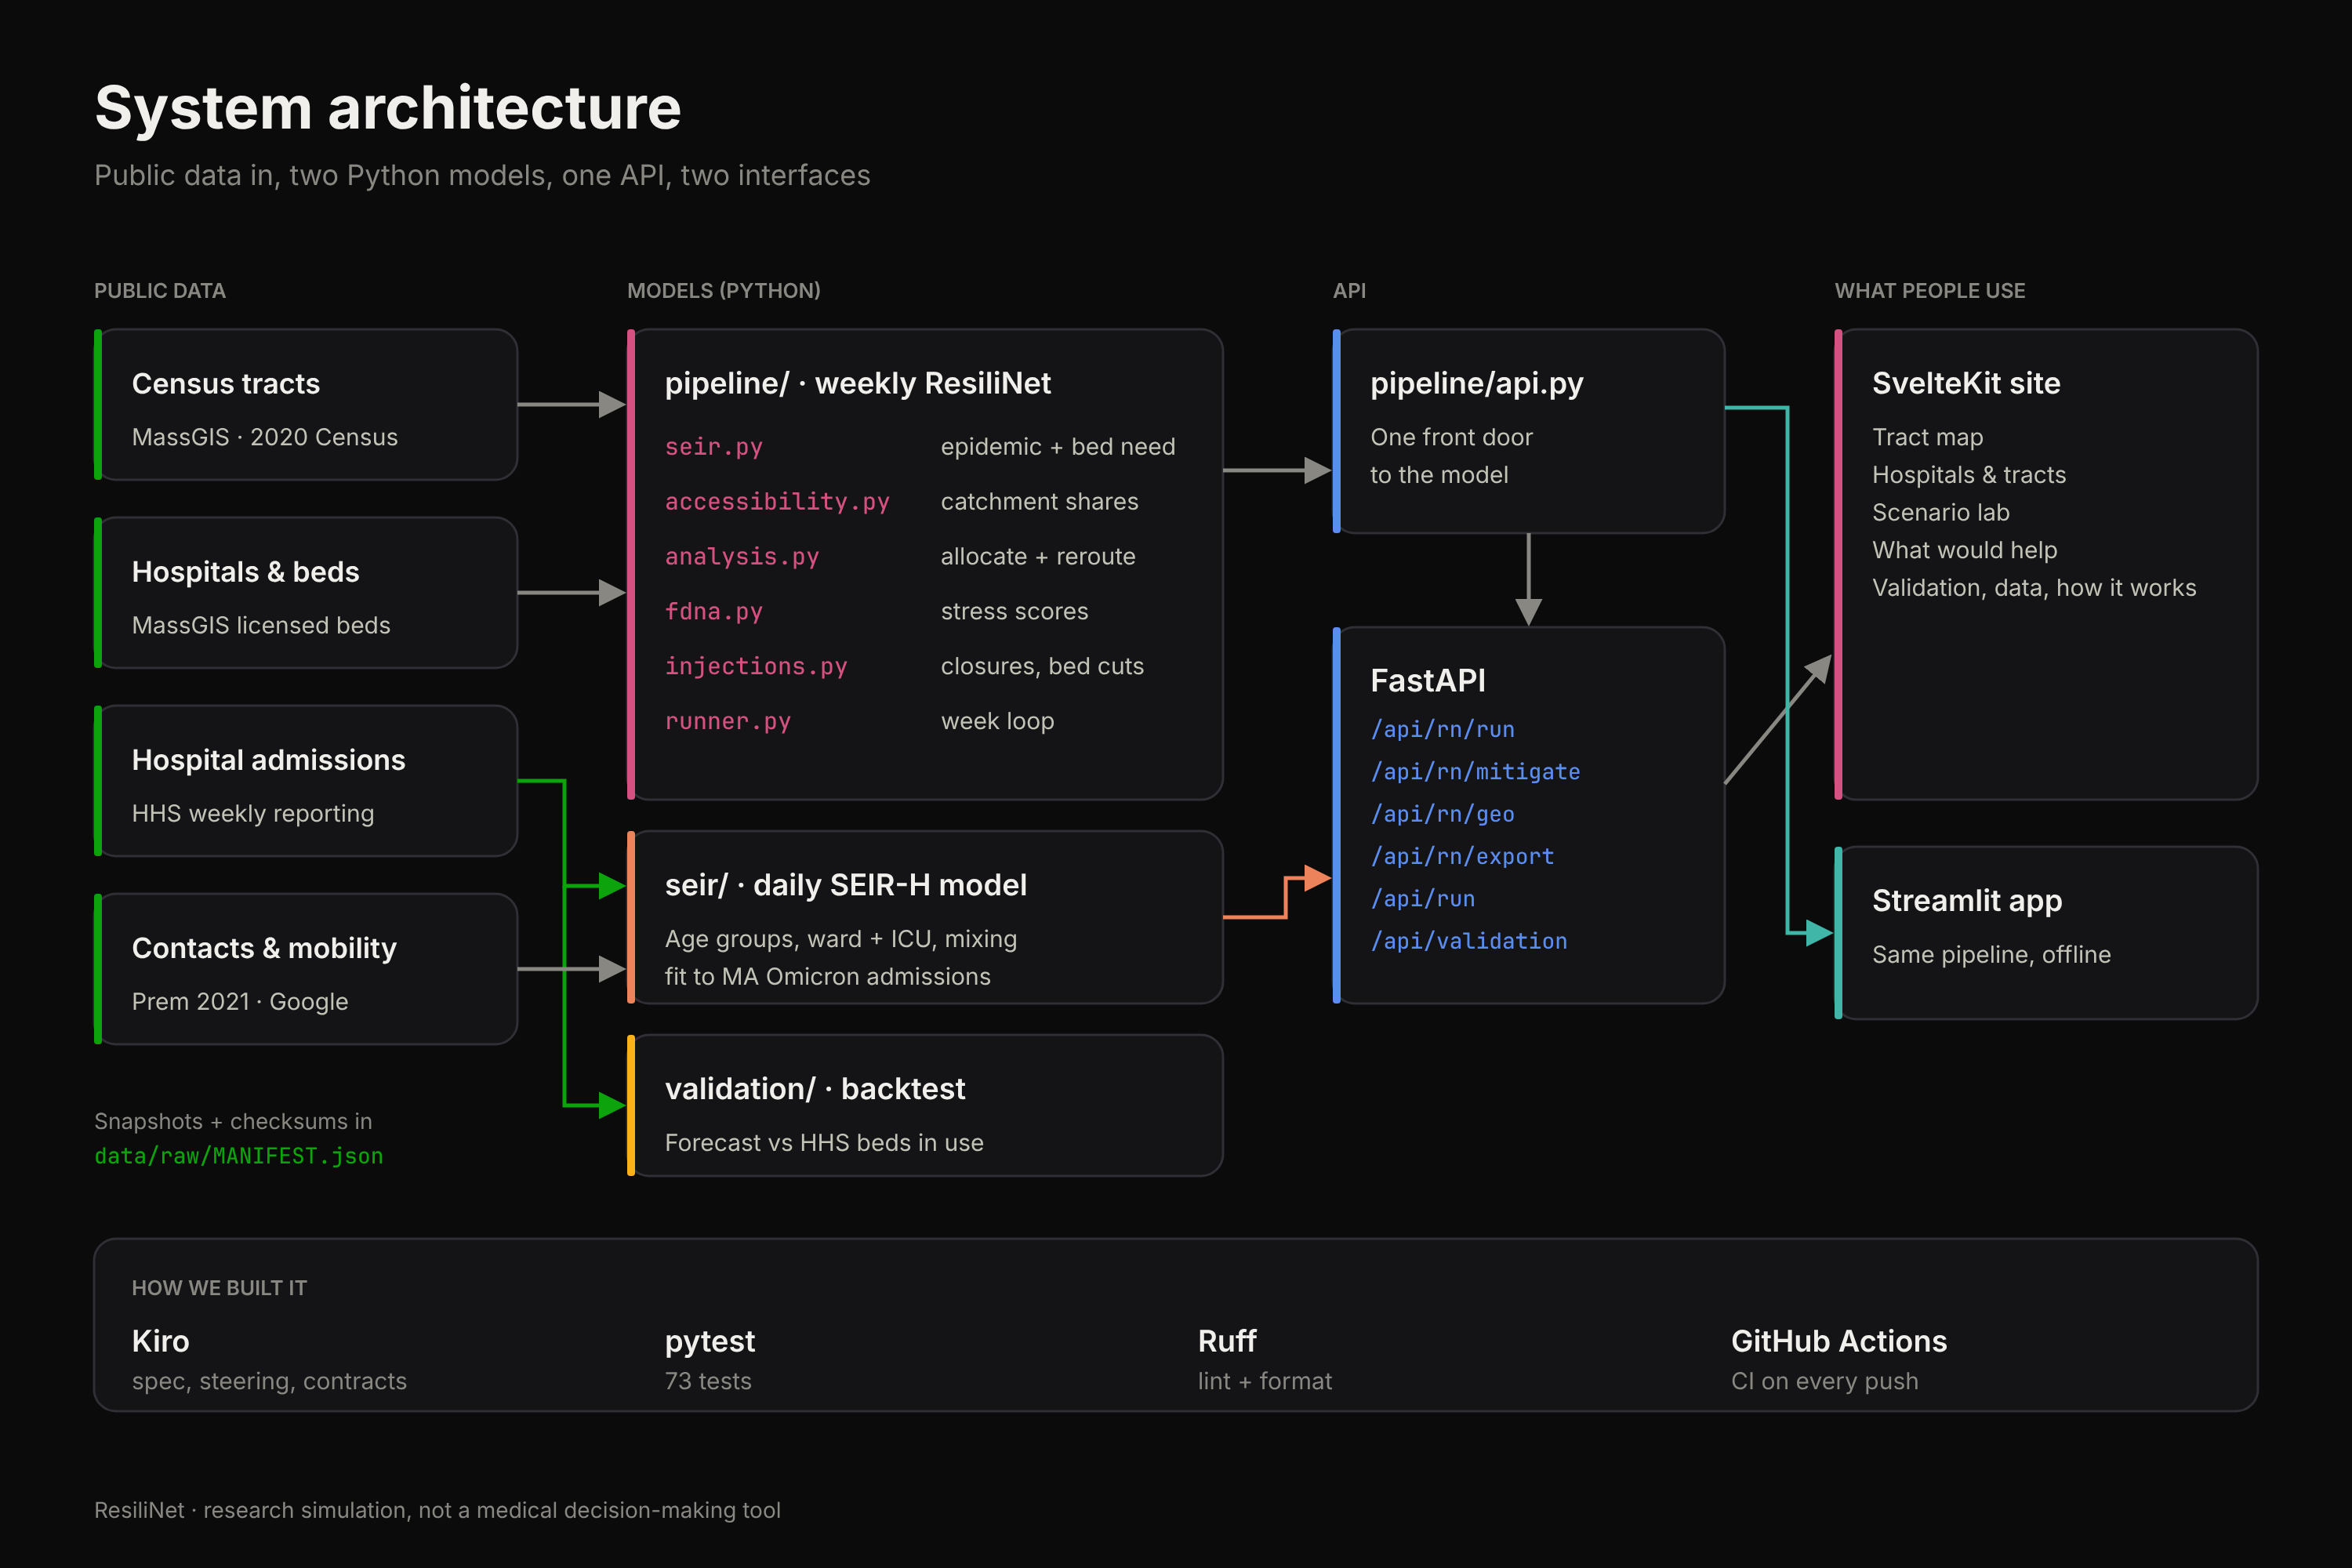
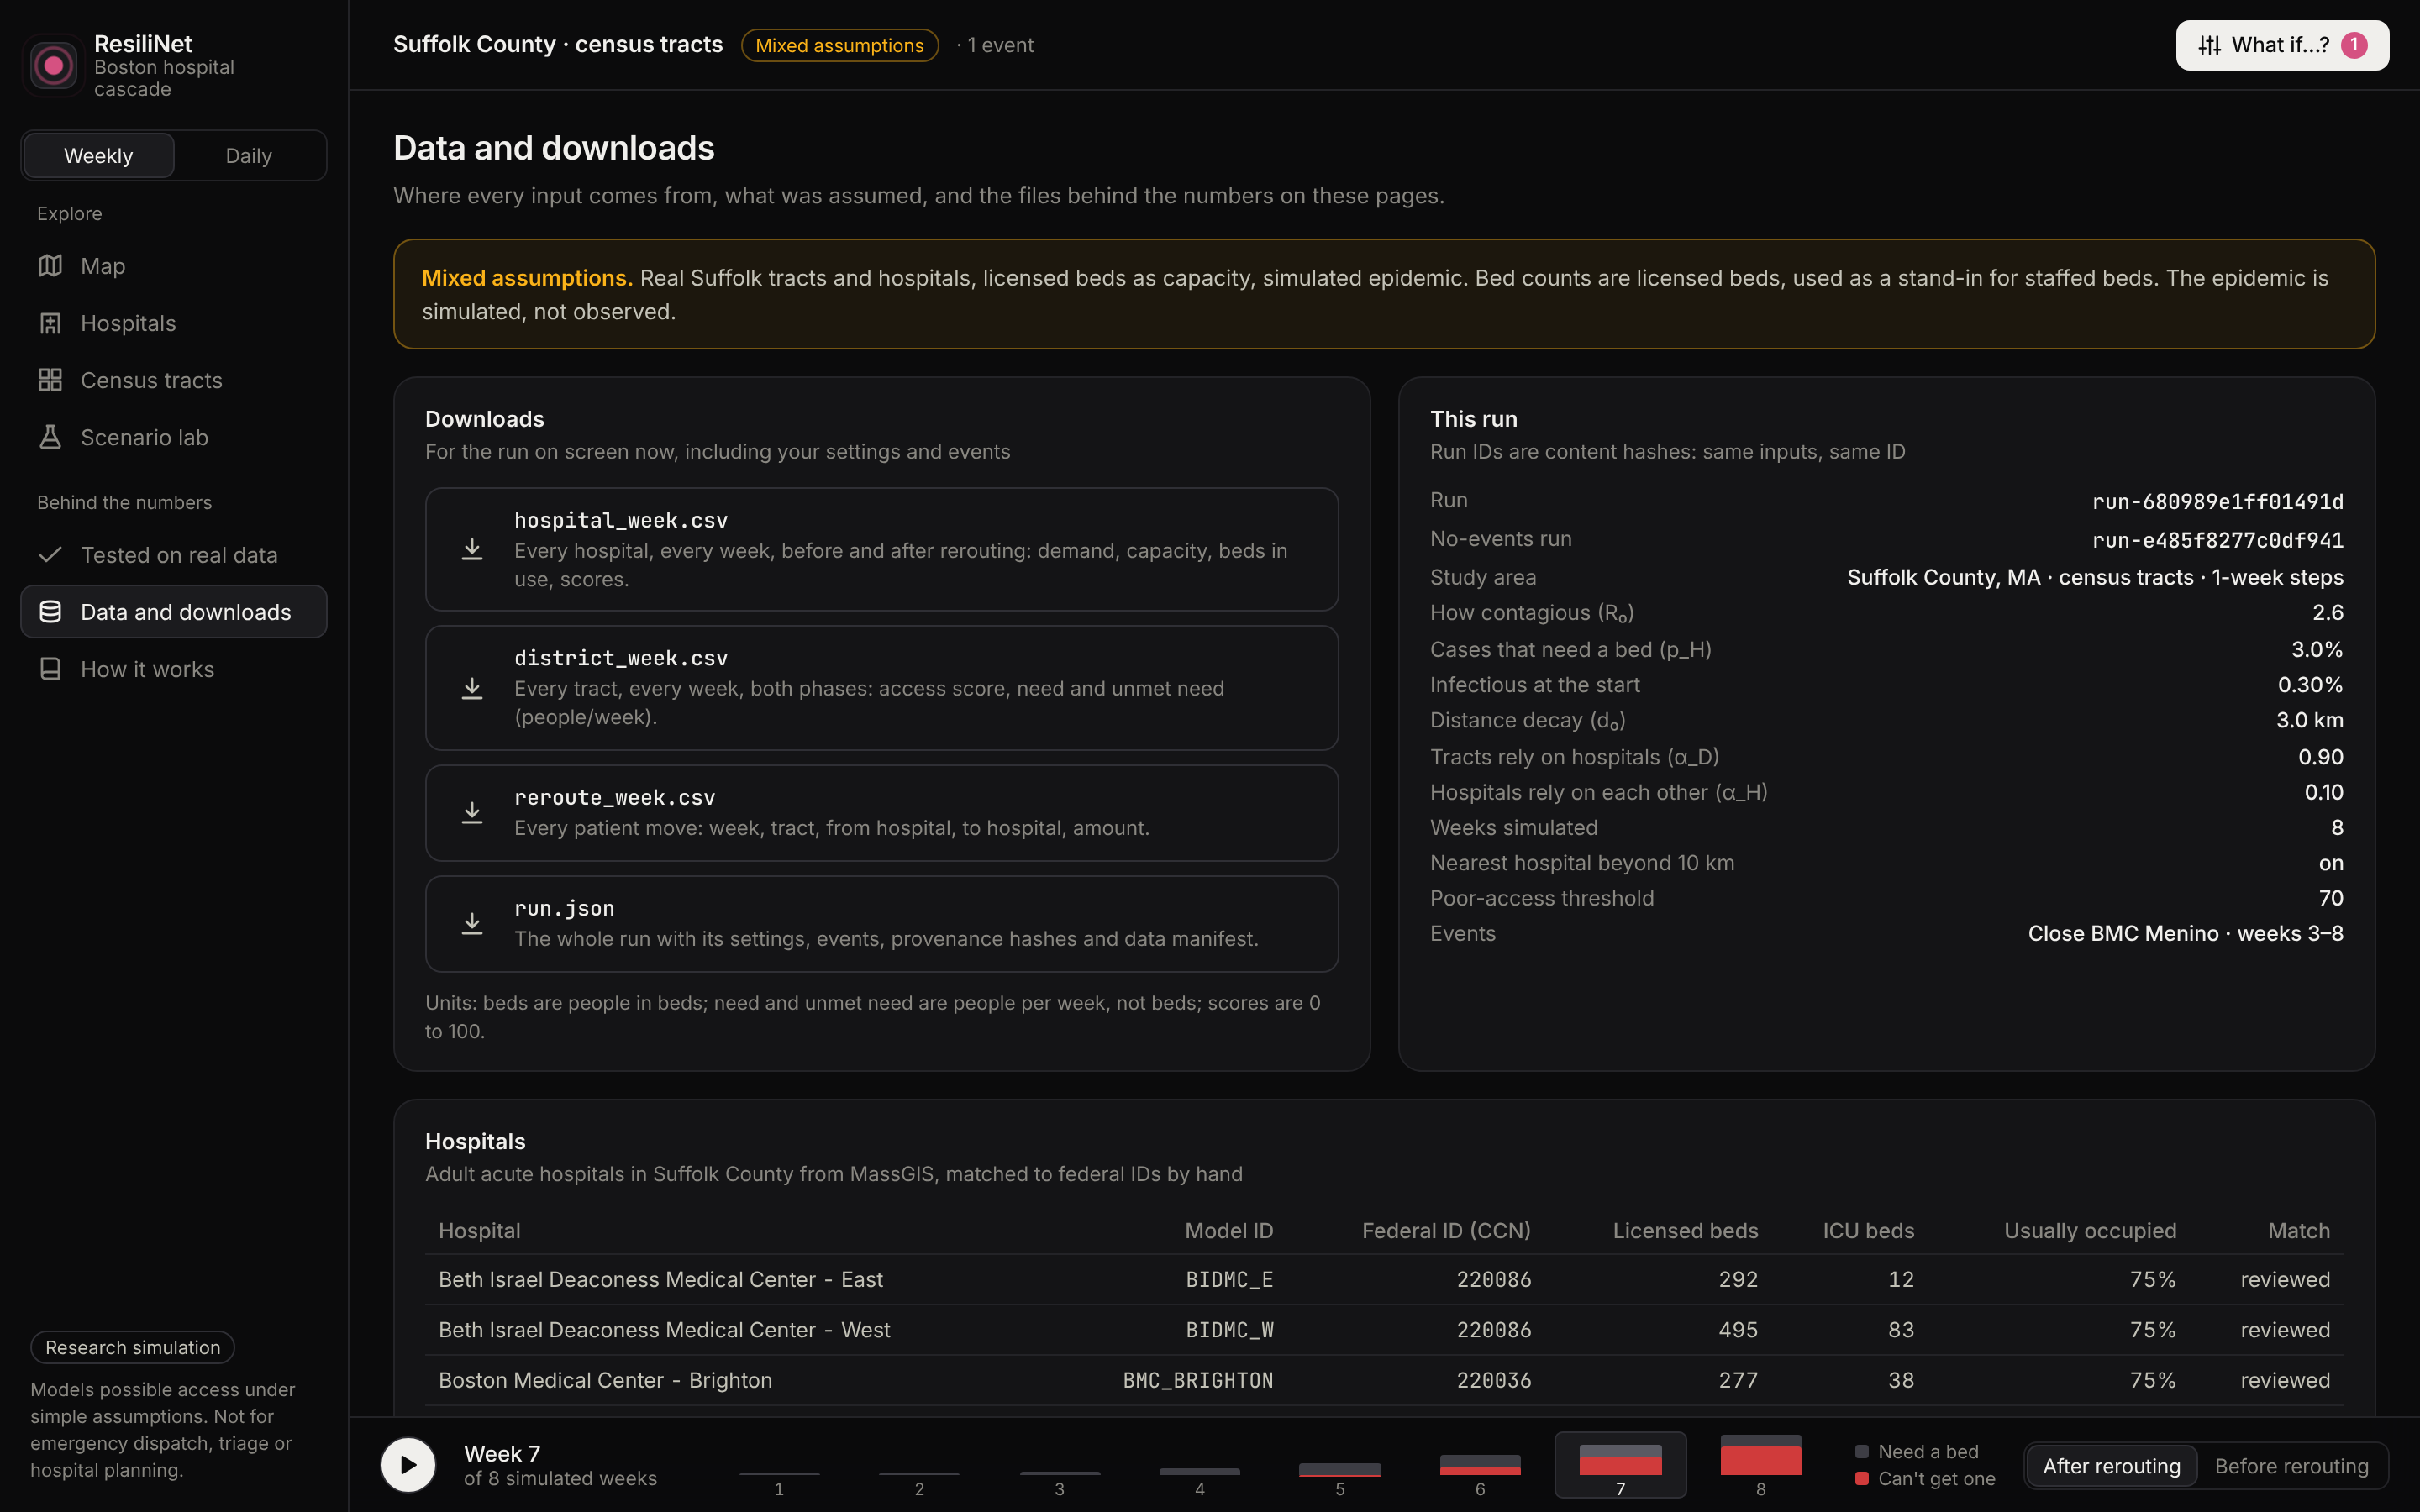
Stack. Python with NumPy, SciPy and pandas for the model. FastAPI serves it to a SvelteKit site with a map of the tracts, hospital and tract views, a scenario lab, a reroute ledger, and the What would help panel. A Streamlit app runs the same pipeline offline. Real geography comes from MassGIS (2020 Census tracts, hospital locations and licensed beds), and validation uses HHS hospital reporting. We planned it in Kiro with steering files, a spec, and written contracts for every object passed between stages, then split the work into parallel workstreams. GitHub Actions runs 73 tests, lint and the demo scripts.
Challenges we ran into
- Our first design double-counted patients. An early draft rerouted everyone in a bed every week, so the same patients bounced between hospitals and "unmet need" got mixed up with occupied beds. We rewrote the model so only new admissions are rerouted and existing patients stay put.
- Some things can't be learned from admissions alone. Refitting the Omicron wave at 0%, 22%, 40% or 50% prior immunity gave exactly the same fit. Admissions only pin down the effective reproduction number, so we had to take immunity from the literature instead of fitting it.
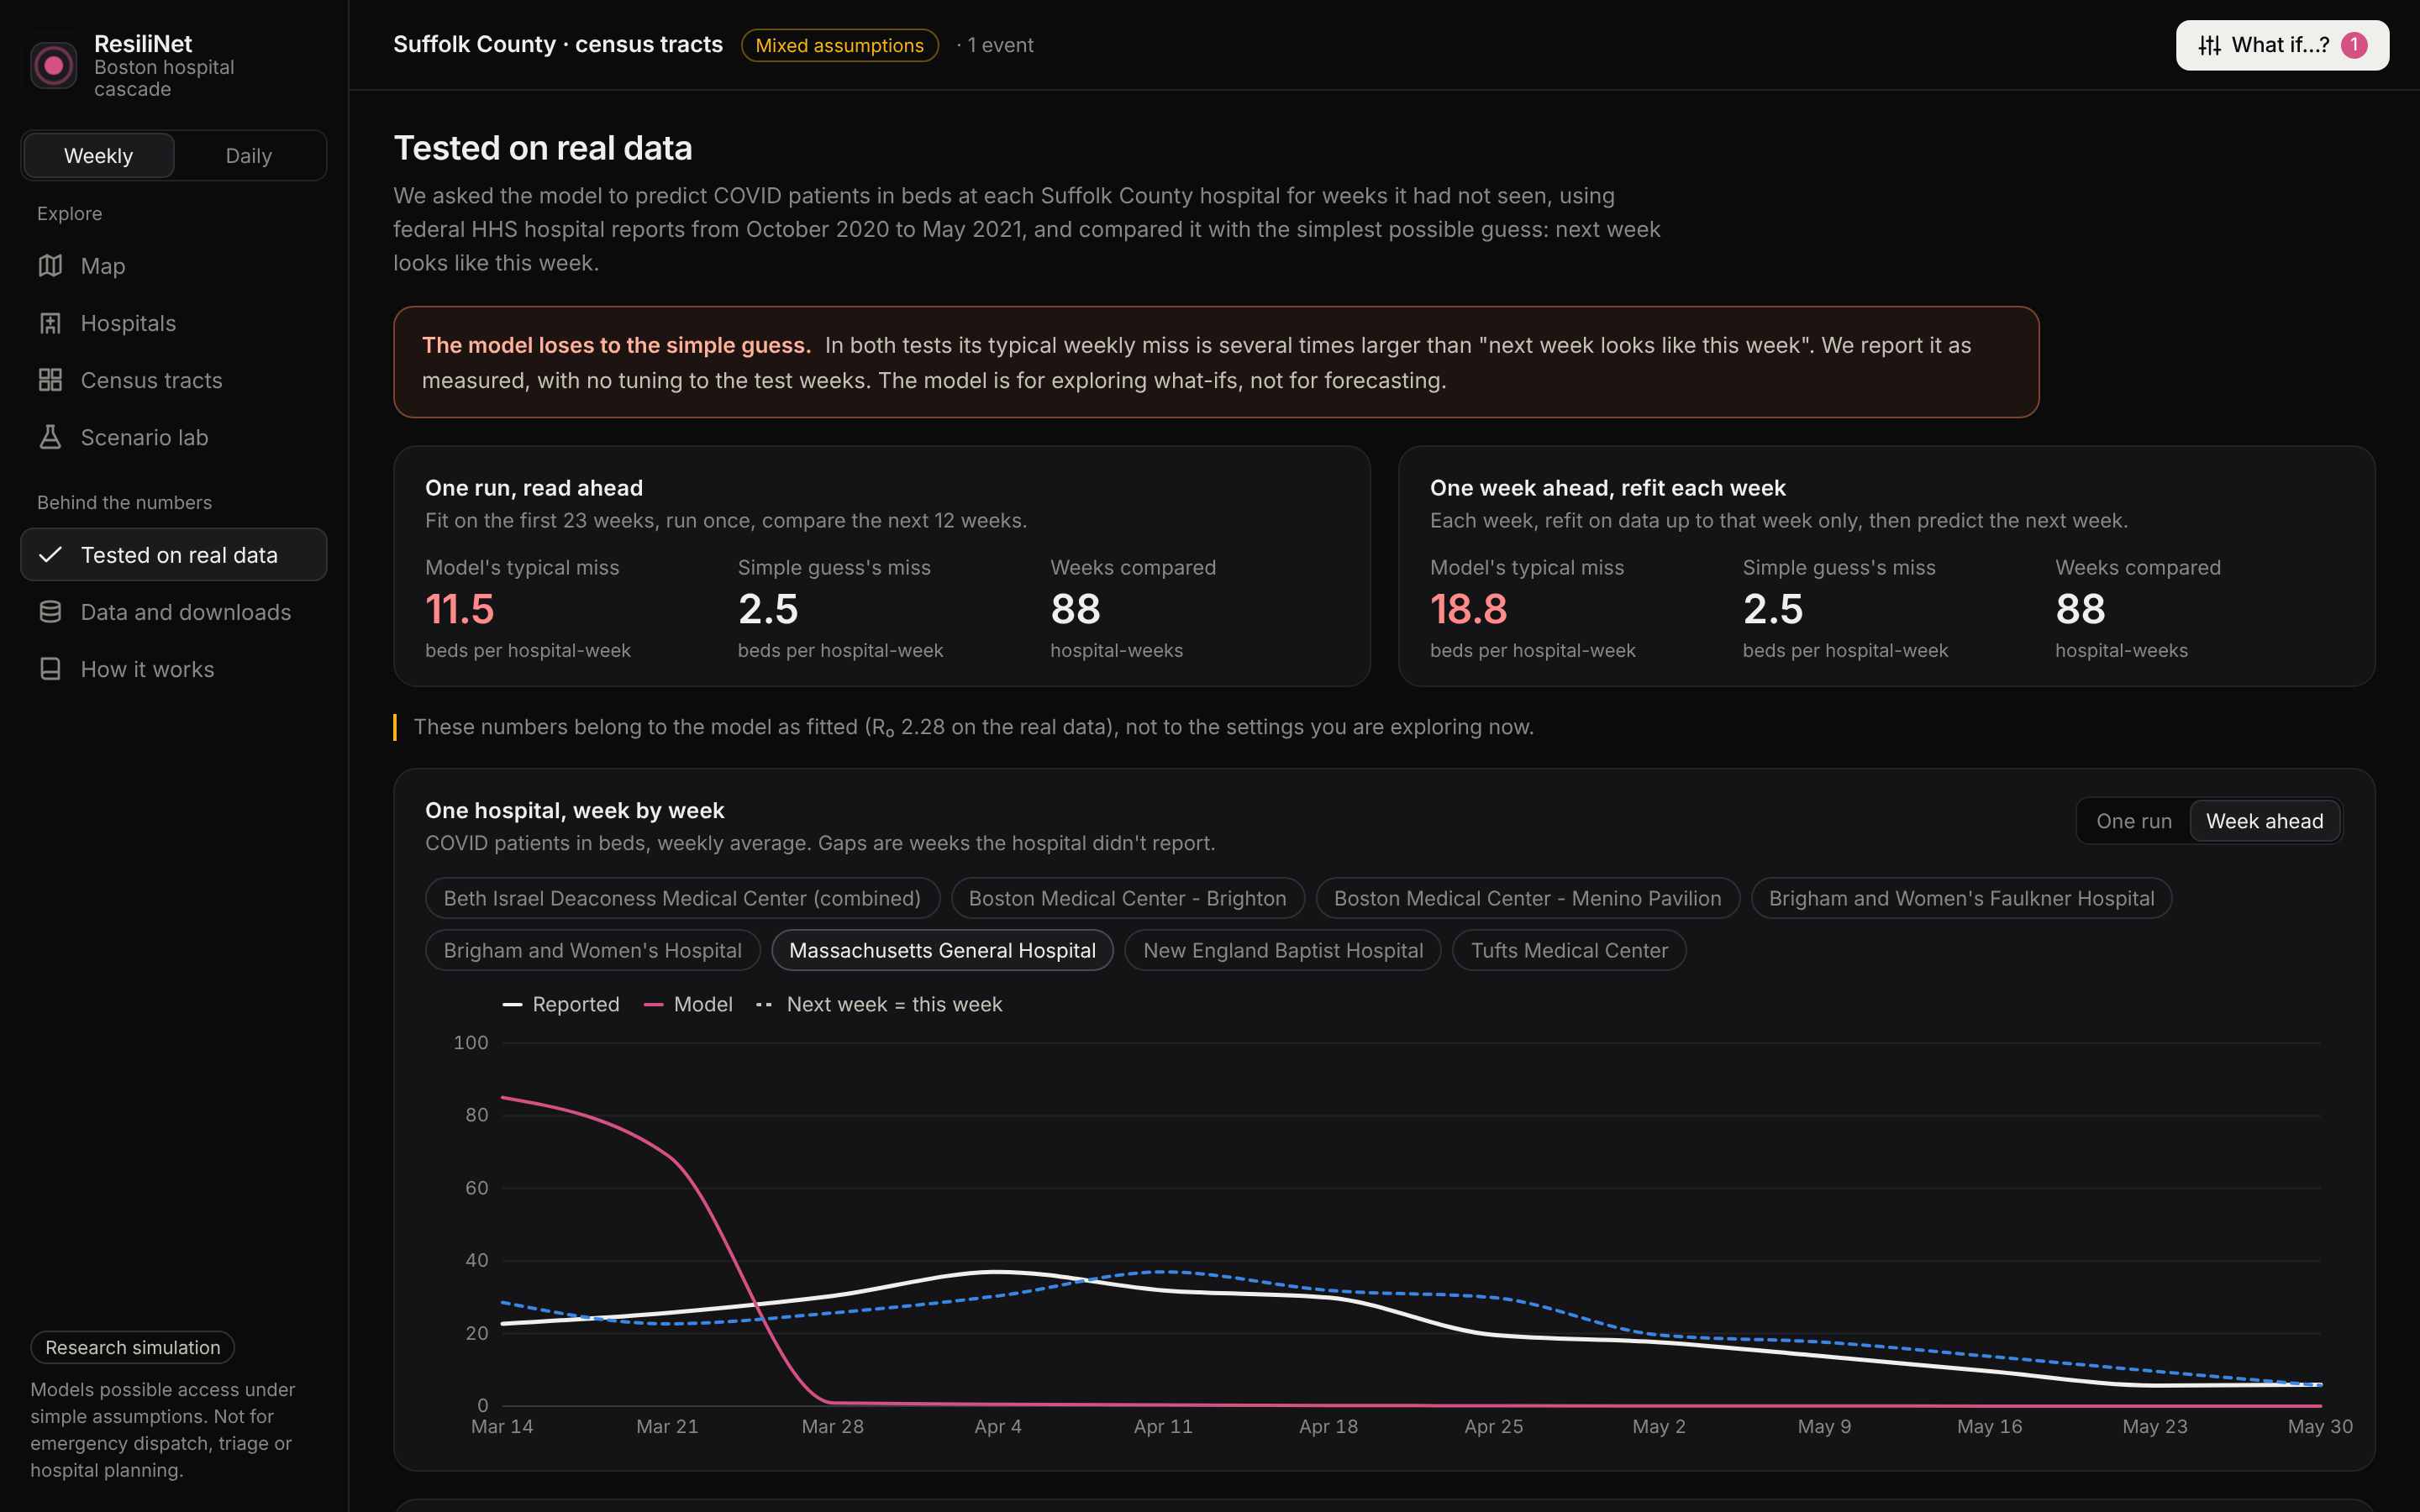
- The honest backtest didn't flatter us. On real Suffolk County data, our weekly model's forecast of beds in use (11.5 beds of error per hospital-week) lost to the naive "next week equals this week" baseline (2.5). One shared epidemic curve is too simple to track individual hospitals week to week. We report it as measured and didn't tune on the held-out weeks.
- Real data is messy. Licensed beds aren't staffed beds, Suffolk County isn't a closed system, and straight-line distance ignores the Orange Line. We label every view as synthetic, real, or mixed so nobody mistakes a demo for a forecast.
- Several plans disagreed. We had three planning documents with conflicting equations, and reconciling them into one source of truth took real time before any code was written.
Accomplishments that we're proud of
- A full chain from epidemic to bed to neighborhood access, running in a few seconds per scenario.
- The What would help panel, which turns the model from "here's the damage" into "here's what to try first."
- Being upfront about where the model fails, with the numbers to back it up.
What we learned
- Hospitals behave like a network, not a list. One closure changed access for a third of the city's tracts.
- Slowing transmission was worth far more than adding beds. In our BMC closure test it helped about five times as many people.
- Small numerical choices matter. Using $1 - e^{-\text{rate}\,\Delta t}$ for every stage quietly inflated the hospital peak by up to 10%, so the daily model uses exact per-step probabilities instead.
- Writing down contracts and conservation checks before coding (people in = people out, patients accepted + unmet = need) caught bugs that would have been invisible in a chart.
- We had a lot of learning to do with the slew of new tools we used such as Sveltekit, many new python libraries like networkX and SciPy, and Kir
What's next for ResiliNet
- Real travel times and transit instead of straight-line distance.
- Staffed beds and ICU capacity instead of licensed beds.
- Feeding the metapopulation model's neighborhood-level spread into the weekly hospital pipeline, so tracts no longer share one epidemic curve.
- Patient flows across county lines.
Team
| Member | What they built |
|---|---|
| David | The daily age-structured metapopulation SEIR-H model, its calibration to Massachusetts HHS admissions, and the What would help panel |
| Ben | The weekly SEIR pipeline and bed-need signal, hospital allocation with overflow rerouting, and the scenario events (closures and bed cuts) |
| Ansar | Distance-based catchment shares, the FDNA hospital and neighborhood access scores, and the test suite and CI |
| Vlarkus | Planning in Kiro (spec, steering files, contracts), collecting and cleaning the MassGIS, Census and HHS data, and the historical backtest |
| Andy | The FastAPI backend, the SvelteKit site and tract map, and the Streamlit app |
All five of us worked on the README, screenshots and demo video.
ResiliNet is a research simulation, not a medical decision-making tool.

Log in or sign up for Devpost to join the conversation.