-

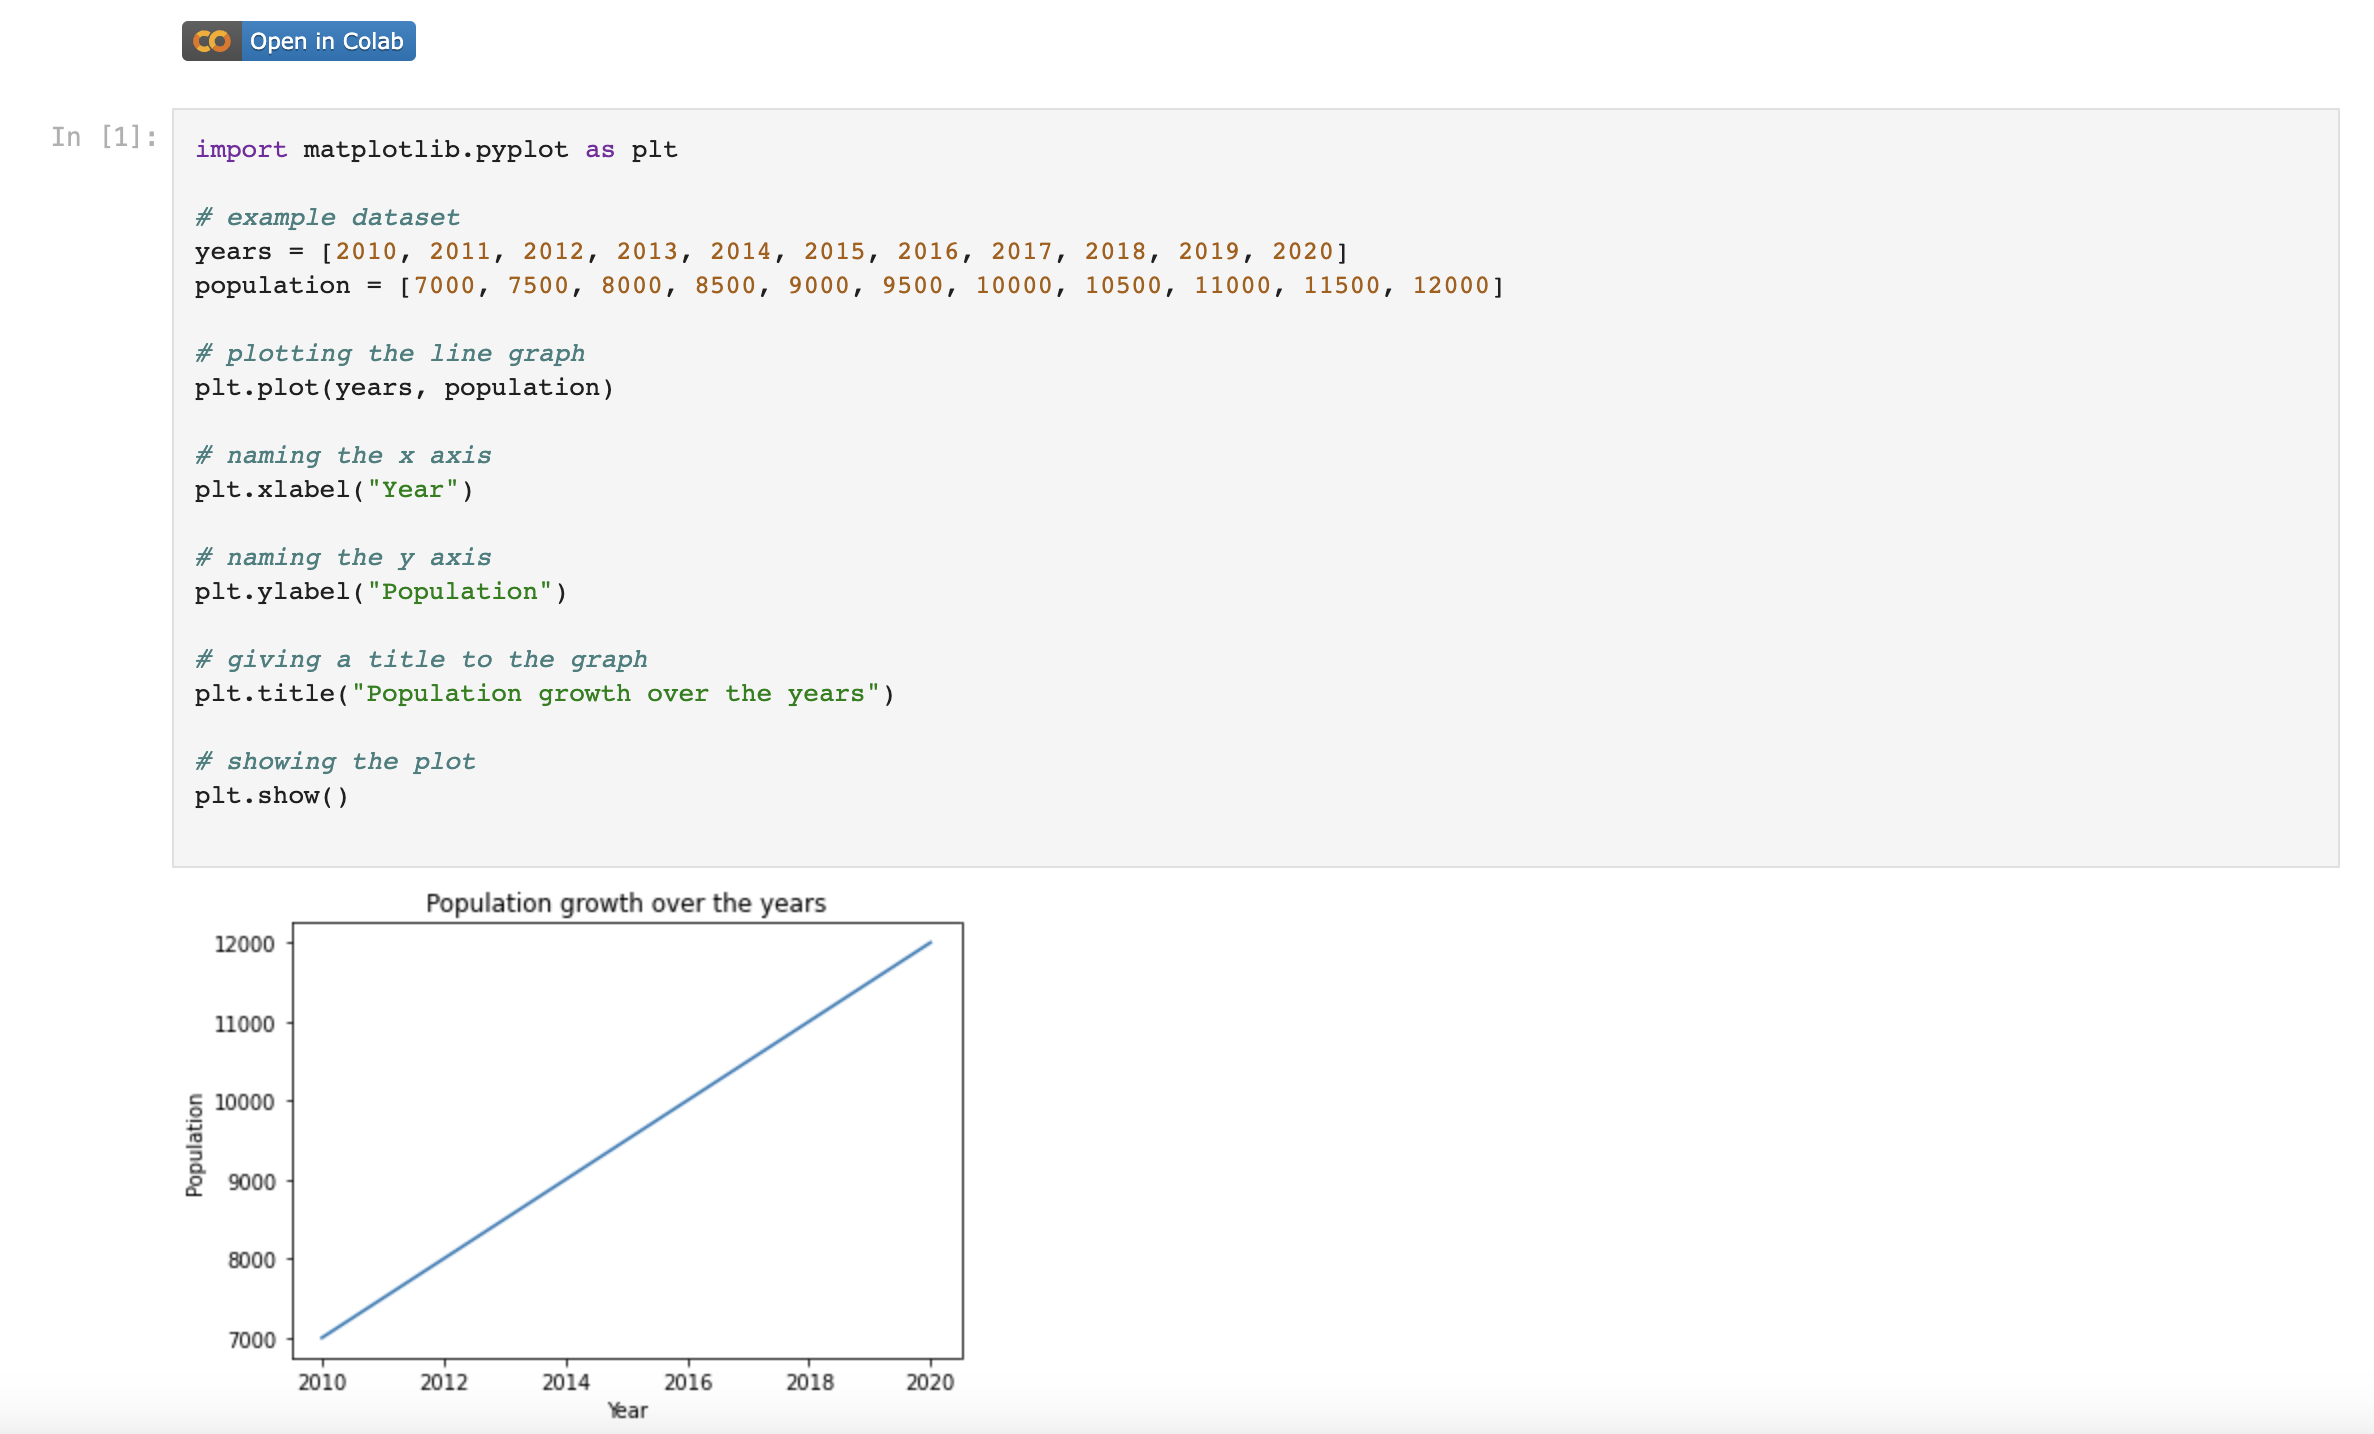
Showing line graph
-

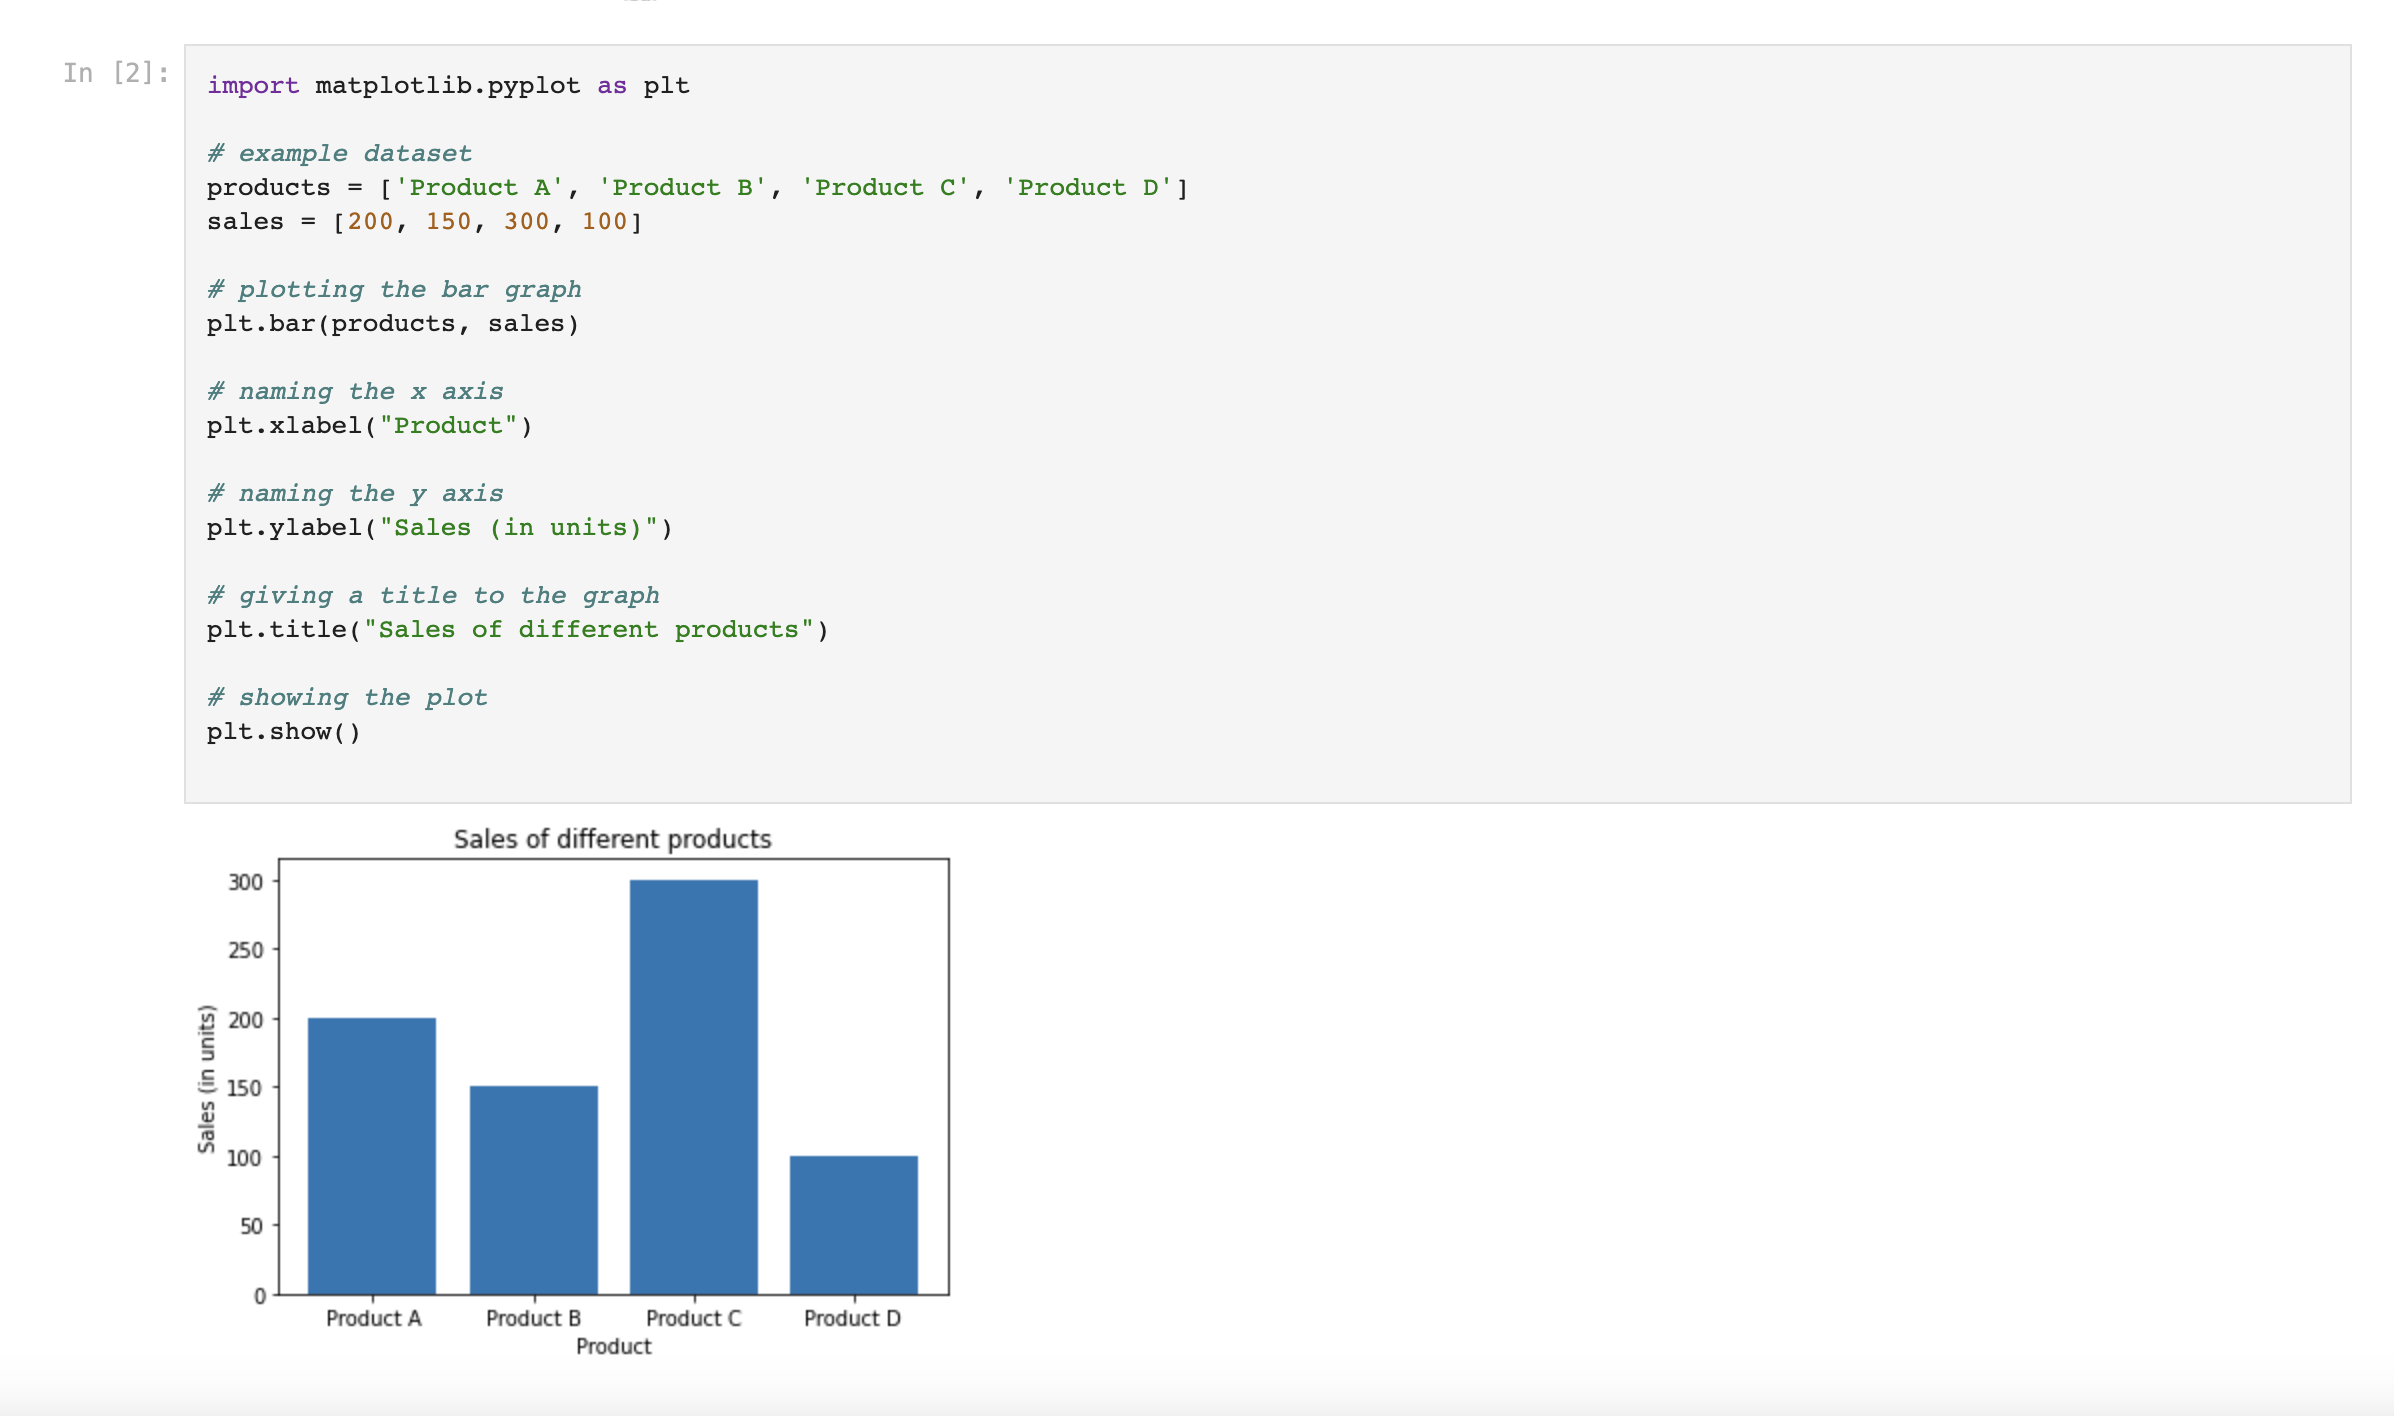
Showing bar chart
Inspiration
AI/Ml GLOBAL HACK WEEK inspired me to do this project.
What it does
It represents dataset pictorially as line graph and bar chart.
How we built it
It is built by using matplotlib library.
Challenges we ran into
Major challenge was to use best suited library.
Accomplishments that we're proud of
By use of matplotlib datasets are represented pictorially.
What we learned
Use of matplotlib library.
What's next for Representing dataset pictorially
Other libraries can be used to represent datasets with more details pictorially.
Built With
- jupyter
- python

Log in or sign up for Devpost to join the conversation.