Devpost
Participate in our public hackathons
Devpost for Teams
Access your company's private hackathons
Grow your developer ecosystem and promote your platform
Drive innovation, collaboration, and retention within your organization
By use case
Blog
Insights into hackathon planning and participation
Customer stories
Inspiration from peers and other industry leaders
Planning guides
Best practices for planning online and in-person hackathons
Webinars & events
Upcoming events and on-demand recordings
Help desk
Common questions and support documentation
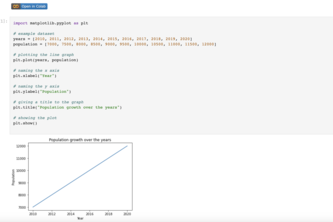
In this project matplotlib library is used to show dataset pictorially as line graph and bar chart.
This project shows use of switch statement for making calculator in java.It will ask for required operation from user then it will show the result.