-
-

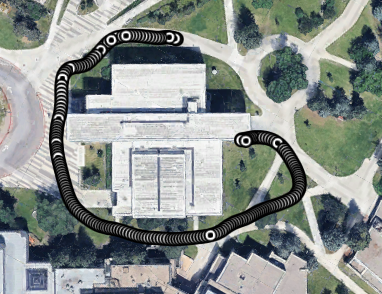
Denoised geospatial data points plotted on Google Earth.
-
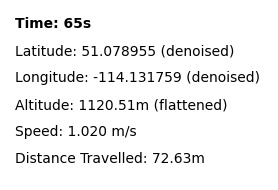
Time-based data with customized denoise and flattening values.
-
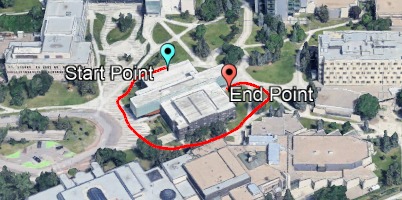
Endpoints and drawn path on Google Earth.
-

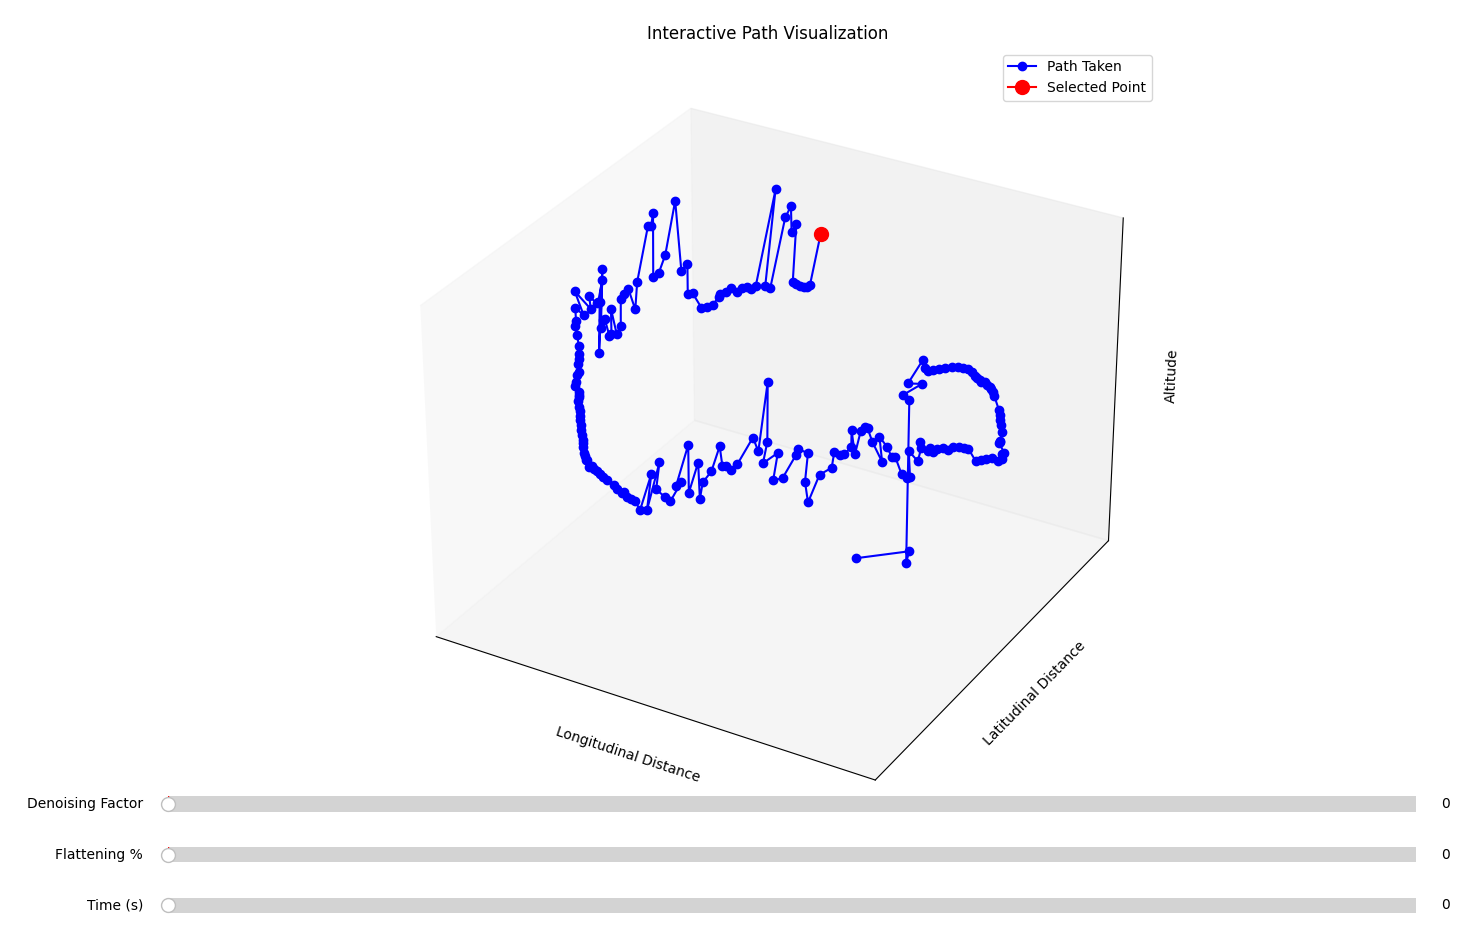
3D plotted path in Matplotlib.


Inspiration
Have you ever walked around carrying a bunch of GNSS equipment logging data, then forgotten where you were 20 seconds ago? So have we! All jokes aside, Replay aims to streamline processing geospatial data and easily convert it into human-readable and interpretable data in various forms. We were inspired by many movie style interfaces, that allow characters to easily view data in such an easy way, we thought we could implement this into our project! This led us to using not one, but TWO 3-dimensional representations for our geospatial data.
What it does
Replay allows its users to easily interpret and process geospatial data collected by the PwrPak7. Our approach ensures that the user is able to easily read and interpret all data, by giving the user as much interactive data as possible. The days of plaintext data reporting are long gone, and so are simple and basic graphs. Viewing data in an interactive and dynamic way is extremely important, and we believe that it is the future.
How we built it
First, we all independently experimented with the data, and our own unique ways to display the data. Once we eventually found some ideas that we liked, we started to bring everything together, combining all of our code and ensuring that we had an easy-to-use interface.
We explored many different possibilities, but ended up deciding on our Google Earth and 3D plot method.
Challenges we ran into
We definitely had our fair share of challenges, mainly with our Google Earth idea. Our current method is to export data into KML files and open them through the Google Earth Pro application, but this is quite limited, as it requires the application to be installed and available on the device. We attempted to experiment with the Google Earth Engine API, but to no avail. The API is extremely limited, but if it worked, it would've allowed users to open the data in their web browser and share data to anyone in the world.
We also had many issues perfecting our denoising/smoothening function, and ensuring that our data was as accurate as possible. Another issue was ensuring that our plots and any related data were accurate, as fixing one issue seemed to lead to many others.
Another challenge we ran into, not entirely relevant to the project, was editing the video demo, since we ran into a few errors, including export errors.
Accomplishments that we're proud of
We are extremely proud of our innovative Google Earth view feature, as well as our interactive 3D graph. We all agree that our approach seems to be pretty unique, and it took a lot of effort to get it working.
What we learned
We all learned a lot about Geomatics, and one of our members is also planning to go into it now. Overall, this was an amazing learning experience, working with geospatial data as well as new technologies that allow us to receive that data.
What's next for Replay
The future of Replay is bright! Ideally, we would like to work on adding more and more features to Replay, more than what we were able to do in the span of one day. Adding more unique menu options, developing deeper analysis methods, and perfecting the curve smoothening.
Built With
- google-earth
- matplotlib
- numpy
- pandas
- pyplot
- python
- simplekml
- tkinter


Log in or sign up for Devpost to join the conversation.