-
-
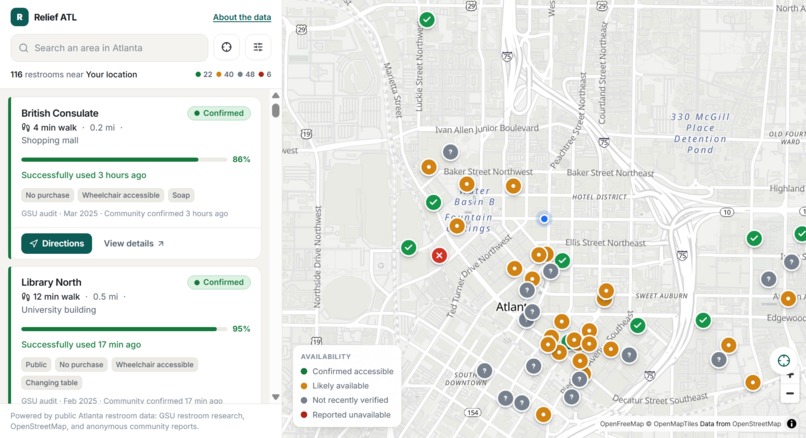
Demo screenshot
-
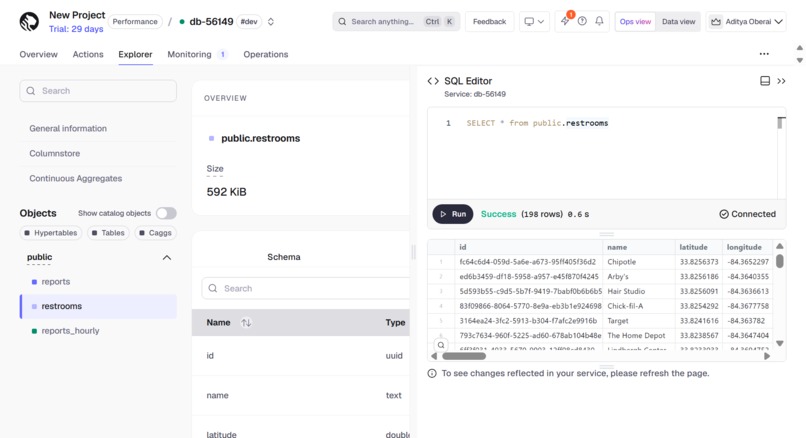
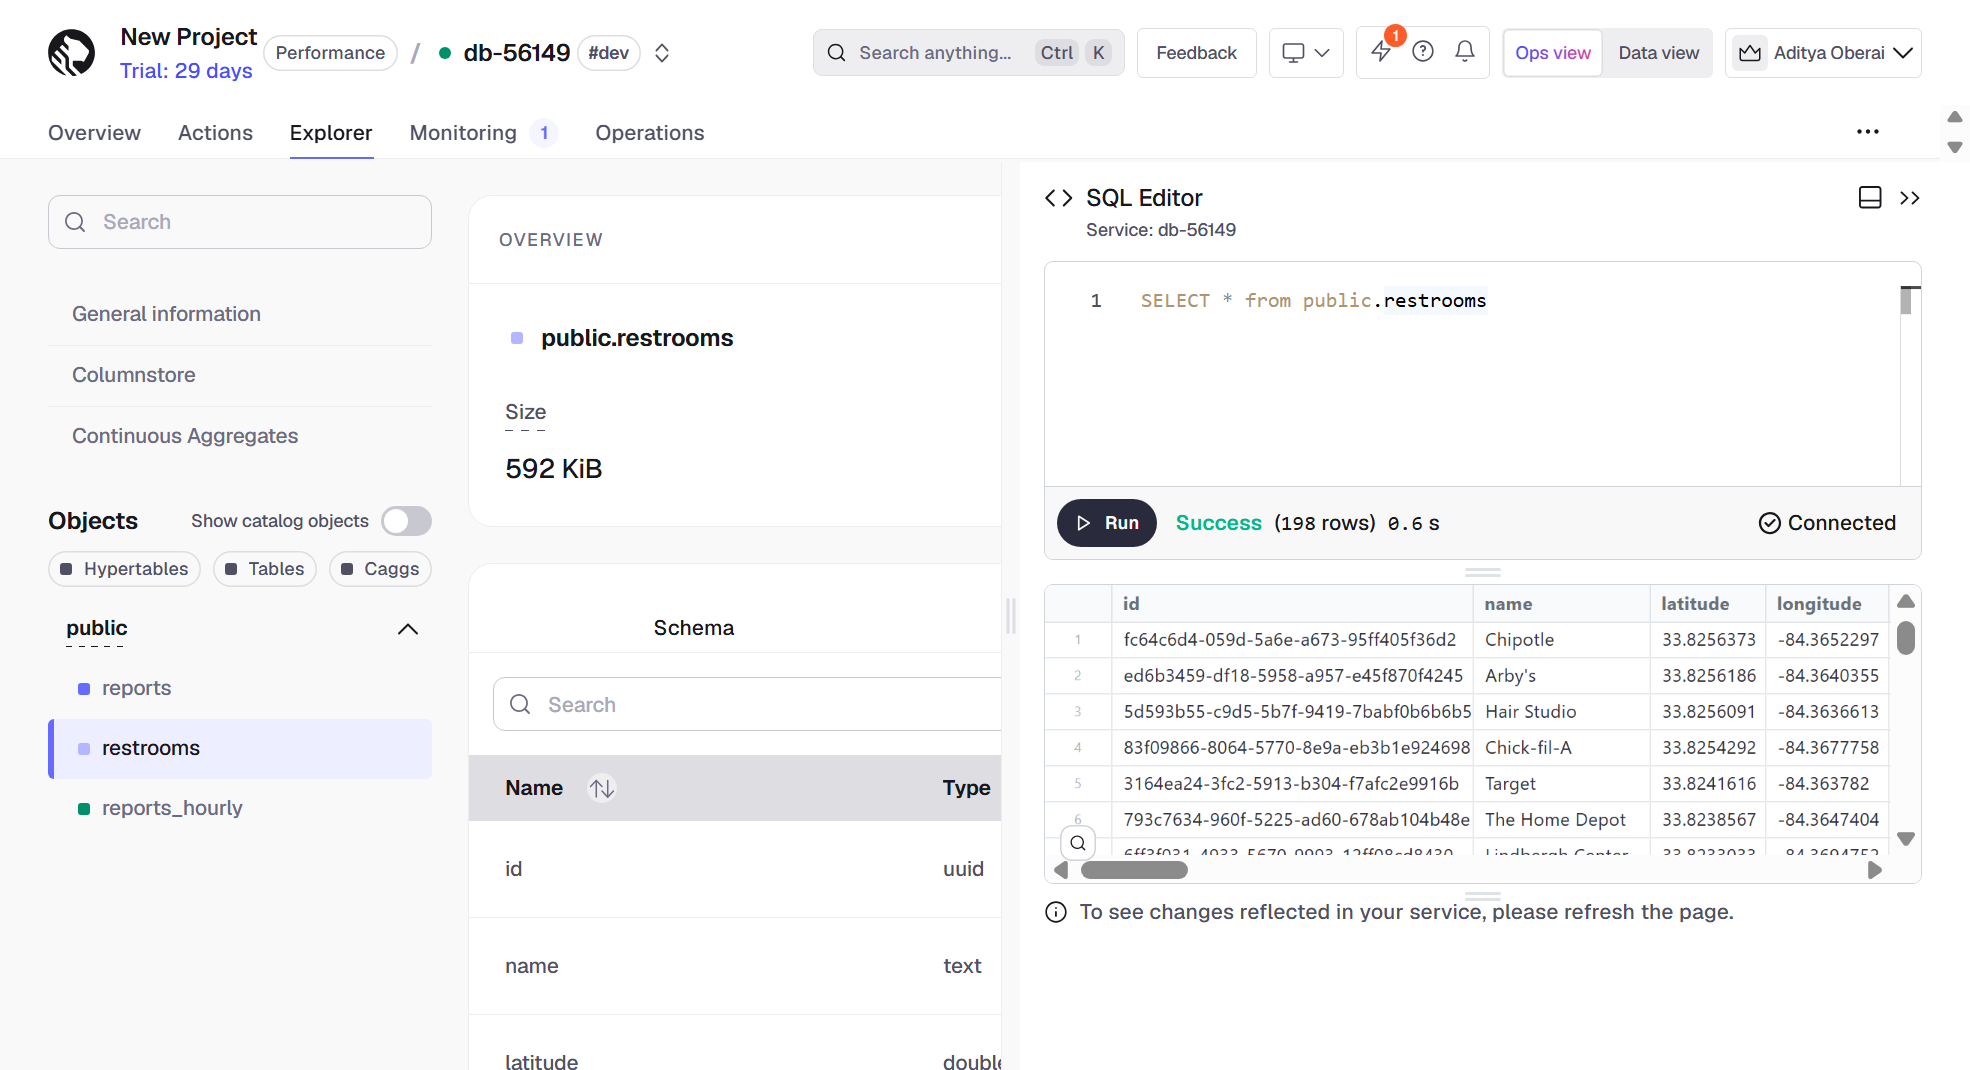
Tiger Data dashboard
-
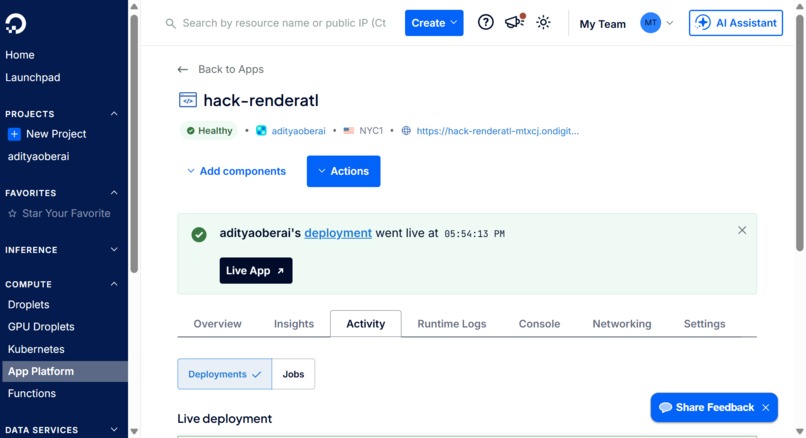
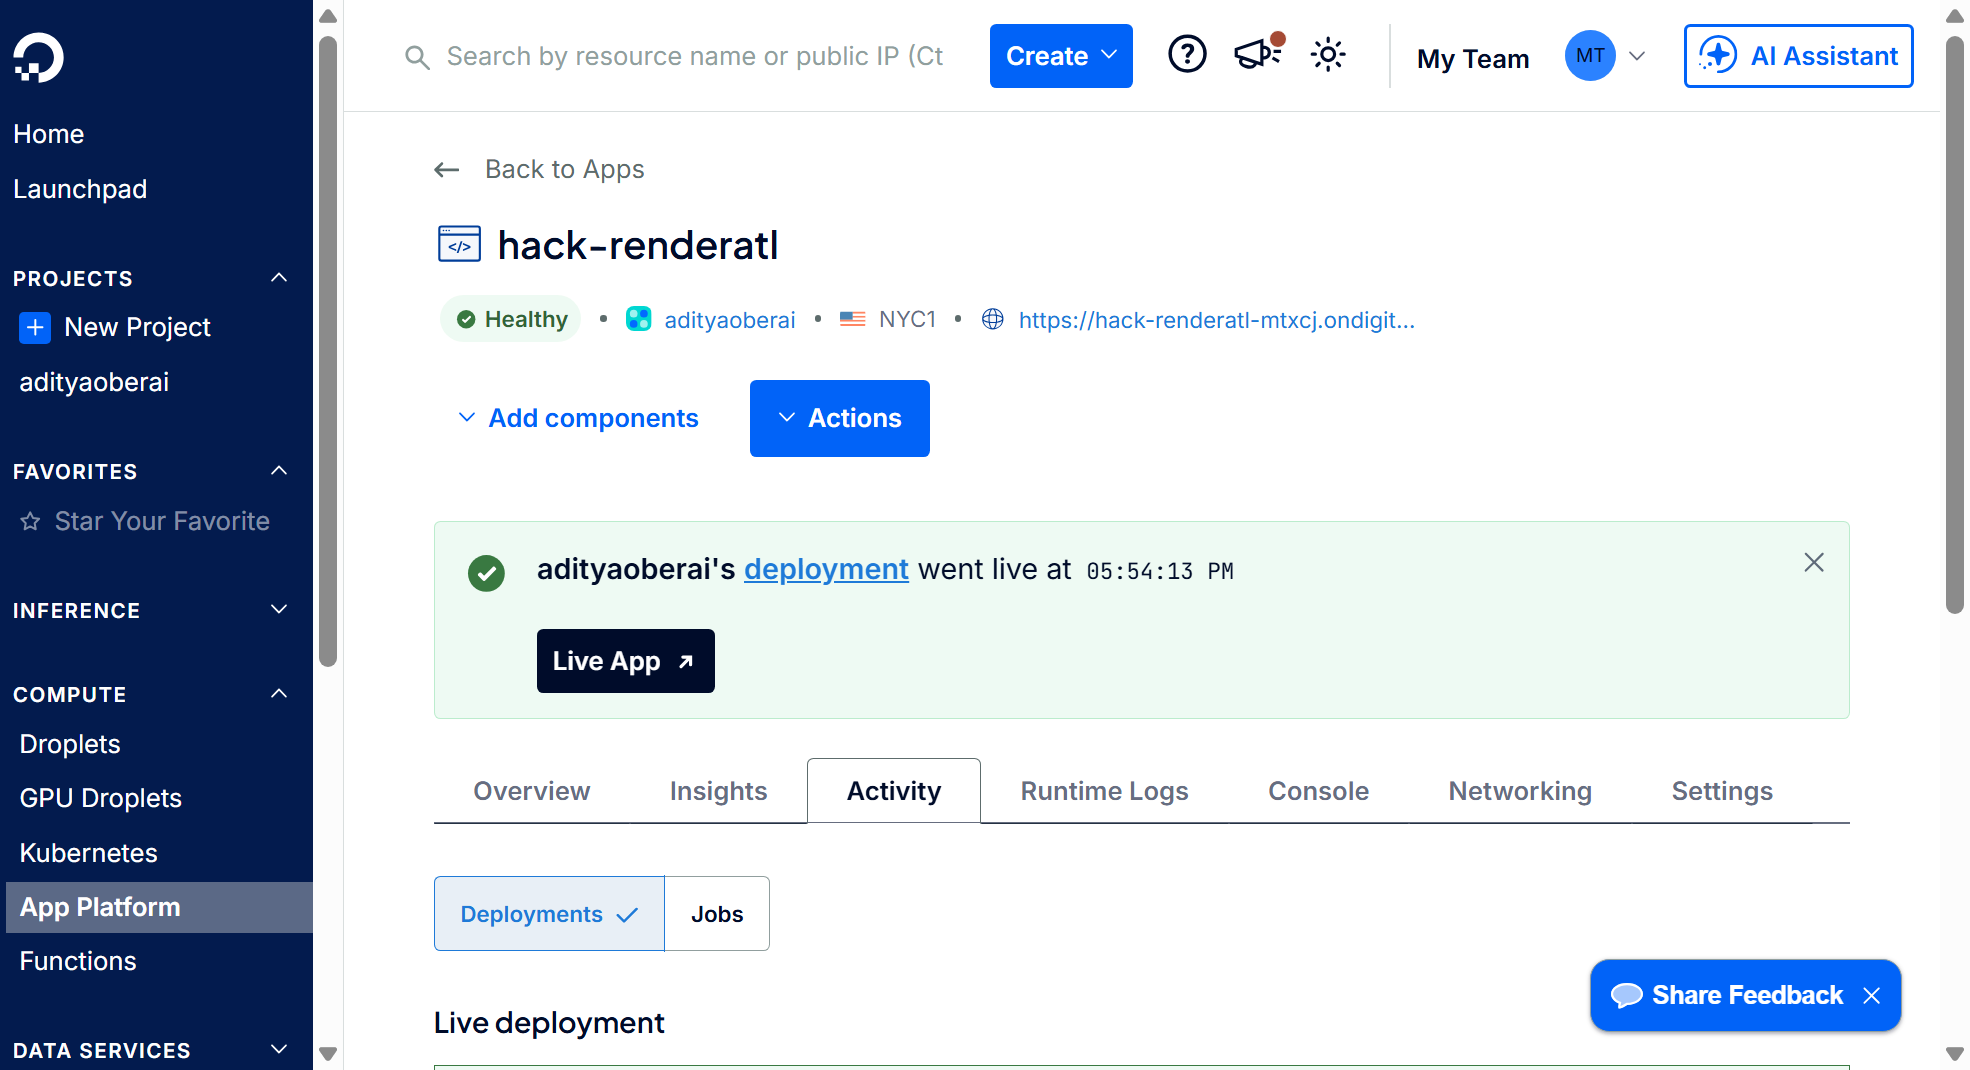
DigitalOcean dashboard
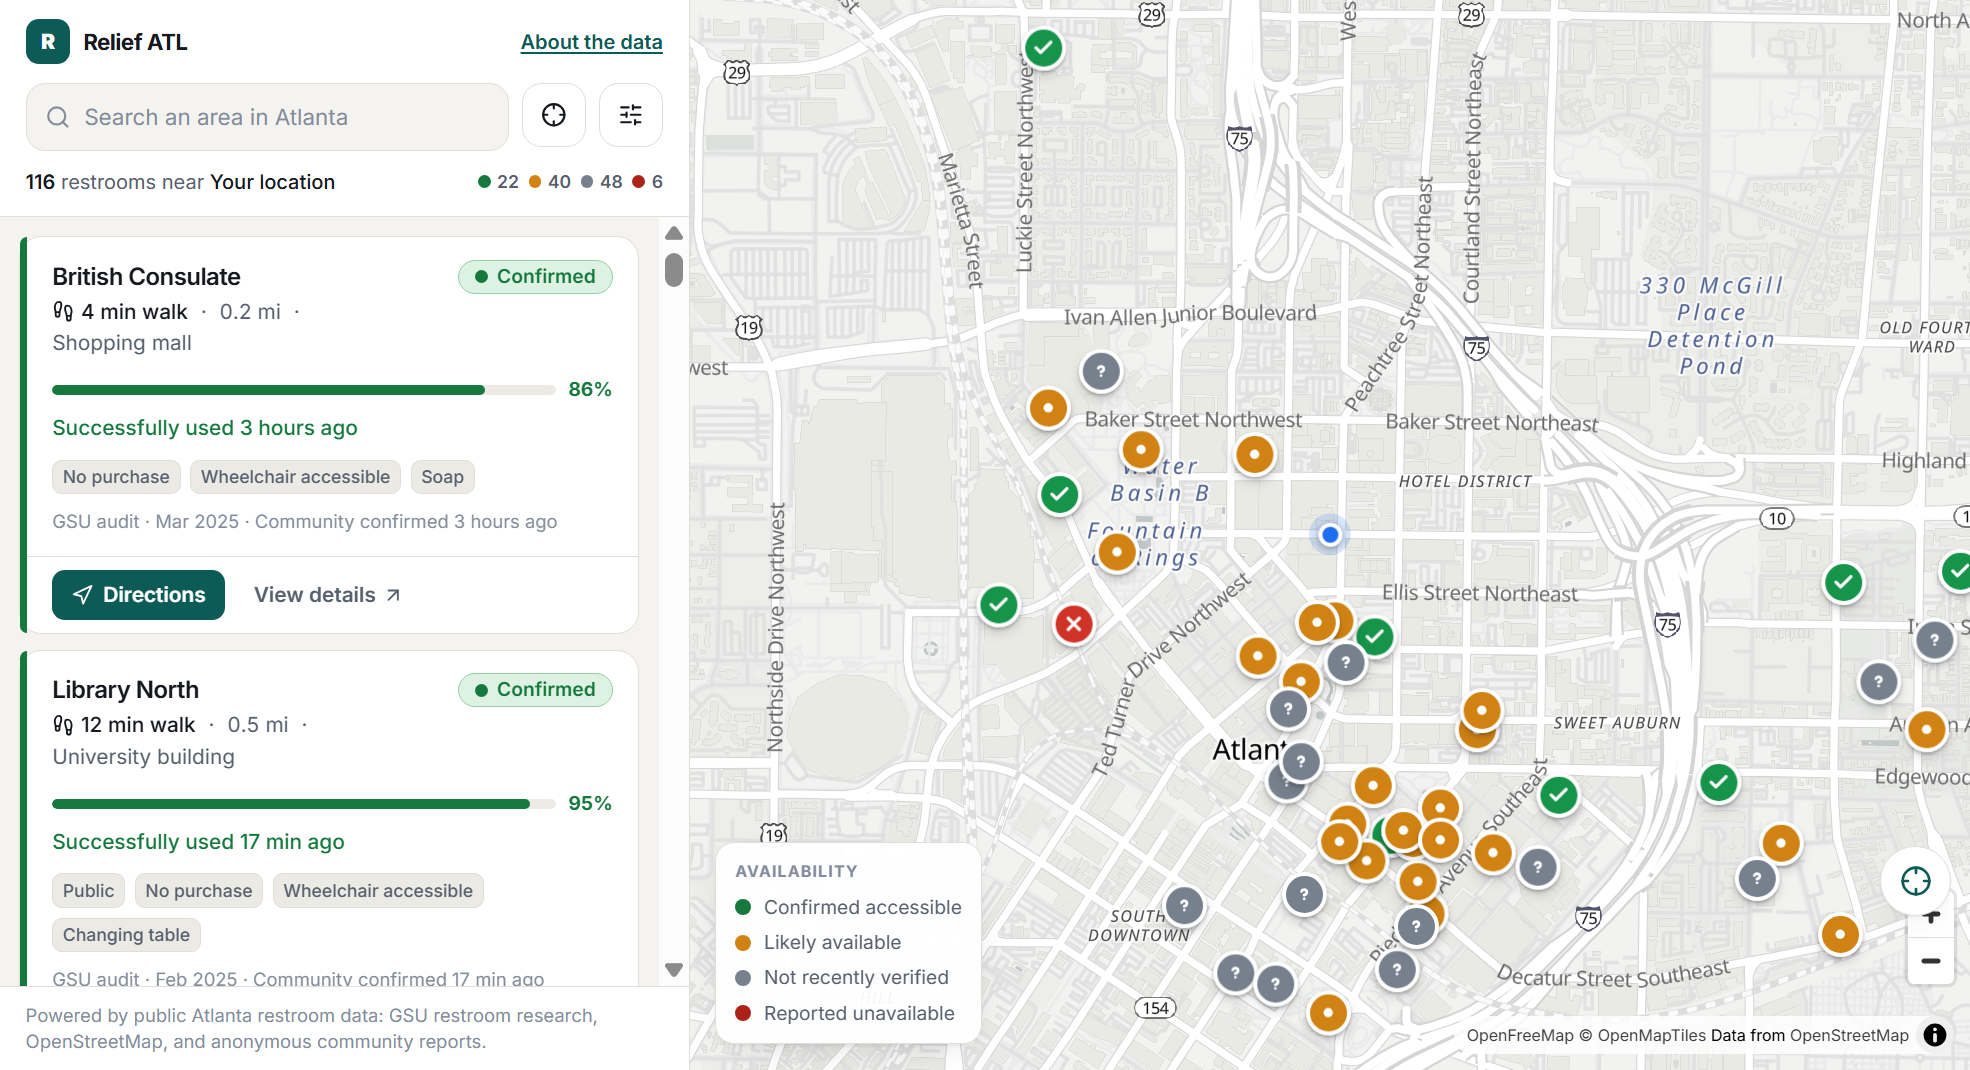
Relief ATL
Find a restroom in Atlanta you can actually use.
Inspiration
This was my first visit to Atlanta and my first time at RenderATL. I usually get around cities on foot, and Atlanta was no different. A few hours into walking around an unfamiliar city, I needed a restroom. I searched a map, walked to the pin, and found the door locked. Between locked washrooms, customer-only spots, or just incorrect map links, this is not a new travel problem for me, but being somewhere new made it worse; I had no idea which buildings I was actually allowed to walk into, so I could end up buying a coffee I did not want just to earn the right to use a bathroom.
At first, I assumed this was mostly a visitor problem, and that anyone who actually knew Atlanta would know where to go. So while I was at RenderATL, I started asking Atlanta locals about it. Across several conversations, it became apparent that the same frustration kept coming back from people who had lived here for years. That was when it stopped feeling like a personal inconvenience and started looking like a real gap.
It also matters far more to some people than others. For most of us a locked door is an annoying ten minutes. For a parent with a toddler, someone managing Crohn's or IBS, a delivery driver, a wheelchair user, or someone without stable housing, it decides whether you can spend a day in public at all.
What I did not expect was to find the problem already measured. In the Georgia State University study Public bathrooms as public goods: Assessing availability and accessibility in Atlanta, Georgia, researchers physically walked Atlanta between February and April 2025 and visited 262 potential public restroom locations across 15 areas. Only 117 of them actually had a restroom you could use. The rest were locked, marked customers only, had no public restroom at all, or were occupied for over ten minutes. That is a 55% failure rate on locations that look completely fine on a map.
The researchers also published the original audit dataset on OSF. It is excellent, but completely static: a photograph of Atlanta's restrooms in spring 2025. I wanted to turn it into something you could use on a Tuesday afternoon.
What it does
Relief ATL answers one question: where is the nearest restroom I can actually use right now?
Share your location and you get nearby restrooms ranked by an Access Confidence Score from 0 to 100, not by distance. A five minute walk at 96% ranks above a two minute walk at 31%, because a restroom you cannot get into is not nearby in any useful sense. Every result shows where its information came from and how old it is ("GSU audit, Feb 2025", or "Community confirmed 18 min ago"), along with the access restrictions the auditors recorded, the facilities they found, and a full breakdown of how the score was calculated.
Then, if you go, one tap tells the next person what you found. I used it or Couldn't access, with an optional reason. No account, no sign in, no tracking. The app stores the restroom, the status, and the timestamp, and nothing about you.
The whole product rests on keeping three things separate that maps normally conflate: a dataset saying a restroom exists, somebody having verified it was usable, and somebody confirming it is available right now.
How I built it
- SvelteKit + TypeScript: the app and all server routes. I intentionally skipped auth for the MVP.
- MapLibre GL JS: the map, using OpenFreeMap tiles.
- Tiger Data (PostgreSQL + TimescaleDB): the data and availability layer.
- DigitalOcean App Platform: web hosting.
- Data sources:
- The original GSU audit dataset on OSF, interpreted alongside the original PLOS Water study: 207 individual restroom audits across 117 locations, normalised into one record per physical location with every original field preserved in JSONB.
- Overpass API for
amenity=toiletsacross metro Atlanta, another 81 locations. Where the two overlap the physical audit wins. - Nominatim for reverse geocoding, because the research dataset has coordinates but no facility names.
The Access Confidence Score is fully deterministic, no machine learning involved. A static baseline from the public data is capped at 68, so a dataset alone can never earn a green pin, and an evidence layer from timestamped reports sits on top with a weight that saturates fast. Two people reporting "locked" in the last twenty minutes will turn a location red even though the GSU audit found it perfectly usable in 2025.
AI usage
Due to the tight timeline and busy conference schedule, I used Claude Code to assist me in the development process of the web app. The discovery of the relevant research and data was done by me personally.
Challenges I ran into
The dataset does not explain itself. The spreadsheet columns are opaque codes like Permiss, Access and Pref, with no codebook, and guessing wrong would have quietly corrupted every score in the app. I cross-checked my interpretation against the published paper and found that reading Permiss as "staff permission required" produces 91 of 117 locations needing none, or 77.8%, which reproduces Table 1 of the paper exactly. That was the moment I trusted the rest of the mapping.
Old confirmations were inflating scores. My first scoring pass gave a location 92% off a confirmation that was eleven hours old, because thirty days of accumulated "it was fine" piled up into false certainty. Corroboration should raise confidence but must never substitute for recency, so I added a freshness ceiling keyed to the age of the most recent success: 99 within thirty minutes, down to 52 for historical evidence only.
Accomplishments that I'm proud of
I am proud that there is no fake data in this app, even for the purpose of a demo. Every verification has to be earned by someone who was physically there and I physically visited a location near me to confirm.
I am also glad the score is auditable. Tap "How is 94% calculated?" on any restroom, and you see every factor and its contribution, down to "-13 source data is ageing".
And reverse geocoding turned 117 bare coordinates into 111 real building names (GSU College of Law, Petit Science Center, Lindbergh Center), which is the difference between a usable app and a list of GPS points.
What I learned
- I learnt how to use Tiger Data and discovered what hypertables are and how they support time-series use cases.
What's next for Relief ATL
The biggest goal is the civic layer. The database holds public restroom locations plus timestamped access outcomes, which lets it eventually answer questions no single map can: which Atlanta neighbourhoods have the least reliable restroom access, where accessible restrooms are unavailable within a reasonable walk, and where the city would benefit most from additional public facilities. Restroom access is public health infrastructure, and right now nobody is measuring it continuously.
Built With
- claudecode
- digitalocean
- openstreetmap
- sveltekit
- tigerdata
- typescript


Log in or sign up for Devpost to join the conversation.