-
-
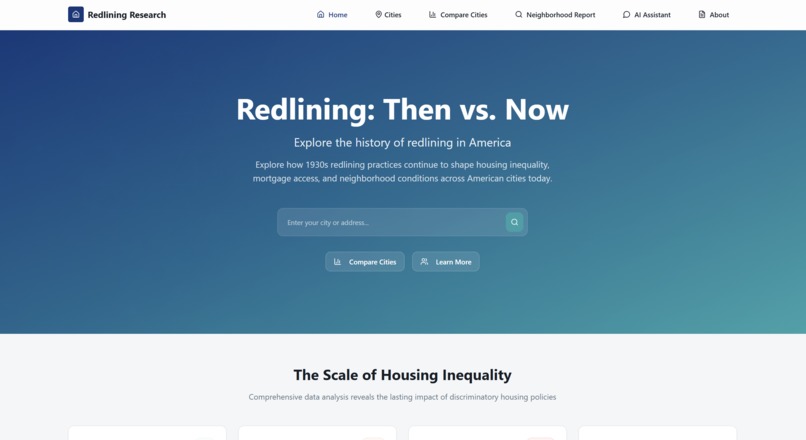
The front page of my website!
-
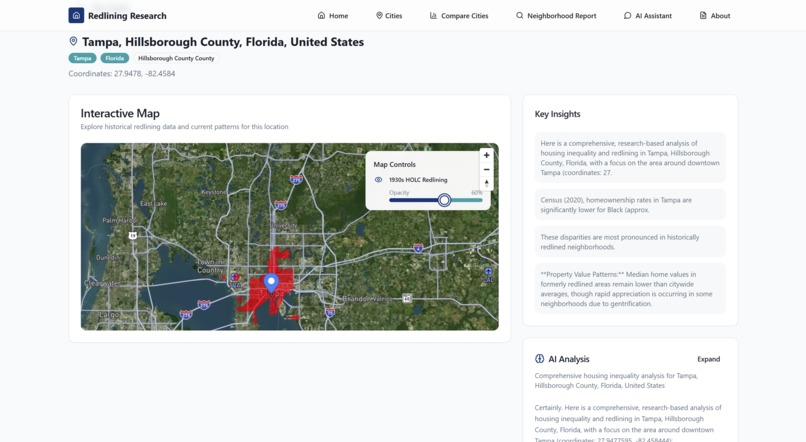
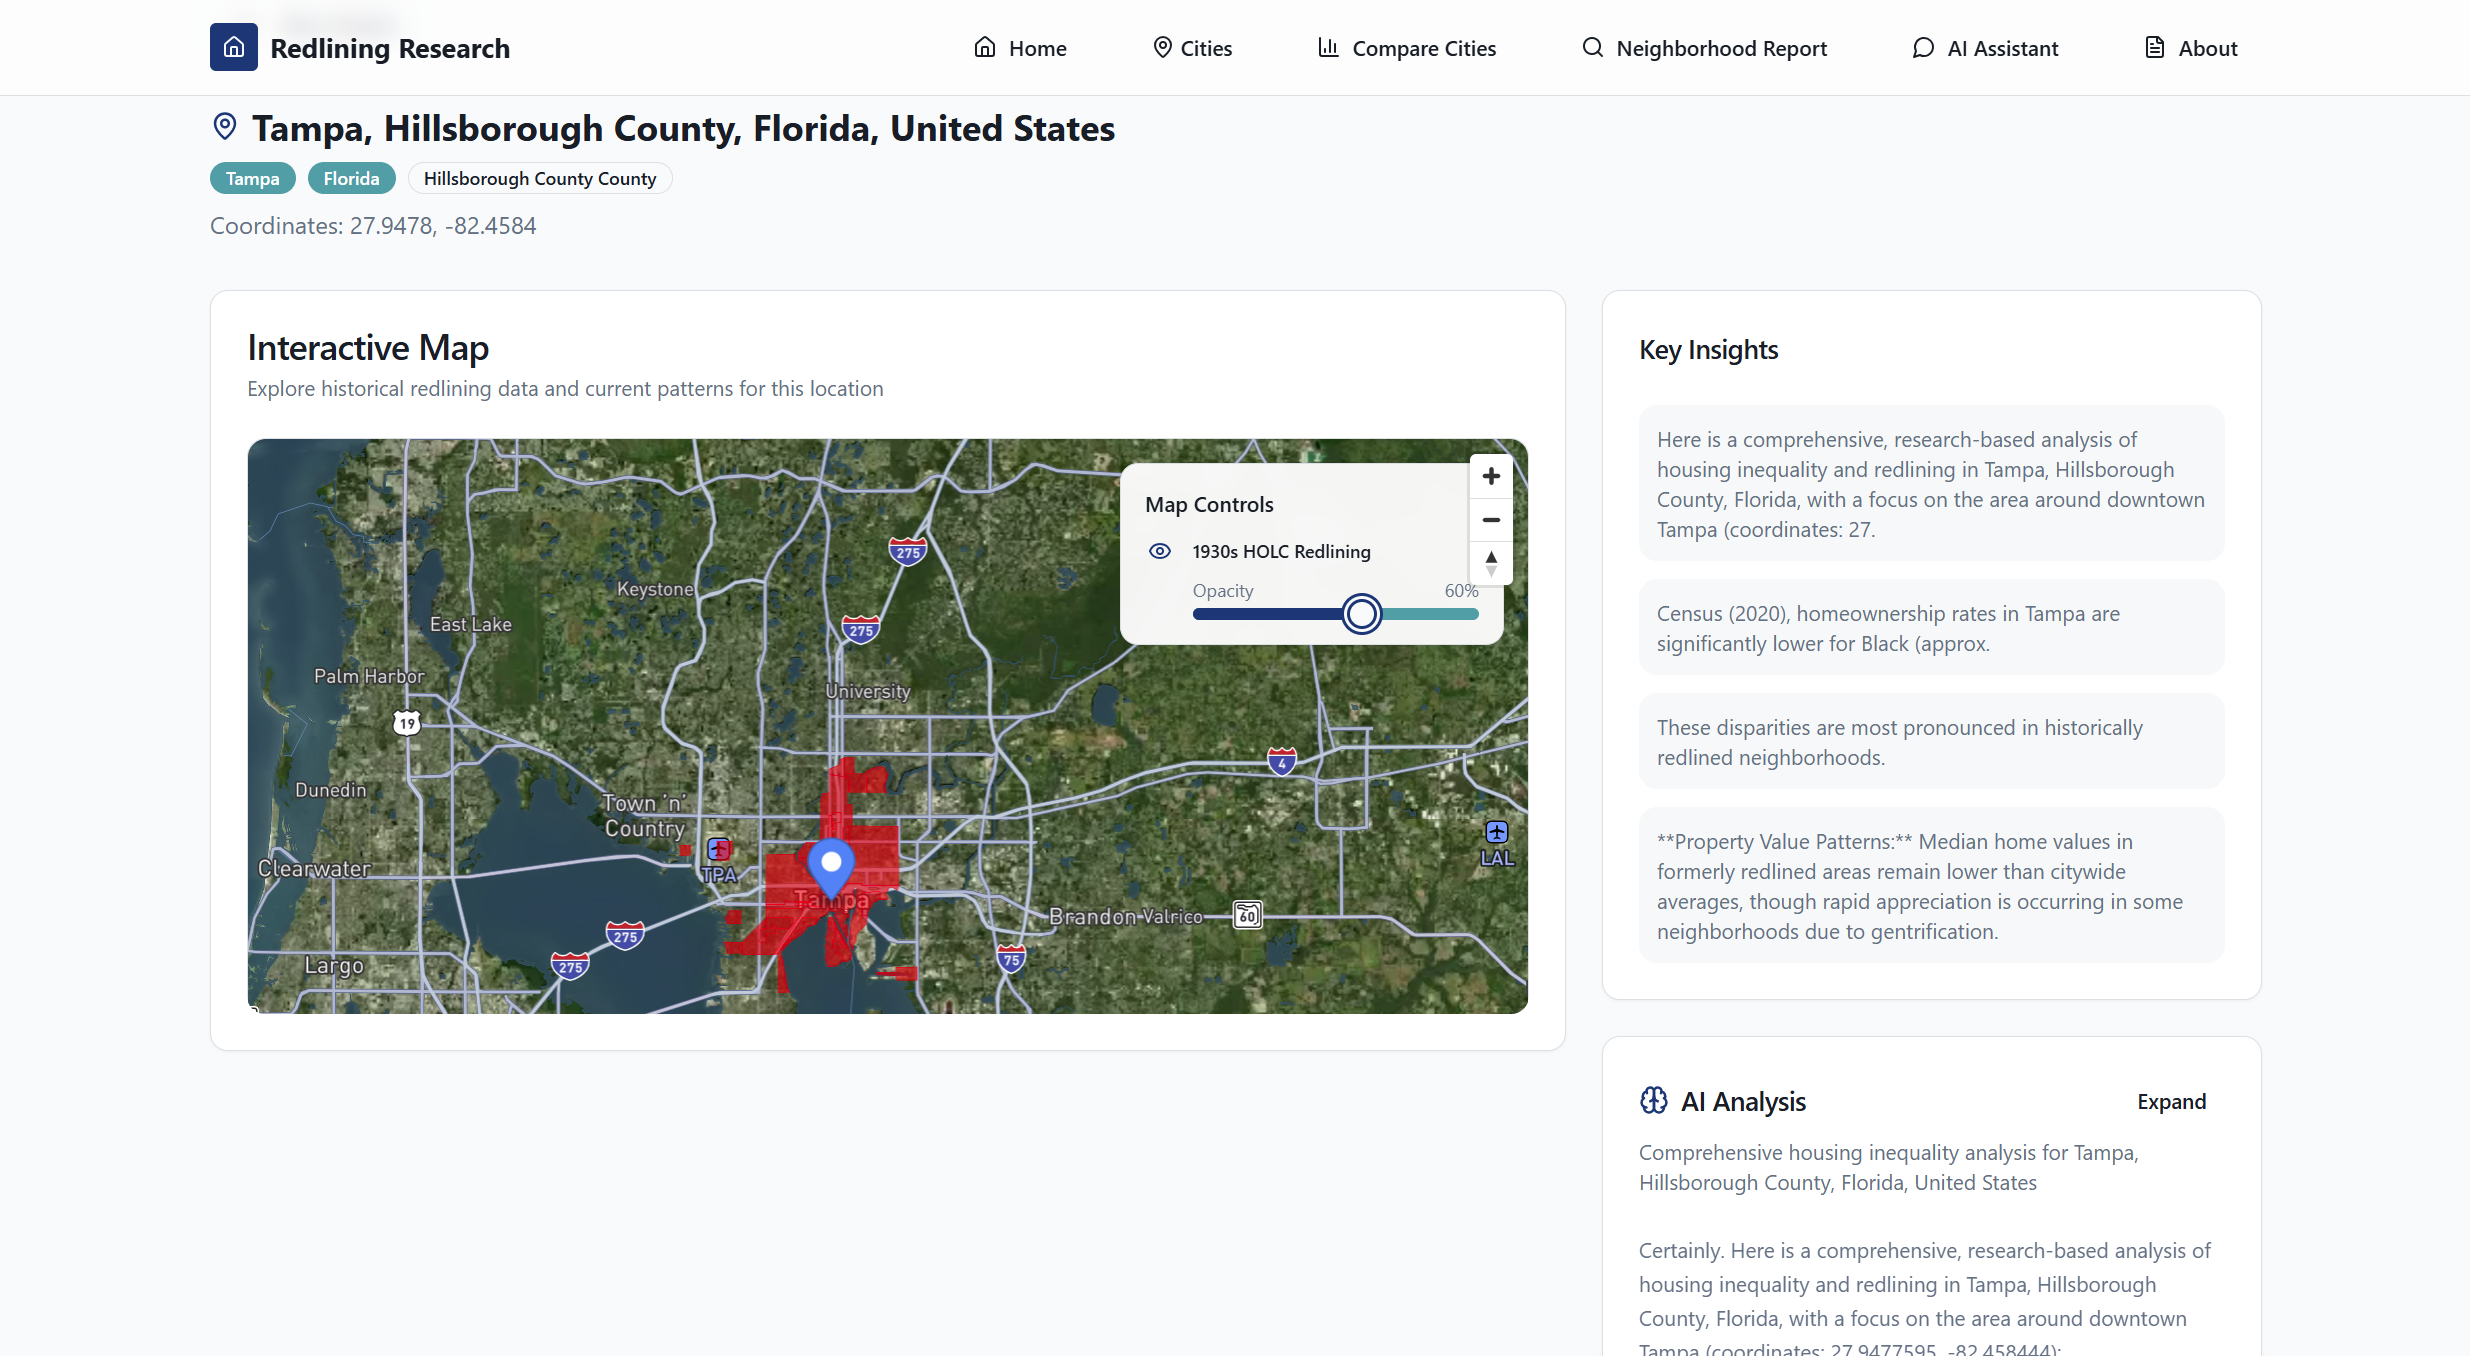
Input your city in the search bar (front page) to get a detailed description of redlining in your area!
-
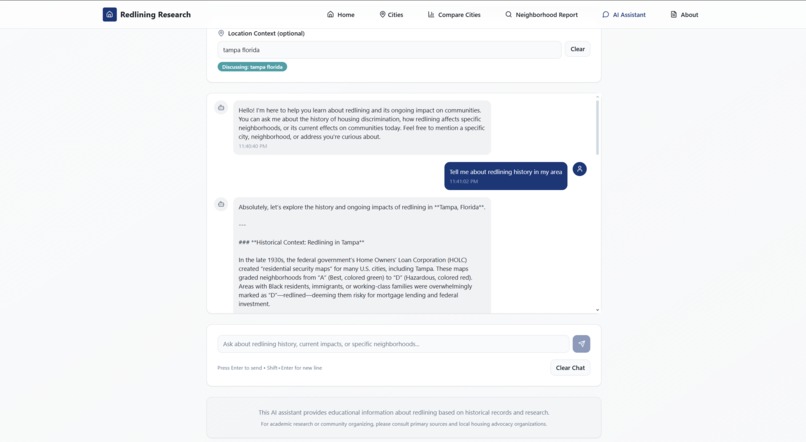
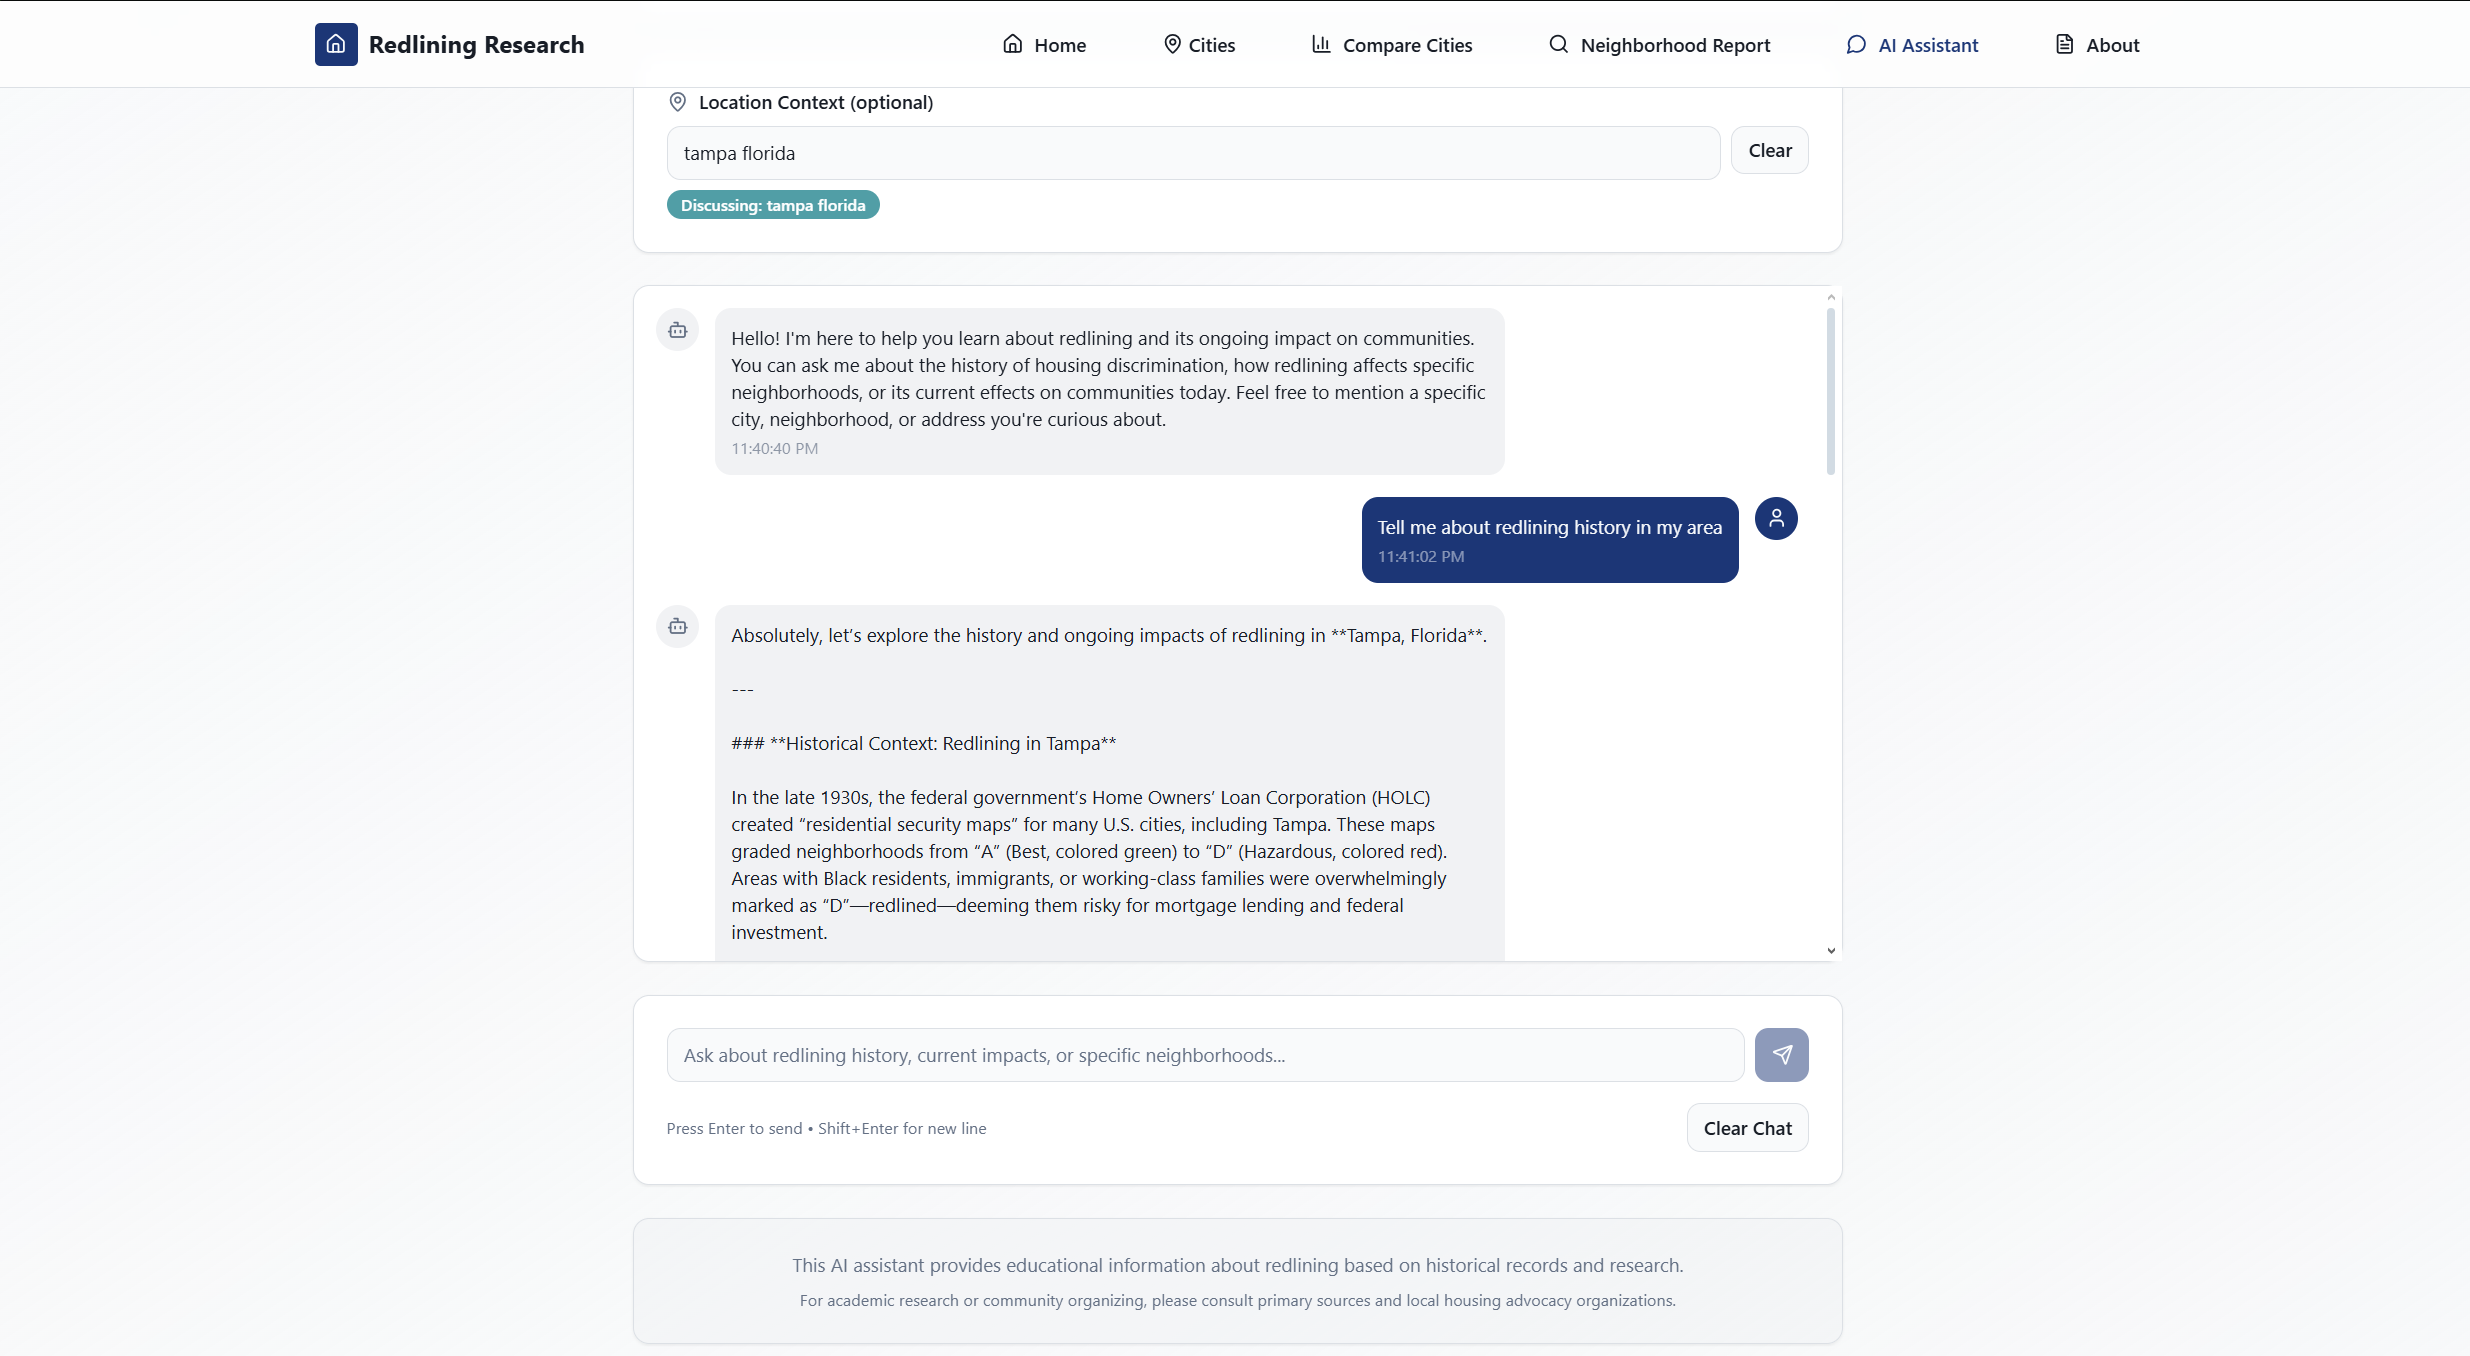
Talk with an AI chat box to learn more about redlining and the consequences of it today.

Inspiration
Ever since I was a kid, I have always been passionate about CS and social inequity within our societies. During my freshman year of high school, I learned from my AP Human Geography teacher about redlining maps and how the consequences of redlining can still be seen in our society today. Ever since his class, I developed a passion for urban studies; therefore, when I saw this hackathon, I knew I could create something that highlights the persisting issues of redlining today.
What it does
This application allows users to study and learn about redlining issues that once persisted (and still persist) in their neighborhoods or cities. By using interactive maps, users are able to go to their city and see past HOLC redlining boundaries. Users are also able to get personalized insights based on their location with the use of AI, explaining how redlining continues to affect their location today. Users are also able to compare cities (in progress) and see the differences of how redlining affected each city.
How we built it
For the Frontend, the application was built with React 18 and TypeScript. Vite was used as a build tool, which helped with faster development and optimized production builds. Netlify was also used to host my code and create the website application. The interface also uses Tailwind CSS for styling and shadcn/ui components that were built on Radix UI, providing a clean design system and pre-built components for the website such as buttons, dialogs, and navigation menus. MapBox was used to create the interactive maps shown on the website and the OpenAI API was used to create the AI chatbox/AI analysis of the locations a user puts in. Finally, for the backend, Supabase was used to handle data storage, API endpoints, and real-time features without managing servers.
Challenges we ran into
There were many challenges that I ran into when creating my website. The first problem was connecting the interactive maps using MapBox. We faced an issue where the website would either not load the maps of the cities listed at all or take forever to load. Another challenge was trying to find the data itself. Finding the data for all cities took a long time, taking away much of our time from actual coding. Finally, the last issue I faced was the use of OpenAI's API. When my AI Chatbox was created, an error kept appearing, saying that the AI was not able to give a response to the prompt I gave it. I spent 2 hours trying to figure out the problem, only for me to find out that I needed to pay money to be able to get AI responses.
Accomplishments that we're proud of
One accomplishment that I am proud of is the universal location search on the home page, allowing users to input their location and see if redlining occurred in that area, while also providing insights on how redlining might've possibly affected that area. Another accomplishment that I am particularly proud of is the implementation of AI into this website. I originally did not have a plan to use AI, but with its recent rise in popularity and use, I decided to do some research on how I could implement AI into my project. I am extremely proud of how I was able to optimize AI prompts to provide detailed insights on specific locations related to redlining, as I believe it made the website much more useful.
What we learned
One of the main things I learned while making this project is how CS can truly highlight social inequity within our society. While creating this project, I dealt with many random statistics and data that were hard to interpret and analyze. However, by creating this website, historical data was transformed into interactive maps that help audiences who are unfamiliar with redlining learn about these issues. This highlights how CS can bridge the gap between complex historical data and our understanding, allowing for complex information to be much more digestible. Additionally, with the use of AI Analysis, I learned that AI can be a very useful tool in teaching social inequities. In this project, AI serves as an assistant that helps better understand the context of redlining within its location.
What's next for Redlining in Modern Times
One of the main things that I want to add is to add the rest of my data to my maps. Currently, my website is still in its prototyping stage, and only HOLC data shows on the map. Using Mapbox, I plan to add modern urban data that will overlay on top of the HOLC data. Additionally, I plan to go further with the use of AI, using clustering to combine both historical data and modern data to create outputs that highlight an urban issue in a specific area, and what actions can be taken to fix it. I also want to add a community feature, allowing people to collaborate and share issues they might have with the neighborhoods and cities.
Built With
- holc
- mapbox
- netlify
- openai
- openstreetmap
- react
- supabase
- tailwindcss
- typescript
- vite

Log in or sign up for Devpost to join the conversation.