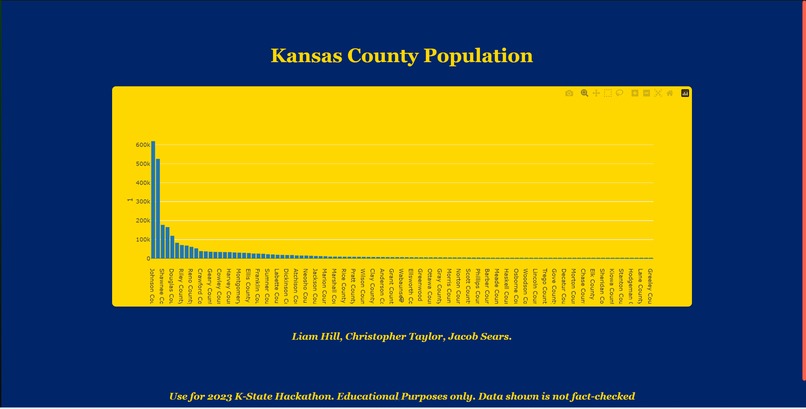
Physical application screenshot 
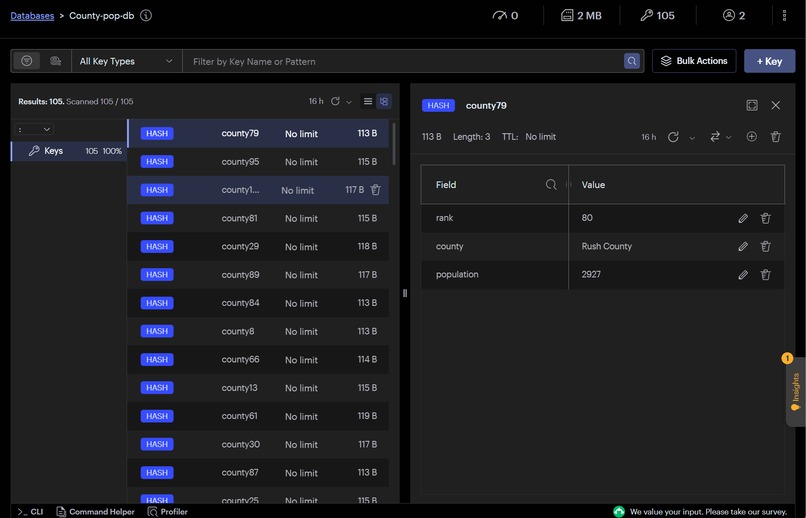
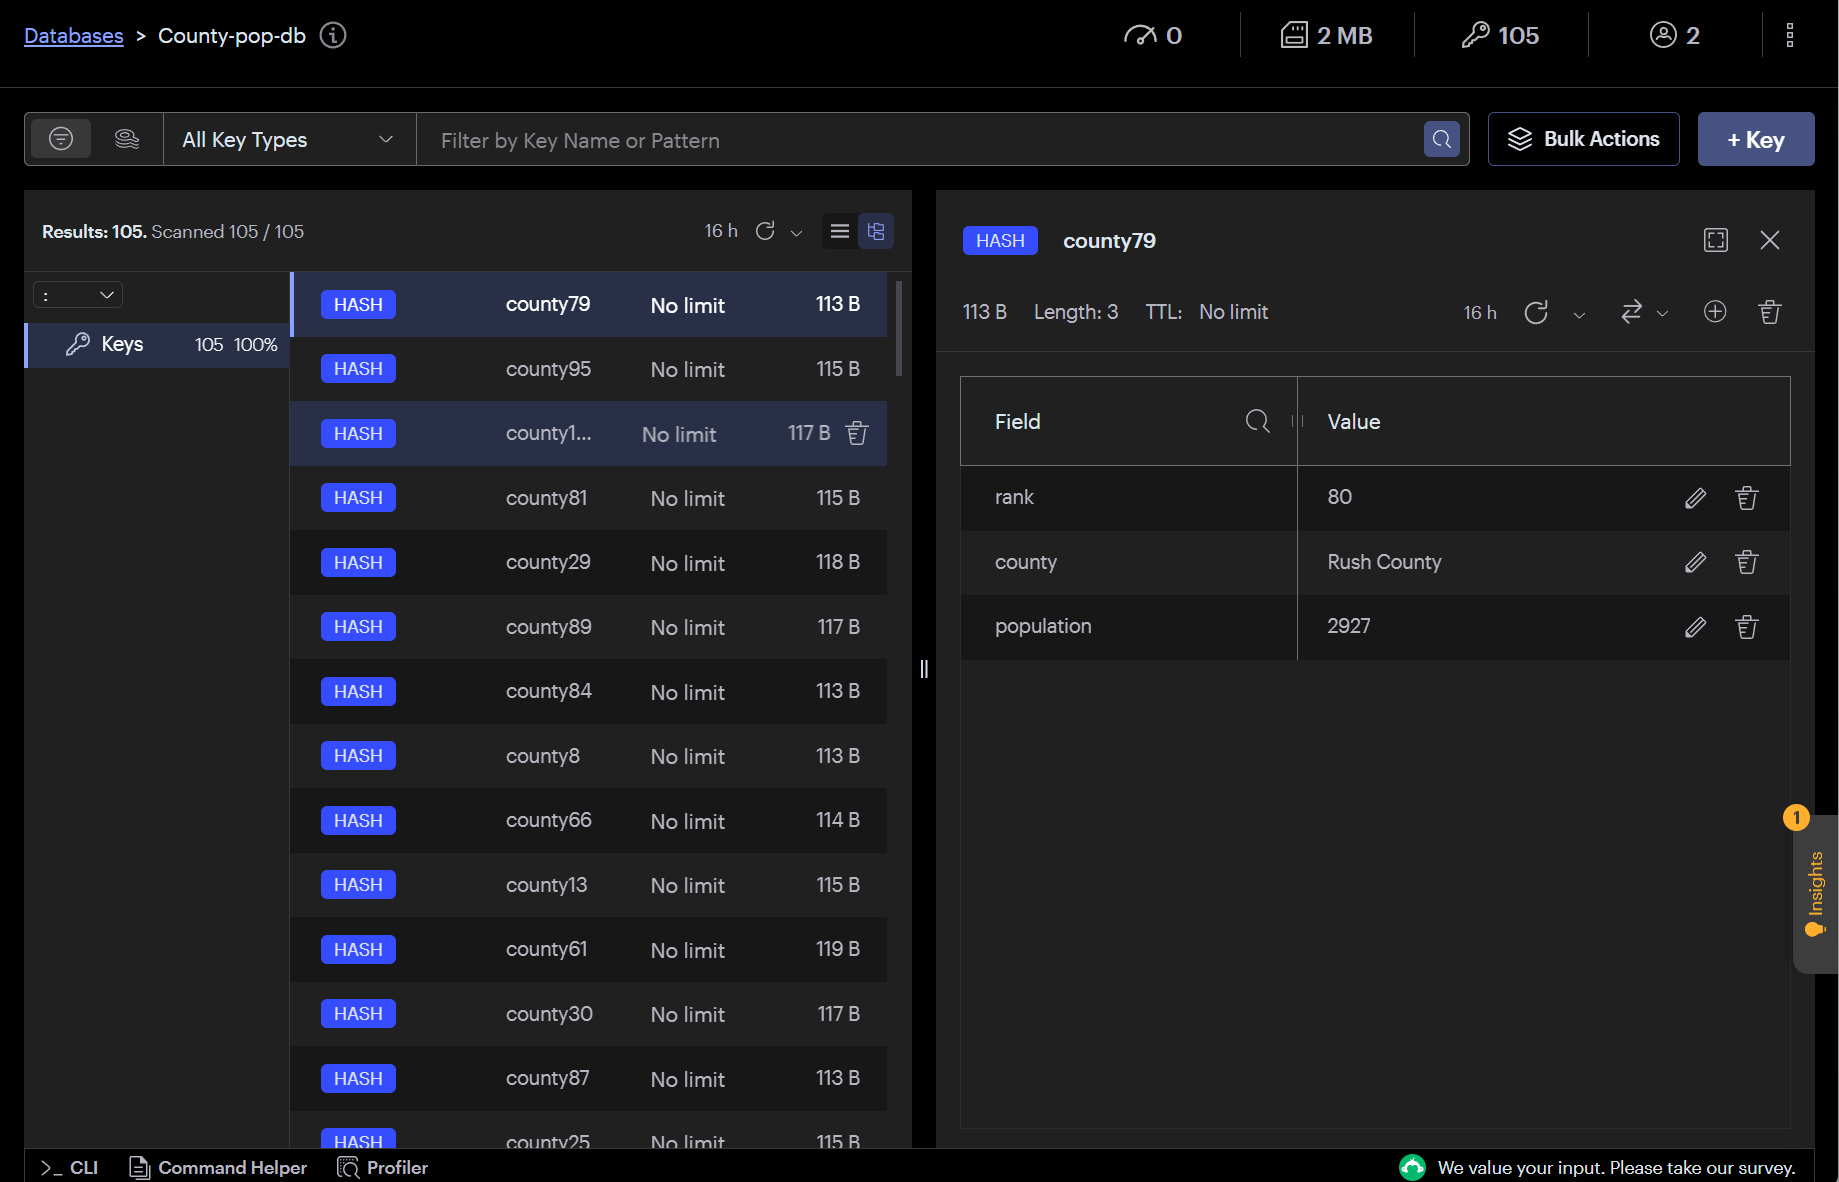
Picture of database with example Hash Our inspiration is we wanted to take 2 resources that were provided to us and combine them, those being Redis and Taipy. Our application takes data from a Redis detabase and vizualizes it using Pythons Taipy in a clean chart. We built it of course using Taipy and Redis and also using PyCharm Our biggest hurdle was we thought redis was suppose to be used for a web service... oh how wrong we were. After the first hurdle of trying to make it into a web3 server transitioning to a application made everything a lot easier. Sometimes its okay to slow down and look at things from a different angle. What's next is anyone can use this as a way to visualize their databases using Redis. Built With githubpycharmpythonredistypai Try it out github.com
Updates Chris T. started this project — Nov 05, 2023 01:56 AM EST Leave feedback in the comments! Log in or sign up for Devpost to join the conversation.
Chris T. started this project — Nov 05, 2023 01:56 AM EST Leave feedback in the comments! Log in or sign up for Devpost to join the conversation.
Log in or sign up for Devpost to join the conversation.