Devpost
Participate in our public hackathons
Devpost for Teams
Access your company's private hackathons
Grow your developer ecosystem and promote your platform
Drive innovation, collaboration, and retention within your organization
By use case
Blog
Insights into hackathon planning and participation
Customer stories
Inspiration from peers and other industry leaders
Planning guides
Best practices for planning online and in-person hackathons
Webinars & events
Upcoming events and on-demand recordings
Help desk
Common questions and support documentation
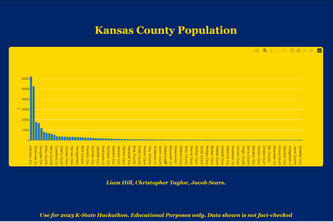
Ever needed a nice list of your Redis data put out in a simple chart. Using our application with the help of Taipy we can visualize our data in a chart that's easy to read and can hold lots of info.
This is a web based game that combines trivia with tic-tac-toe.