-
-
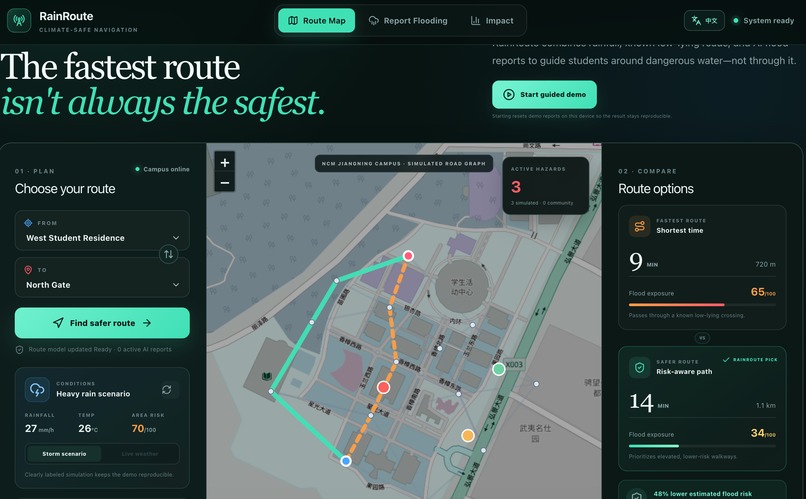
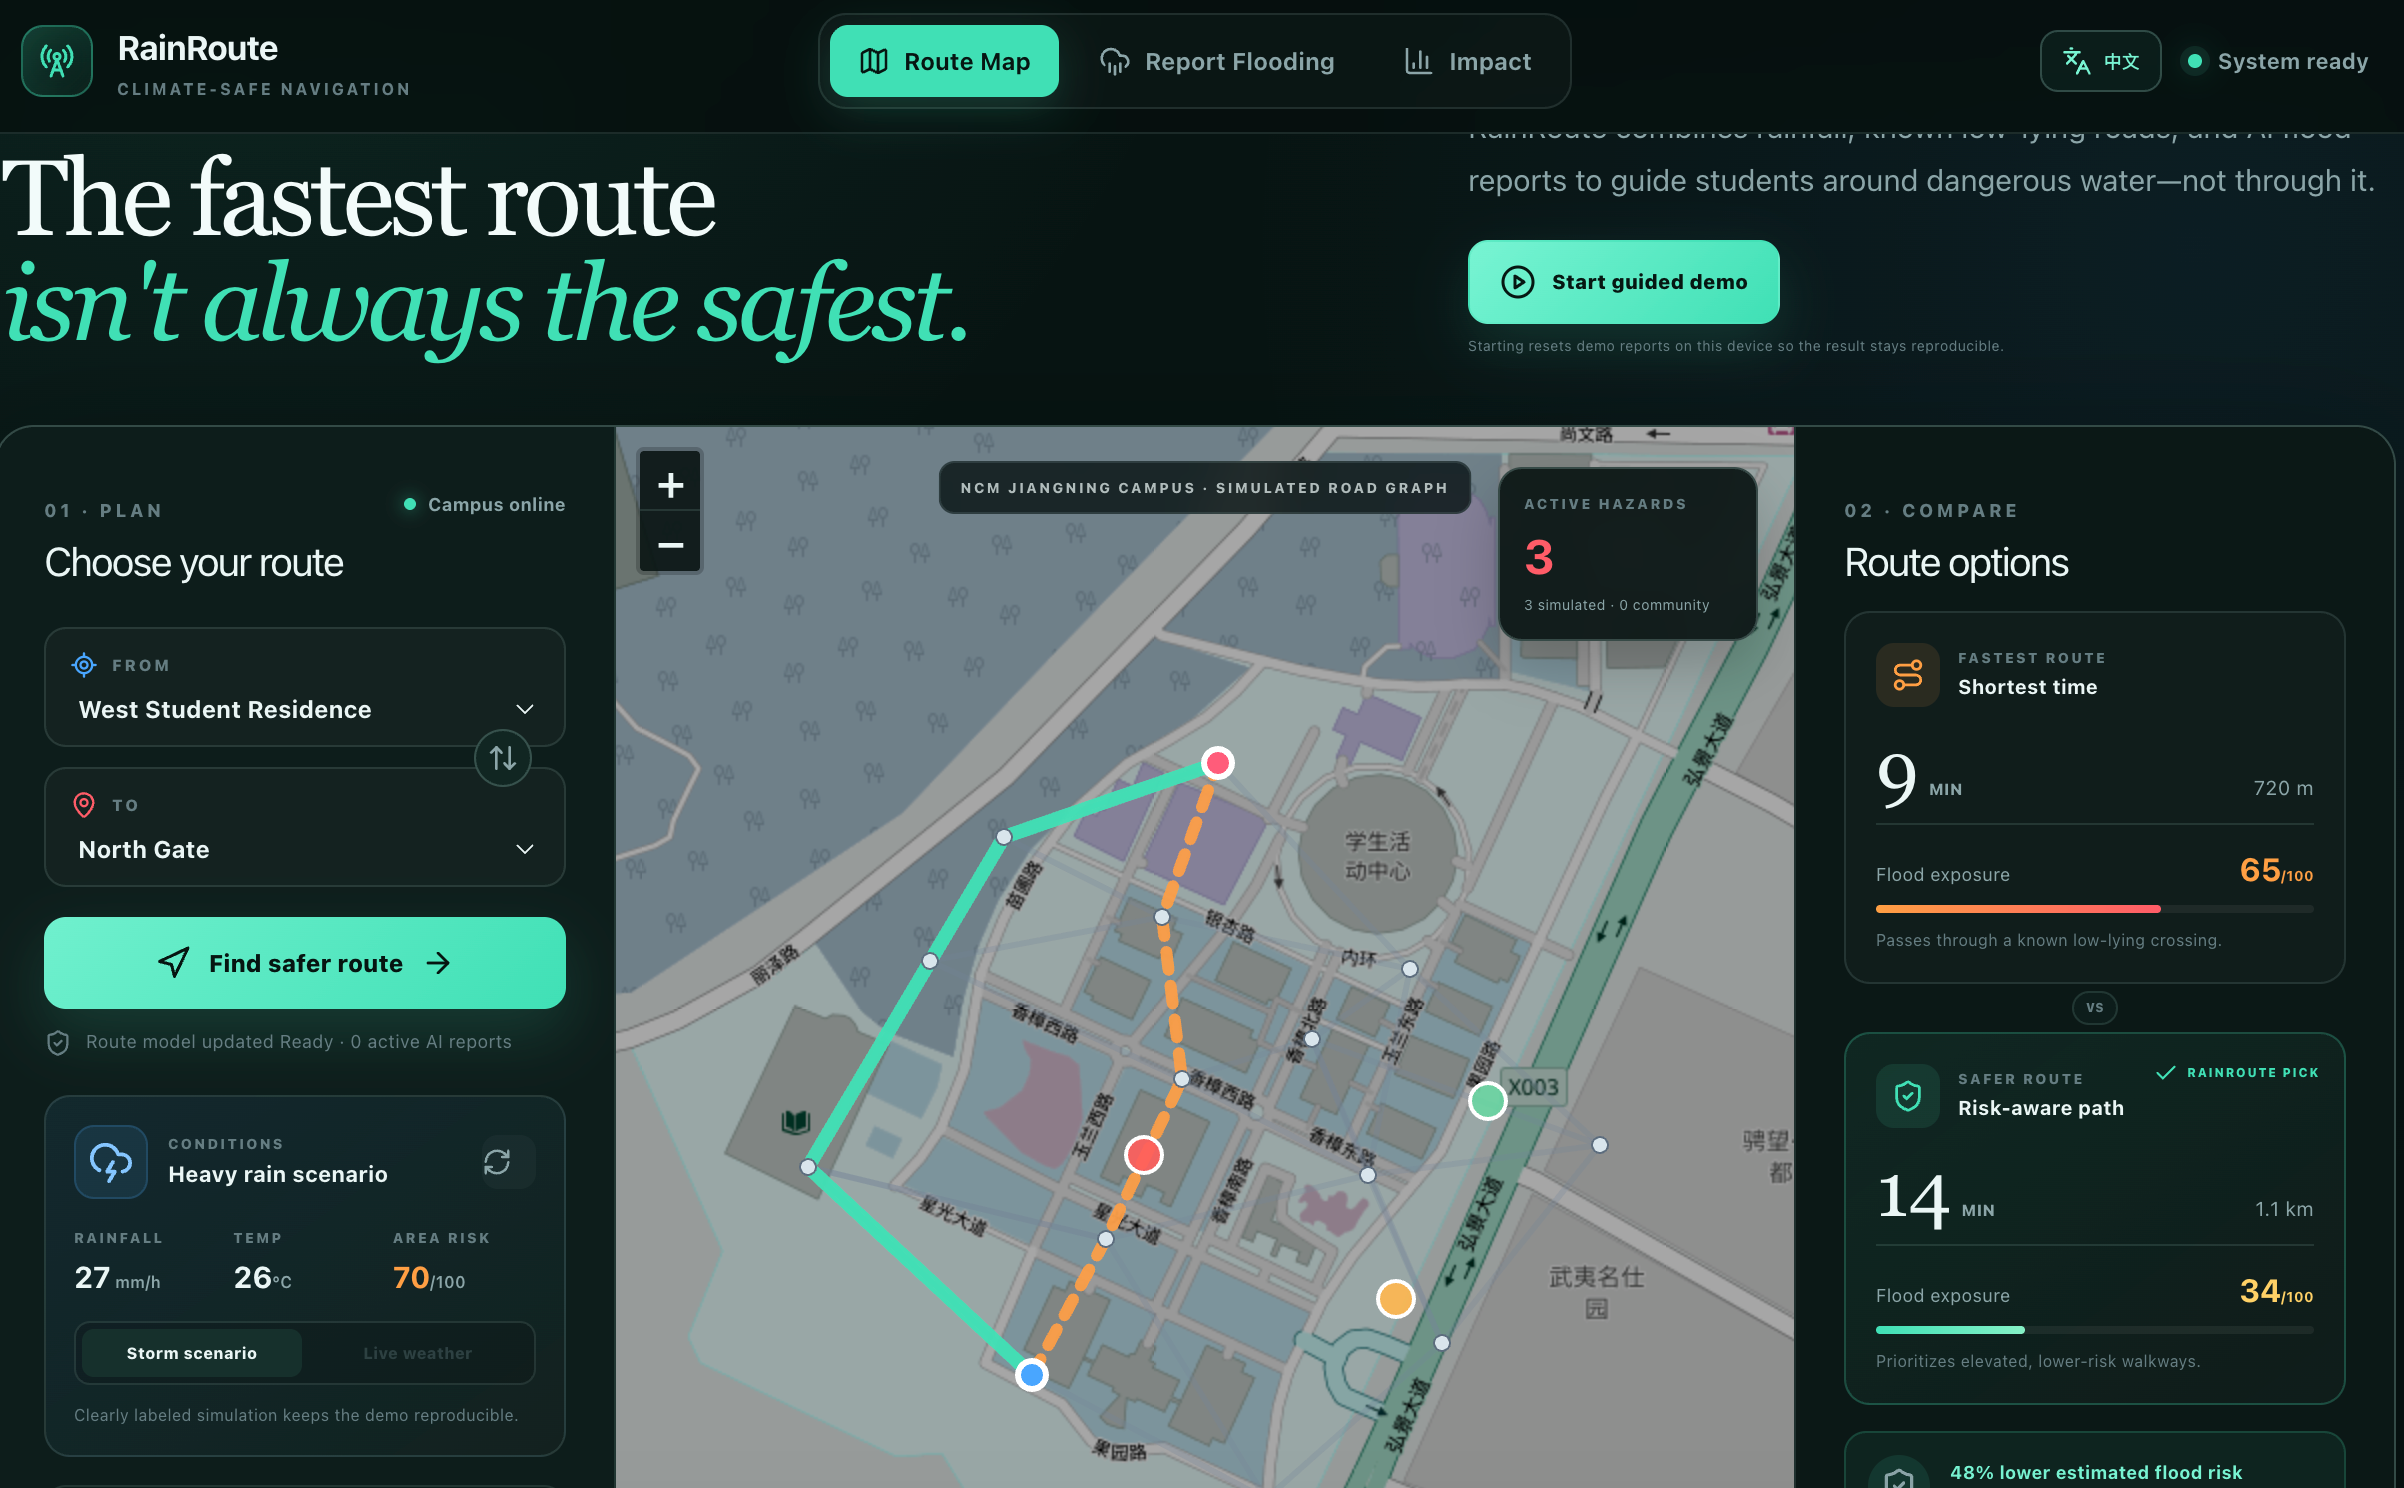
Fastest and flood-aware campus route comparison under a simulated heavy-rain scenario.
-
-
-
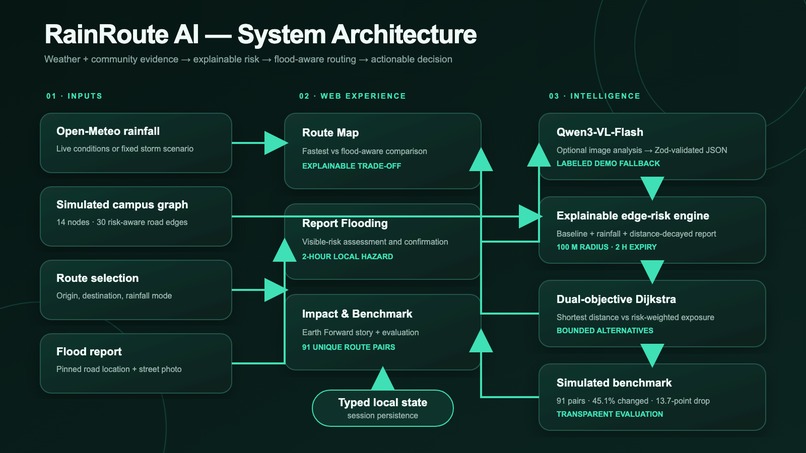
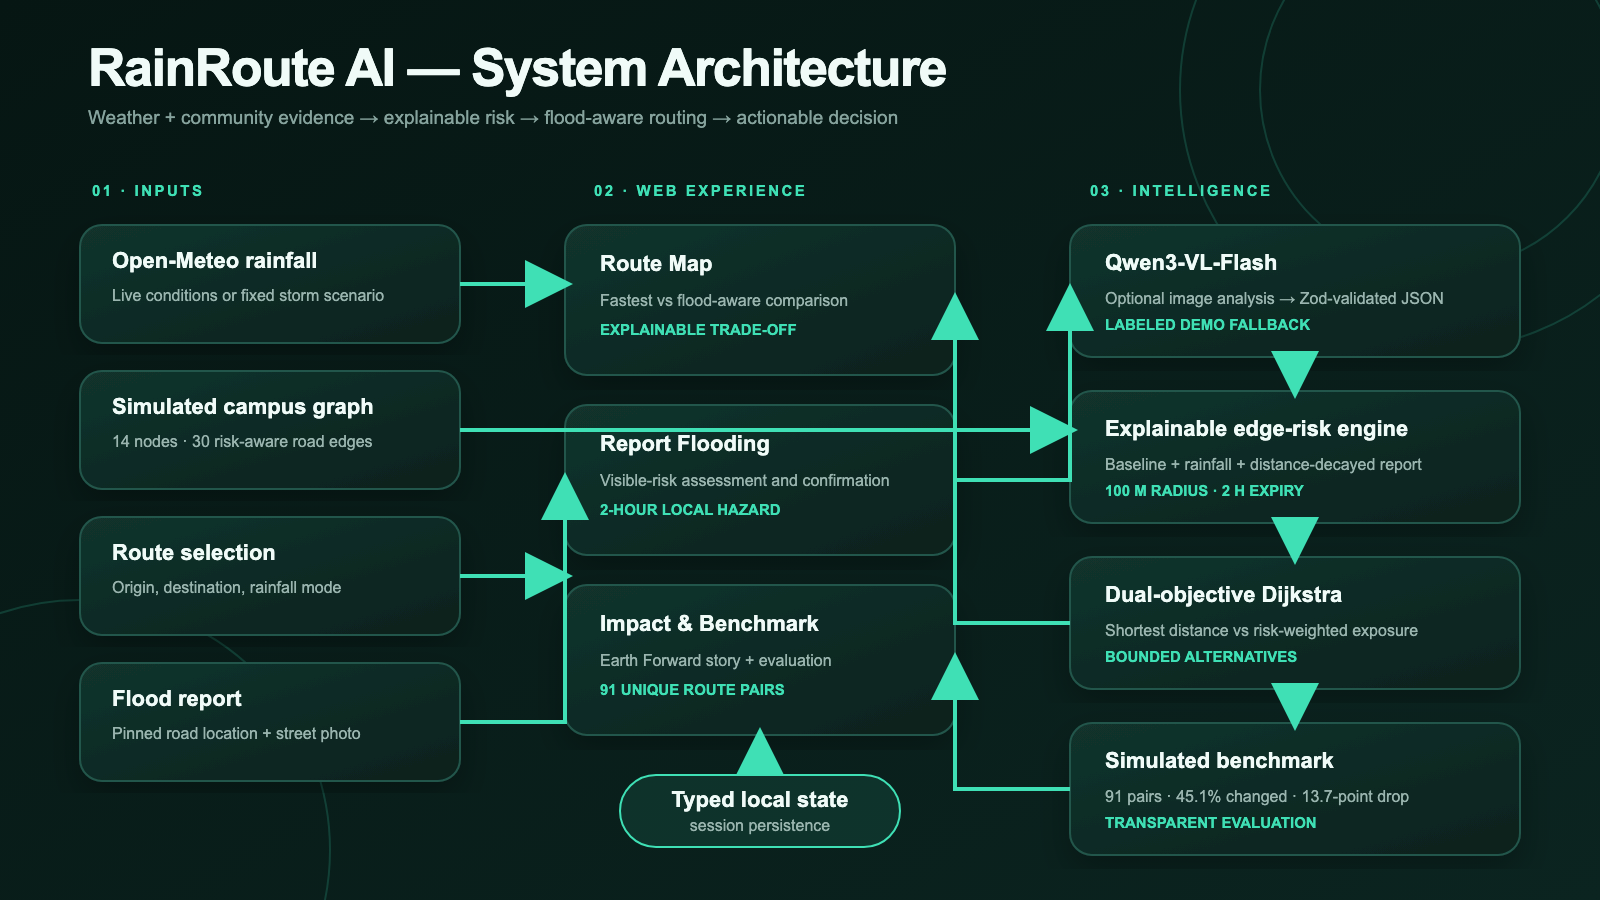
RainRoute AI architecture: weather, Qwen vision, validated risk reports and explainable routing.
Inspiration
During extreme rainfall, the shortest walking route is not always the safest. A normal navigation application may direct a student through a low-lying crossing or a walkway that flooded only minutes ago because it optimizes distance and time rather than rapidly changing flood exposure.
RainRoute AI was inspired by one practical climate-resilience question: Which walking route exposes a person to less estimated flood risk right now?
Instead of creating another abstract climate dashboard, we wanted to turn weather conditions and community observations into an immediate, explainable decision.
What it does
RainRoute AI compares two campus walking routes:
- An orange dashed route that minimizes distance.
- A green route that reduces estimated flood-risk exposure.
Users can select an origin and destination, compare travel time, distance and estimated exposure, and understand why a route is recommended.
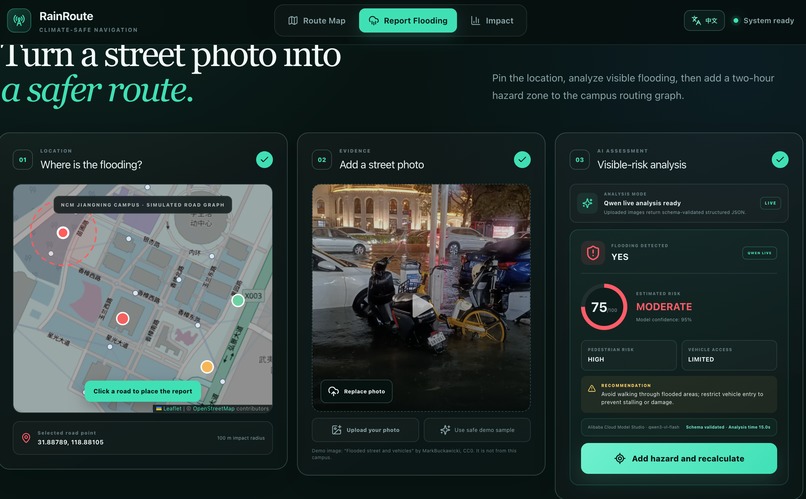
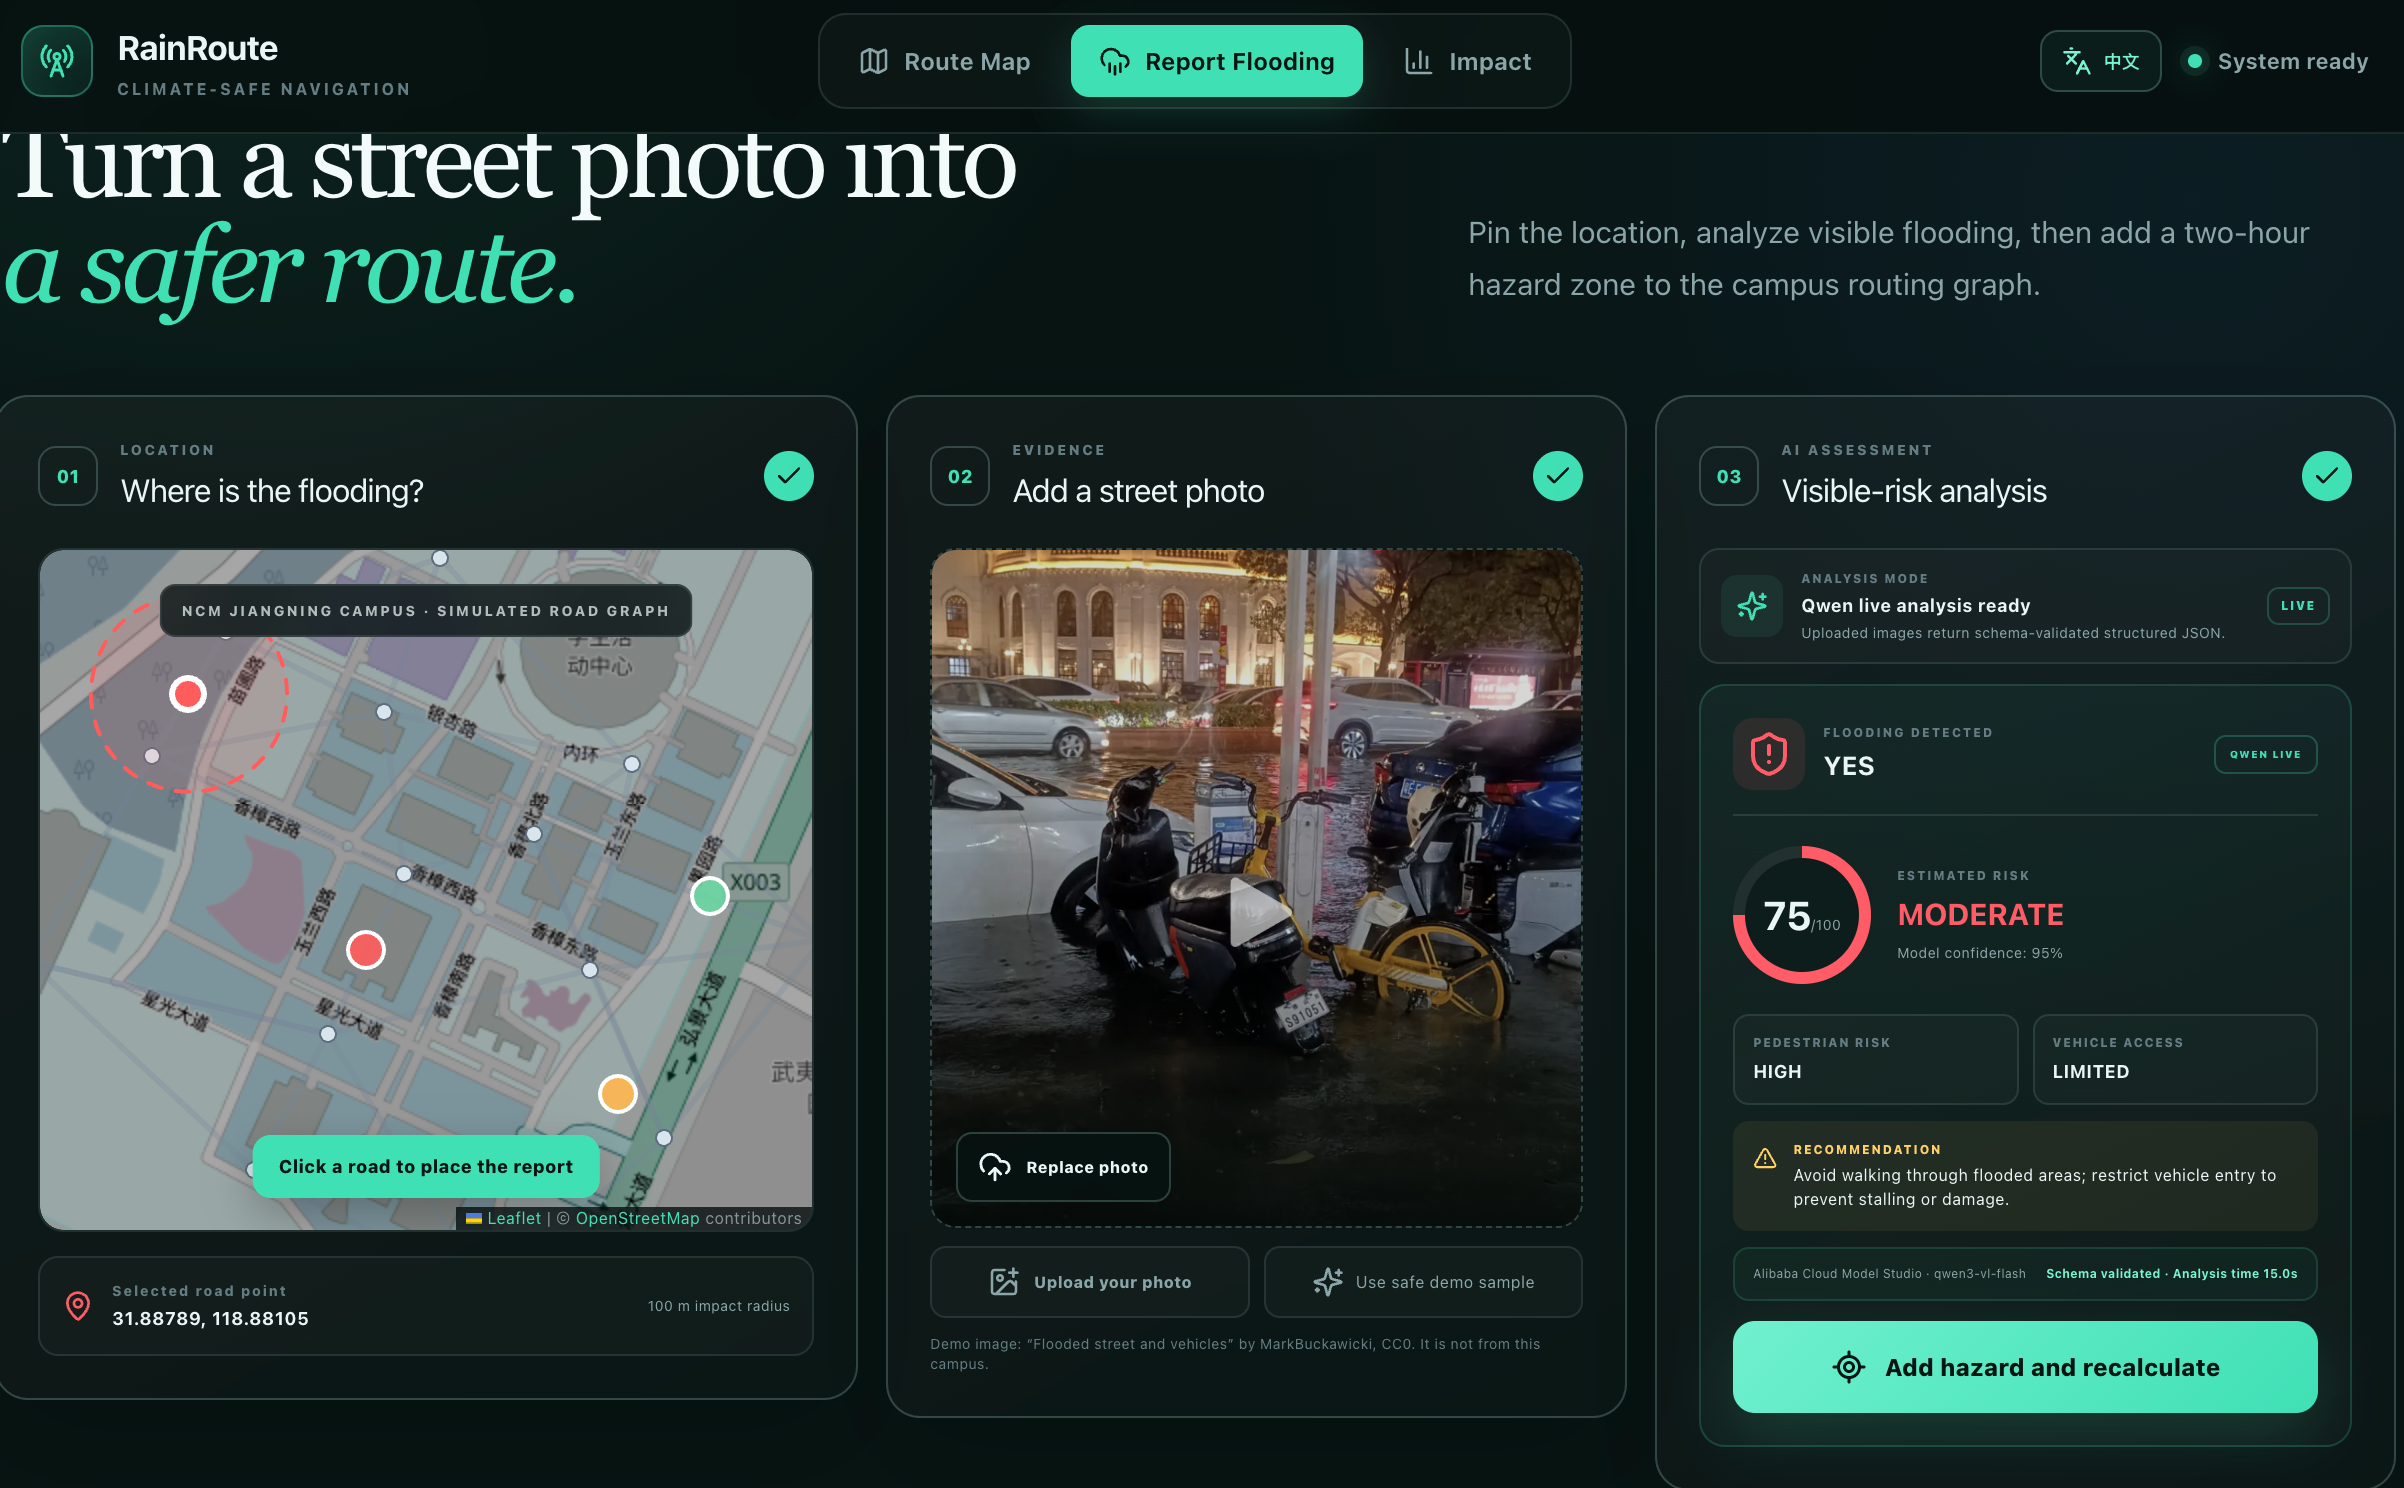
When a user sees flooding, they can:
- Click the affected location on the map.
- Upload a street photo.
- Analyze visible flood conditions using Qwen3-VL-Flash.
- Review structured results such as severity, confidence, pedestrian risk and vehicle accessibility.
- Add a temporary hazard to the routing graph.
- Recalculate the route immediately.
Confirmed reports affect roads within a 100-metre radius, decay with distance and expire automatically after two hours.
A clearly labeled demo image and deterministic result are also available so the prototype remains reproducible when the live AI service is unavailable. Demo results are never presented as live analysis.
How we built it
RainRoute AI uses TypeScript, React, a Next-compatible App Router, Leaflet, React Leaflet and OpenStreetMap. It is deployed publicly using Cloudflare Workers.
The prototype uses a simulated campus road network containing 14 nodes and 30 road segments. Each segment has a baseline flood-risk value.
The estimated road risk combines:
- Baseline road conditions.
- Rainfall intensity.
- Temporary nearby flood reports.
The fastest route uses Dijkstra's algorithm to minimize distance. The flood-aware route minimizes a risk-weighted cost:
safe cost = distance × (1 + 2.5 × road risk / 100)
If the fastest and flood-aware objectives initially produce the same path, RainRoute evaluates bounded alternatives. It only recommends another route when the estimated exposure improves by at least five risk points and the distance remains within 1.75 times the shortest route.
For image analysis, the hosted application sends an uploaded image to Alibaba Cloud Model Studio Qwen3-VL-Flash. The model returns structured JSON describing visible flooding, severity, pedestrian risk, vehicle access, confidence and a recommendation. Zod validates the response before it can affect application state.
Challenges we ran into
One major challenge was making the fastest and safer routes meaningfully different without fabricating an alternative. For some origin and destination pairs, the shortest route is genuinely also the lowest-risk route. RainRoute reports this overlap honestly rather than forcing a visual difference.
Another challenge was safely connecting probabilistic image analysis to routing decisions. A photo cannot confirm exact water depth, current speed, electrical hazards, hidden drains or an official road closure. We therefore added confidence information, strict JSON validation, a limited influence radius, automatic expiry and visible safety warnings.
We also needed the demonstration to remain reliable under API delays. RainRoute includes an explicitly labeled deterministic fallback while keeping live Qwen results visually distinct.
Accomplishments that we are proud of
- Built a complete report-to-reroute feedback loop.
- Created explainable fastest and flood-aware routing objectives.
- Added live Qwen image analysis with schema validation.
- Added a clearly labeled and reproducible demonstration mode.
- Implemented temporary, distance-decaying hazard reports.
- Added Chinese and English interfaces.
- Created a guided judge demonstration.
- Added responsive desktop and mobile layouts.
- Published a working application that requires no sign-in.
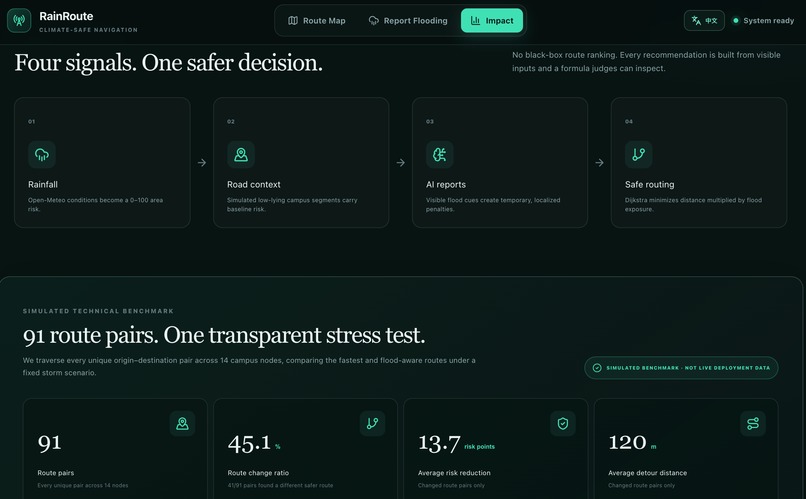
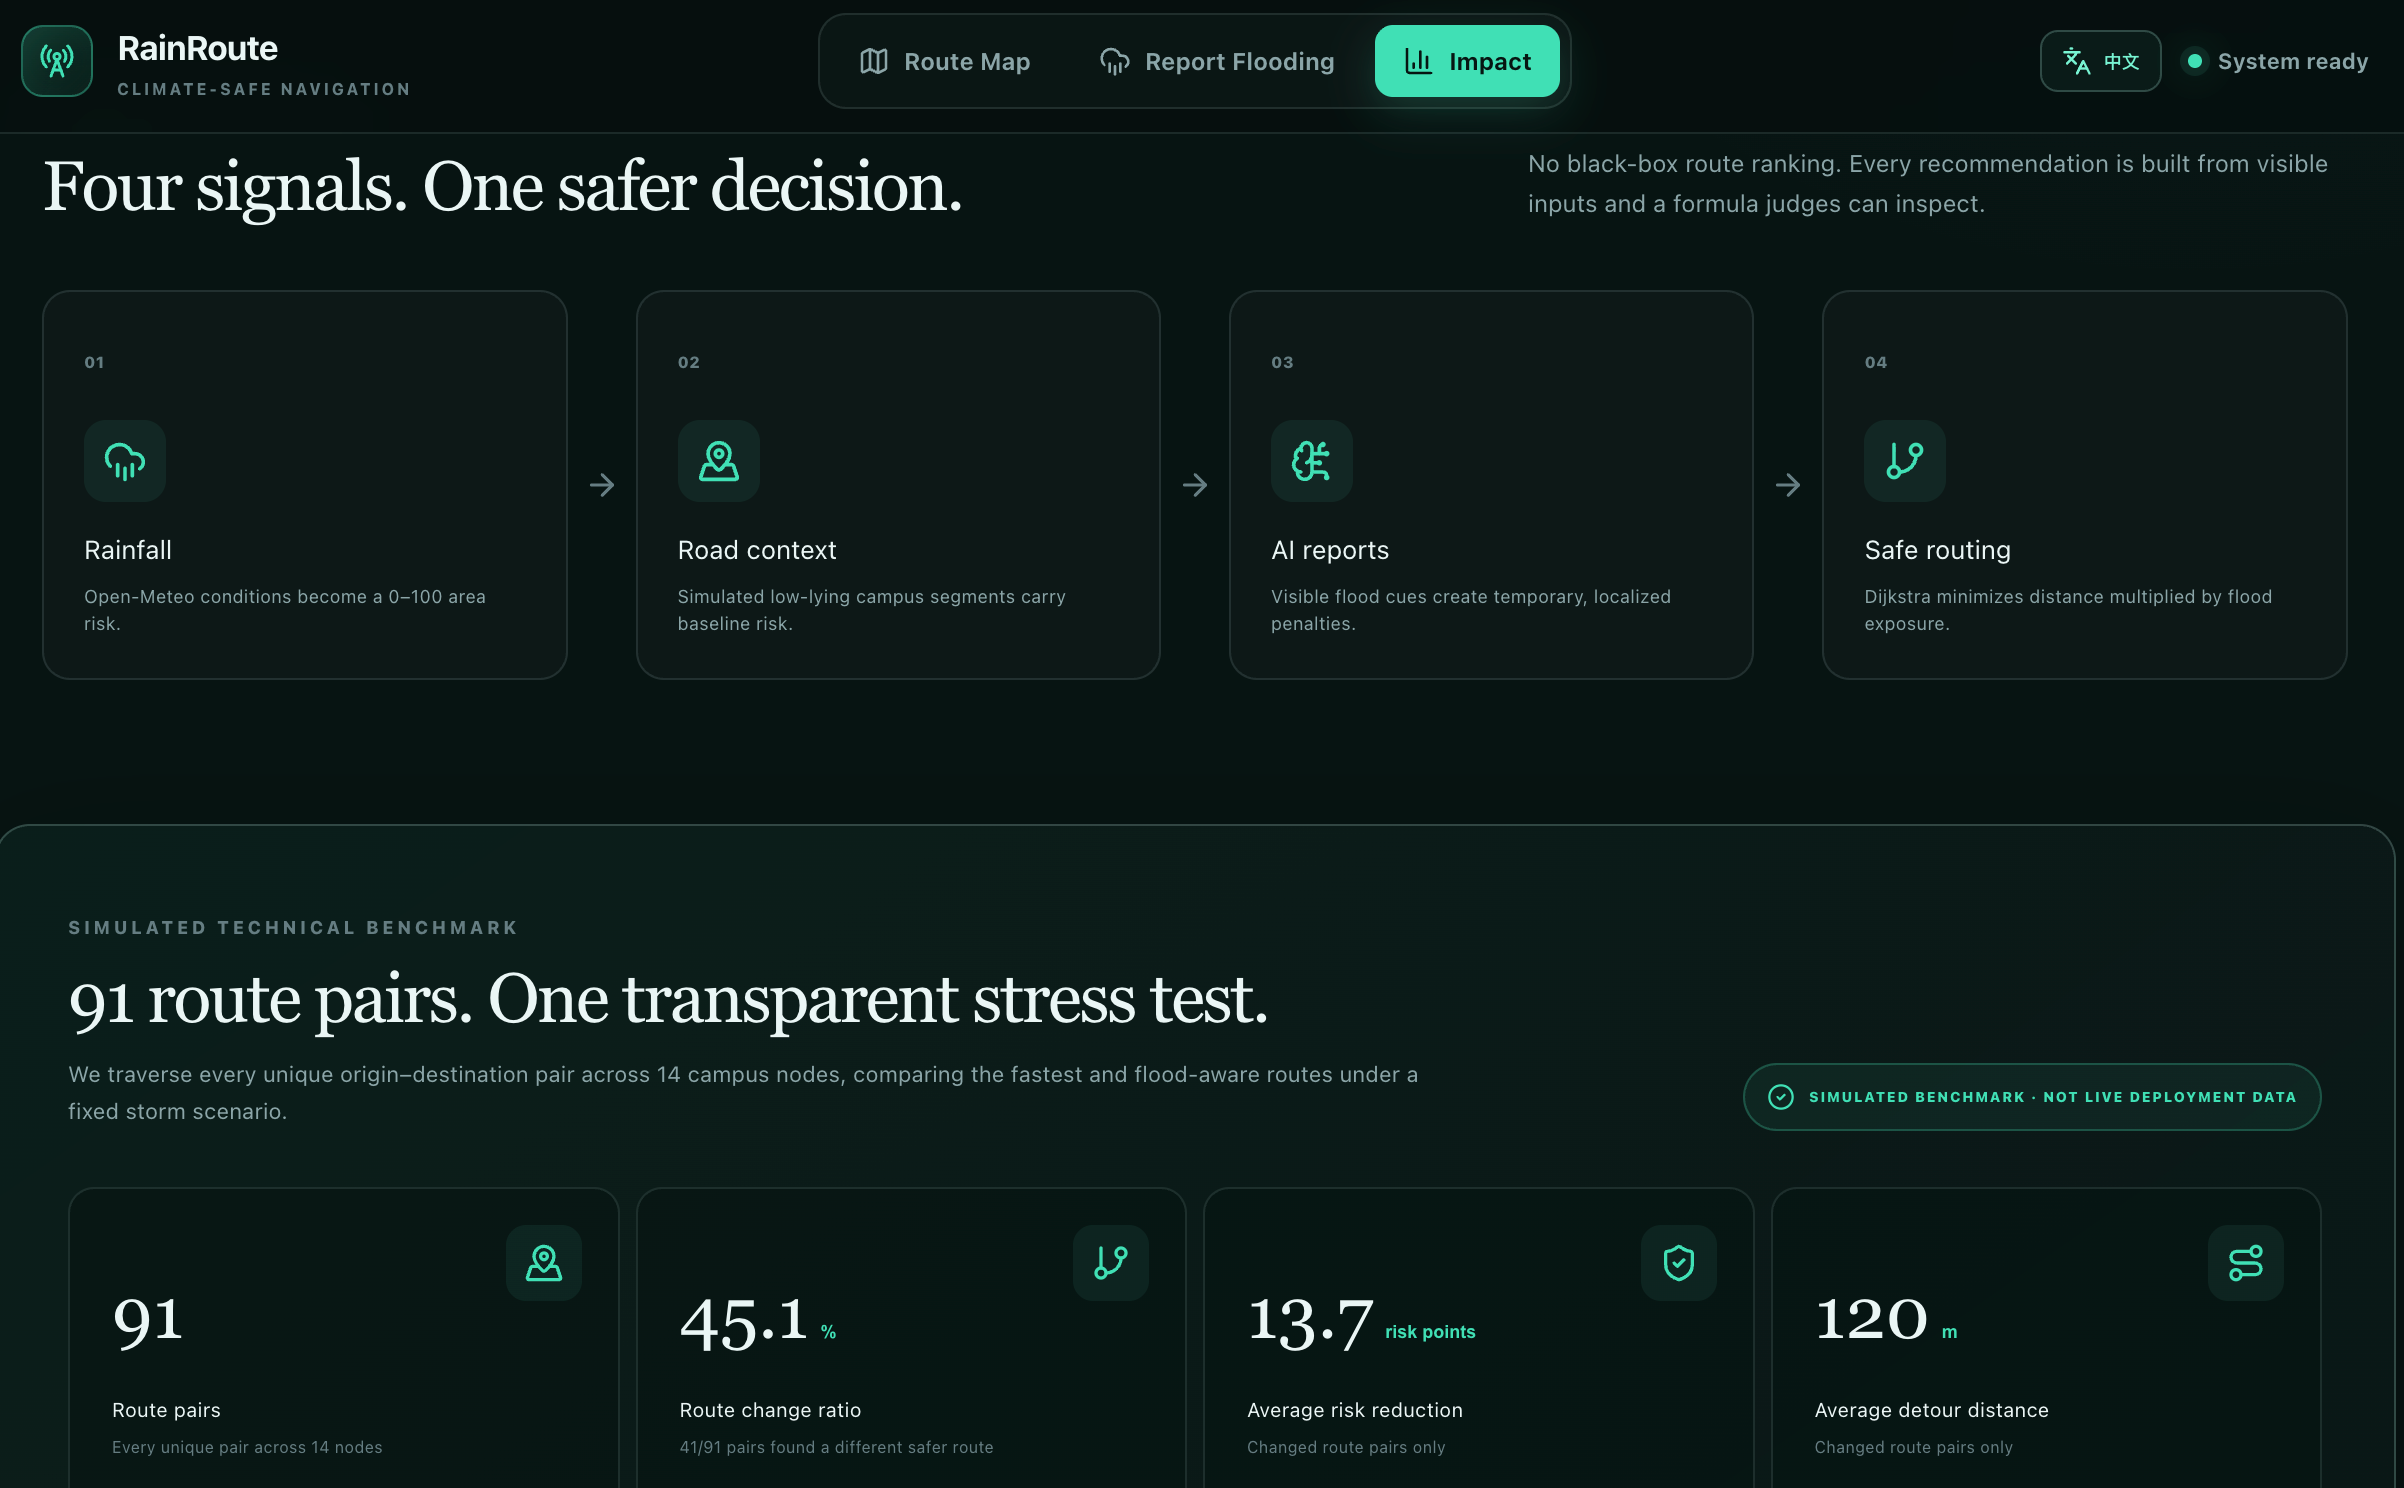
We also evaluated all 91 unique origin-destination pairs in the simulated 14-node graph under a fixed 27 mm/h storm scenario.
- 41 of 91 pairs produced a different flood-aware route.
- The route-change ratio was 45.1%.
- Changed routes reduced estimated exposure by 13.7 risk points on average.
- The average additional distance was 120 metres.
These are simulated prototype results, not real-world safety claims or predictive-accuracy measurements.
What we learned
We learned that climate technology must explain uncertainty rather than hide it. A recommendation is more useful when users can understand the inputs, estimated risk, additional travel and limitations behind it.
We also learned that route quality cannot be represented by one shortest-path result. Evaluating every origin-destination pair exposed edge cases and helped us design more honest route-selection thresholds.
Finally, we learned that AI should provide structured evidence rather than act as an unquestionable authority. Official weather alerts, campus instructions and emergency services must always take priority.
What's next
Future versions could replace the simulated road graph with campus-authorized GIS, elevation, drainage and accessibility data.
We would also like to add:
- Moderation and duplicate-report detection.
- Calibration with labeled local flood imagery.
- Official closure and warning integration.
- Privacy-aware community reporting.
- Accessible evacuation-route preferences.
- A supervised campus safety pilot.
The long-term goal is not to replace emergency authorities. It is to provide a transparent climate-adaptation layer between weather warnings and street-level movement decisions.
Safety and transparency
RainRoute AI is a hackathon prototype, not emergency-navigation infrastructure. Image analysis estimates visible conditions only. Users should follow official alerts and emergency instructions first.
The campus graph, road-risk values, storm scenario and benchmark results are explicitly labeled as simulated.
Build timeline disclosure
RainRoute AI is a continuing project. The core concept, simulated routing prototype, bilingual interface, guided demo, AI integration and initial benchmark existed before the official event window.
Work completed during NextStep Hacks is recorded separately through public commits and the repository's timeline disclosure. We do not present pre-event work as competition-period work.## Inspiration
During extreme rainfall, the shortest walking route is not always the safest. A normal navigation application may direct a student through a low-lying crossing or a walkway that flooded only minutes ago because it optimizes distance and time rather than rapidly changing flood exposure.
RainRoute AI was inspired by one practical climate-resilience question: Which walking route exposes a person to less estimated flood risk right now?
Instead of creating another abstract climate dashboard, we wanted to turn weather conditions and community observations into an immediate, explainable decision.
What it does
RainRoute AI compares two campus walking routes:
- An orange dashed route that minimizes distance.
- A green route that reduces estimated flood-risk exposure.
Users can select an origin and destination, compare travel time, distance and estimated exposure, and understand why a route is recommended.
When a user sees flooding, they can:
- Click the affected location on the map.
- Upload a street photo.
- Analyze visible flood conditions using Qwen3-VL-Flash.
- Review structured results such as severity, confidence, pedestrian risk and vehicle accessibility.
- Add a temporary hazard to the routing graph.
- Recalculate the route immediately.
Confirmed reports affect roads within a 100-metre radius, decay with distance and expire automatically after two hours.
A clearly labeled demo image and deterministic result are also available so the prototype remains reproducible when the live AI service is unavailable. Demo results are never presented as live analysis.
How we built it
RainRoute AI uses TypeScript, React, a Next-compatible App Router, Leaflet, React Leaflet and OpenStreetMap. It is deployed publicly using Cloudflare Workers.
The prototype uses a simulated campus road network containing 14 nodes and 30 road segments. Each segment has a baseline flood-risk value.
The estimated road risk combines:
- Baseline road conditions.
- Rainfall intensity.
- Temporary nearby flood reports.
The fastest route uses Dijkstra's algorithm to minimize distance. The flood-aware route minimizes a risk-weighted cost:
safe cost = distance × (1 + 2.5 × road risk / 100)
If the fastest and flood-aware objectives initially produce the same path, RainRoute evaluates bounded alternatives. It only recommends another route when the estimated exposure improves by at least five risk points and the distance remains within 1.75 times the shortest route.
For image analysis, the hosted application sends an uploaded image to Alibaba Cloud Model Studio Qwen3-VL-Flash. The model returns structured JSON describing visible flooding, severity, pedestrian risk, vehicle access, confidence and a recommendation. Zod validates the response before it can affect application state.
Challenges we ran into
One major challenge was making the fastest and safer routes meaningfully different without fabricating an alternative. For some origin and destination pairs, the shortest route is genuinely also the lowest-risk route. RainRoute reports this overlap honestly rather than forcing a visual difference.
Another challenge was safely connecting probabilistic image analysis to routing decisions. A photo cannot confirm exact water depth, current speed, electrical hazards, hidden drains or an official road closure. We therefore added confidence information, strict JSON validation, a limited influence radius, automatic expiry and visible safety warnings.
We also needed the demonstration to remain reliable under API delays. RainRoute includes an explicitly labeled deterministic fallback while keeping live Qwen results visually distinct.
Accomplishments that we are proud of
- Built a complete report-to-reroute feedback loop.
- Created explainable fastest and flood-aware routing objectives.
- Added live Qwen image analysis with schema validation.
- Added a clearly labeled and reproducible demonstration mode.
- Implemented temporary, distance-decaying hazard reports.
- Added Chinese and English interfaces.
- Created a guided judge demonstration.
- Added responsive desktop and mobile layouts.
- Published a working application that requires no sign-in.
We also evaluated all 91 unique origin-destination pairs in the simulated 14-node graph under a fixed 27 mm/h storm scenario.
- 41 of 91 pairs produced a different flood-aware route.
- The route-change ratio was 45.1%.
- Changed routes reduced estimated exposure by 13.7 risk points on average.
- The average additional distance was 120 metres.
These are simulated prototype results, not real-world safety claims or predictive-accuracy measurements.
What we learned
We learned that climate technology must explain uncertainty rather than hide it. A recommendation is more useful when users can understand the inputs, estimated risk, additional travel and limitations behind it.
We also learned that route quality cannot be represented by one shortest-path result. Evaluating every origin-destination pair exposed edge cases and helped us design more honest route-selection thresholds.
Finally, we learned that AI should provide structured evidence rather than act as an unquestionable authority. Official weather alerts, campus instructions and emergency services must always take priority.
What's next
Future versions could replace the simulated road graph with campus-authorized GIS, elevation, drainage and accessibility data.
We would also like to add:
- Moderation and duplicate-report detection.
- Calibration with labeled local flood imagery.
- Official closure and warning integration.
- Privacy-aware community reporting.
- Accessible evacuation-route preferences.
- A supervised campus safety pilot.
The long-term goal is not to replace emergency authorities. It is to provide a transparent climate-adaptation layer between weather warnings and street-level movement decisions.
Safety and transparency
RainRoute AI is a hackathon prototype, not emergency-navigation infrastructure. Image analysis estimates visible conditions only. Users should follow official alerts and emergency instructions first.
The campus graph, road-risk values, storm scenario and benchmark results are explicitly labeled as simulated.
Build timeline disclosure
RainRoute AI is a continuing project. The core concept, simulated routing prototype, bilingual interface, guided demo, AI integration and initial benchmark existed before the official event window.
Work completed during NextStep Hacks is recorded separately through public commits and the repository's timeline disclosure. We do not present pre-event work as competition-period work.
Built With
- alibaba
- cloud
- cloudflare
- css3
- dijkstra
- html5
- leaflet.js
- model
- next.js
- node.js
- open-meteo
- openstreetmap
- qwen3-vl-flash
- react
- typescript
- zod


Log in or sign up for Devpost to join the conversation.