
Inspiration
I’m a huge fan of open-world and sandbox games like Minecraft and Cities: Skylines. I love exploring a world, watching it come alive, and discovering something unexpected around the next corner. With all the excitement around GTA 6, an idea struck me: why not create a gamified, cartoonish version of our own campus?
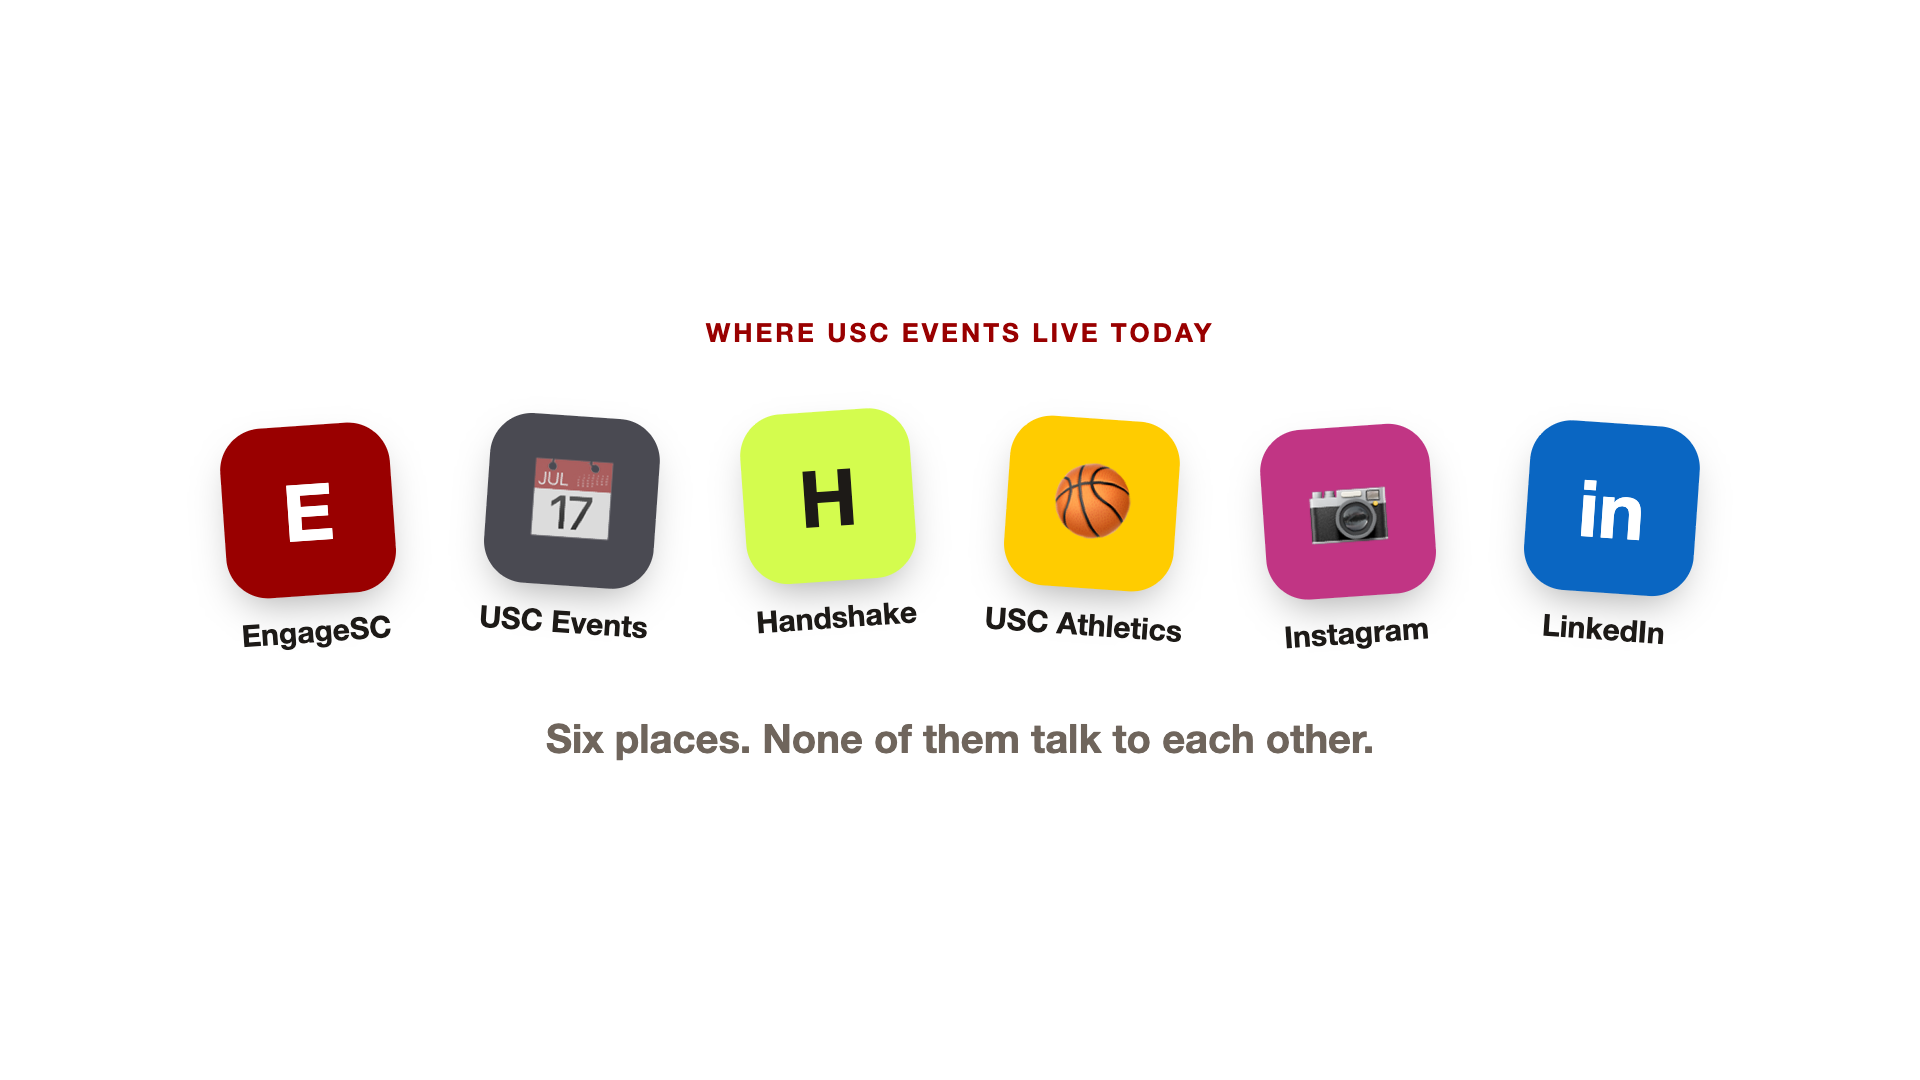
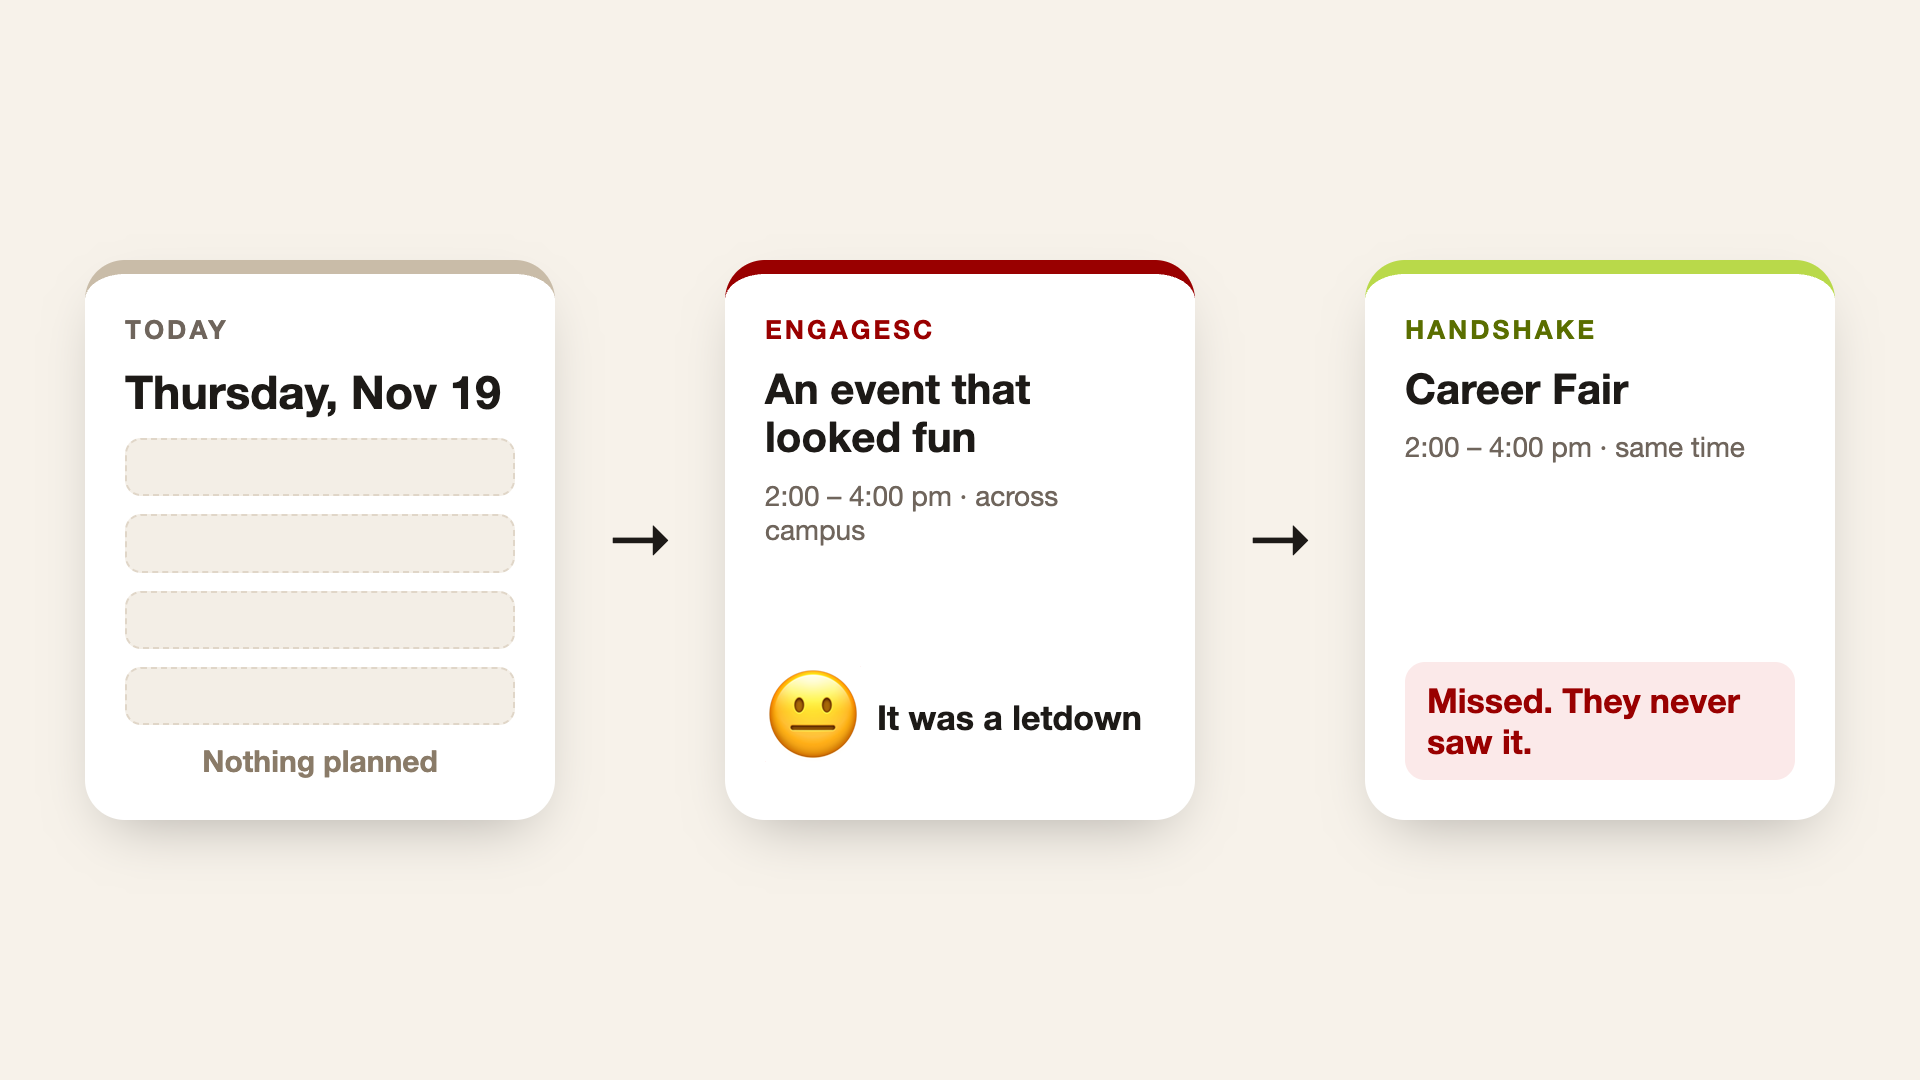
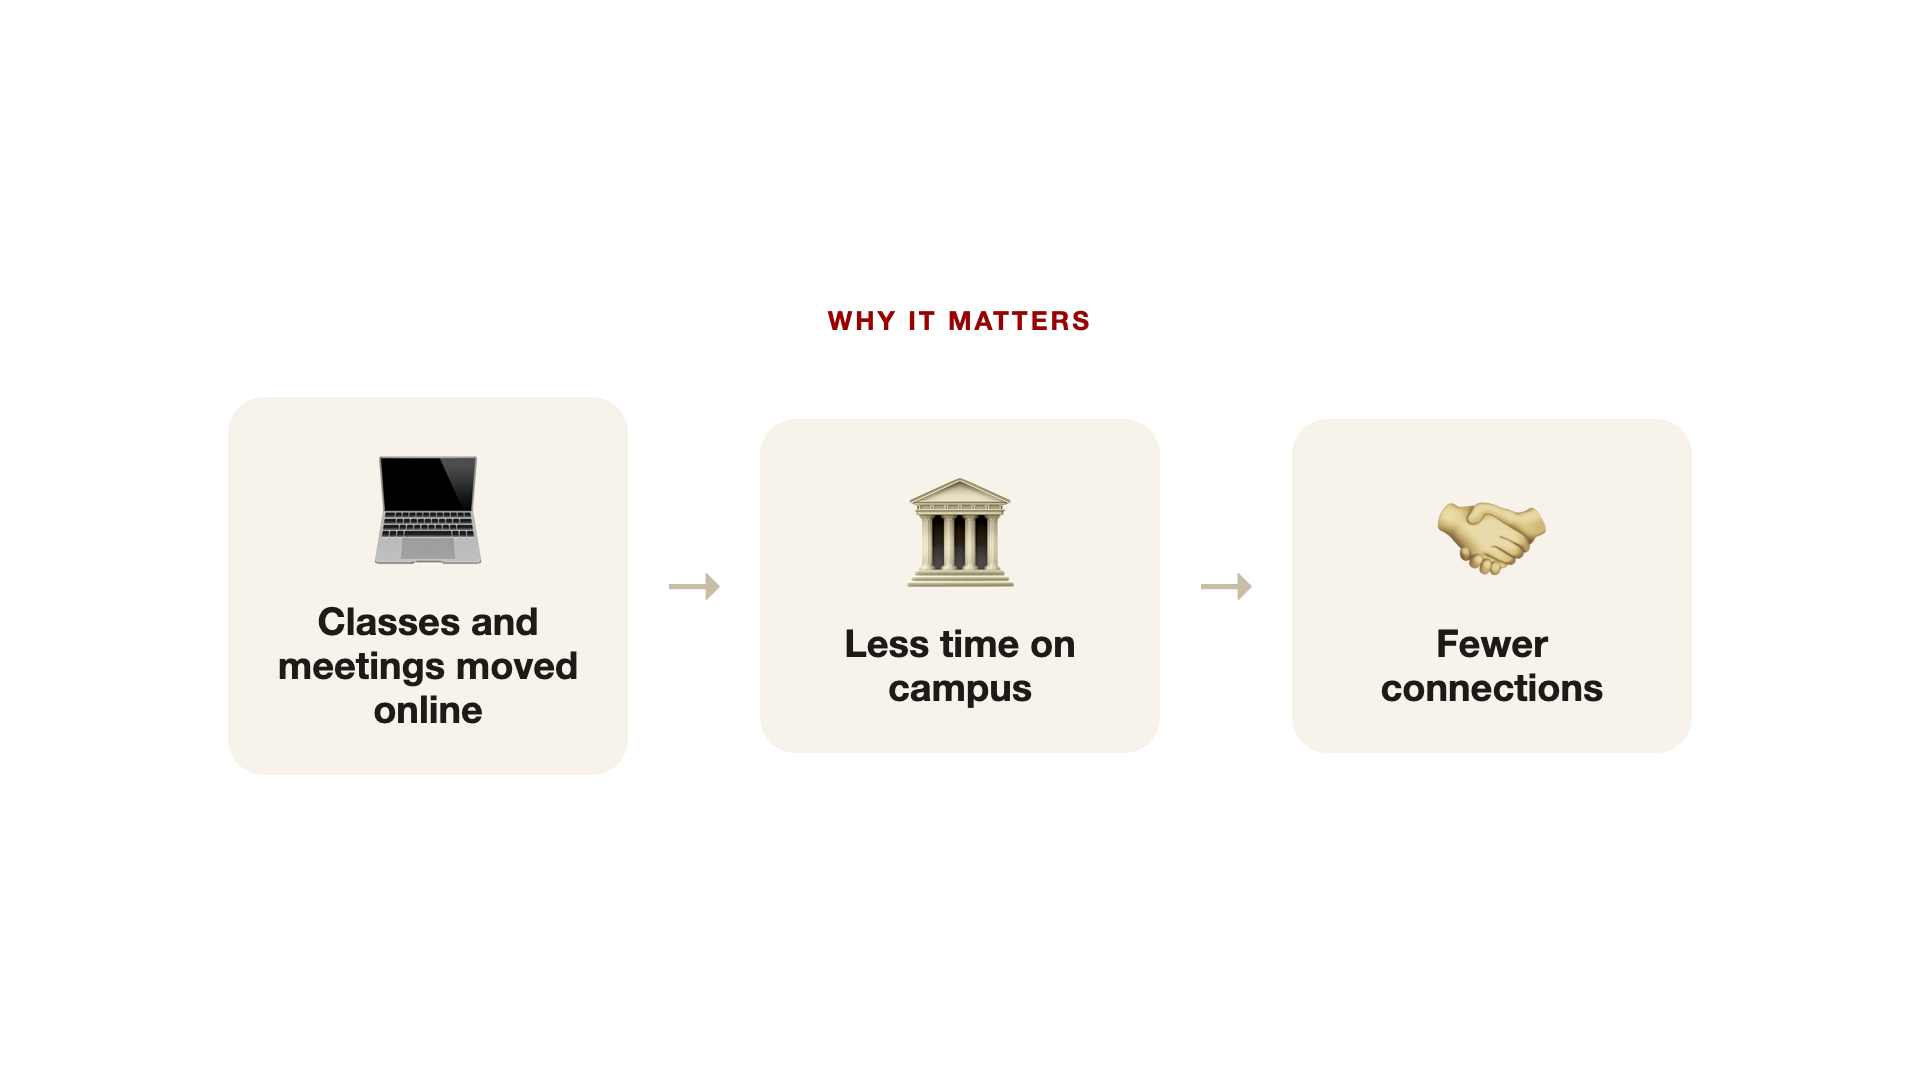
USC already has the ingredients for an incredible open world: recognizable landmarks, busy streets, student communities, and something happening almost everywhere. But discovering those experiences means jumping between EngageSC, the USC Events calendar, Handshake, Athletics, and club Instagram and LinkedIn pages.
The November event data I worked with contained 785 official listings, with 127 hiding their locations behind EngageSC sign-in. Even the sources disagreed: the university calendar and HackSC’s own post listed different end times for the very hackathon where I was building this project.
That became QuestSC, an interactive 3D campus companion that helps students discover what’s happening, plan their time, find campus resources, and explore USC together. I wanted the curiosity that keeps me exploring a game world to translate into discovering something on my actual campus.
What it does
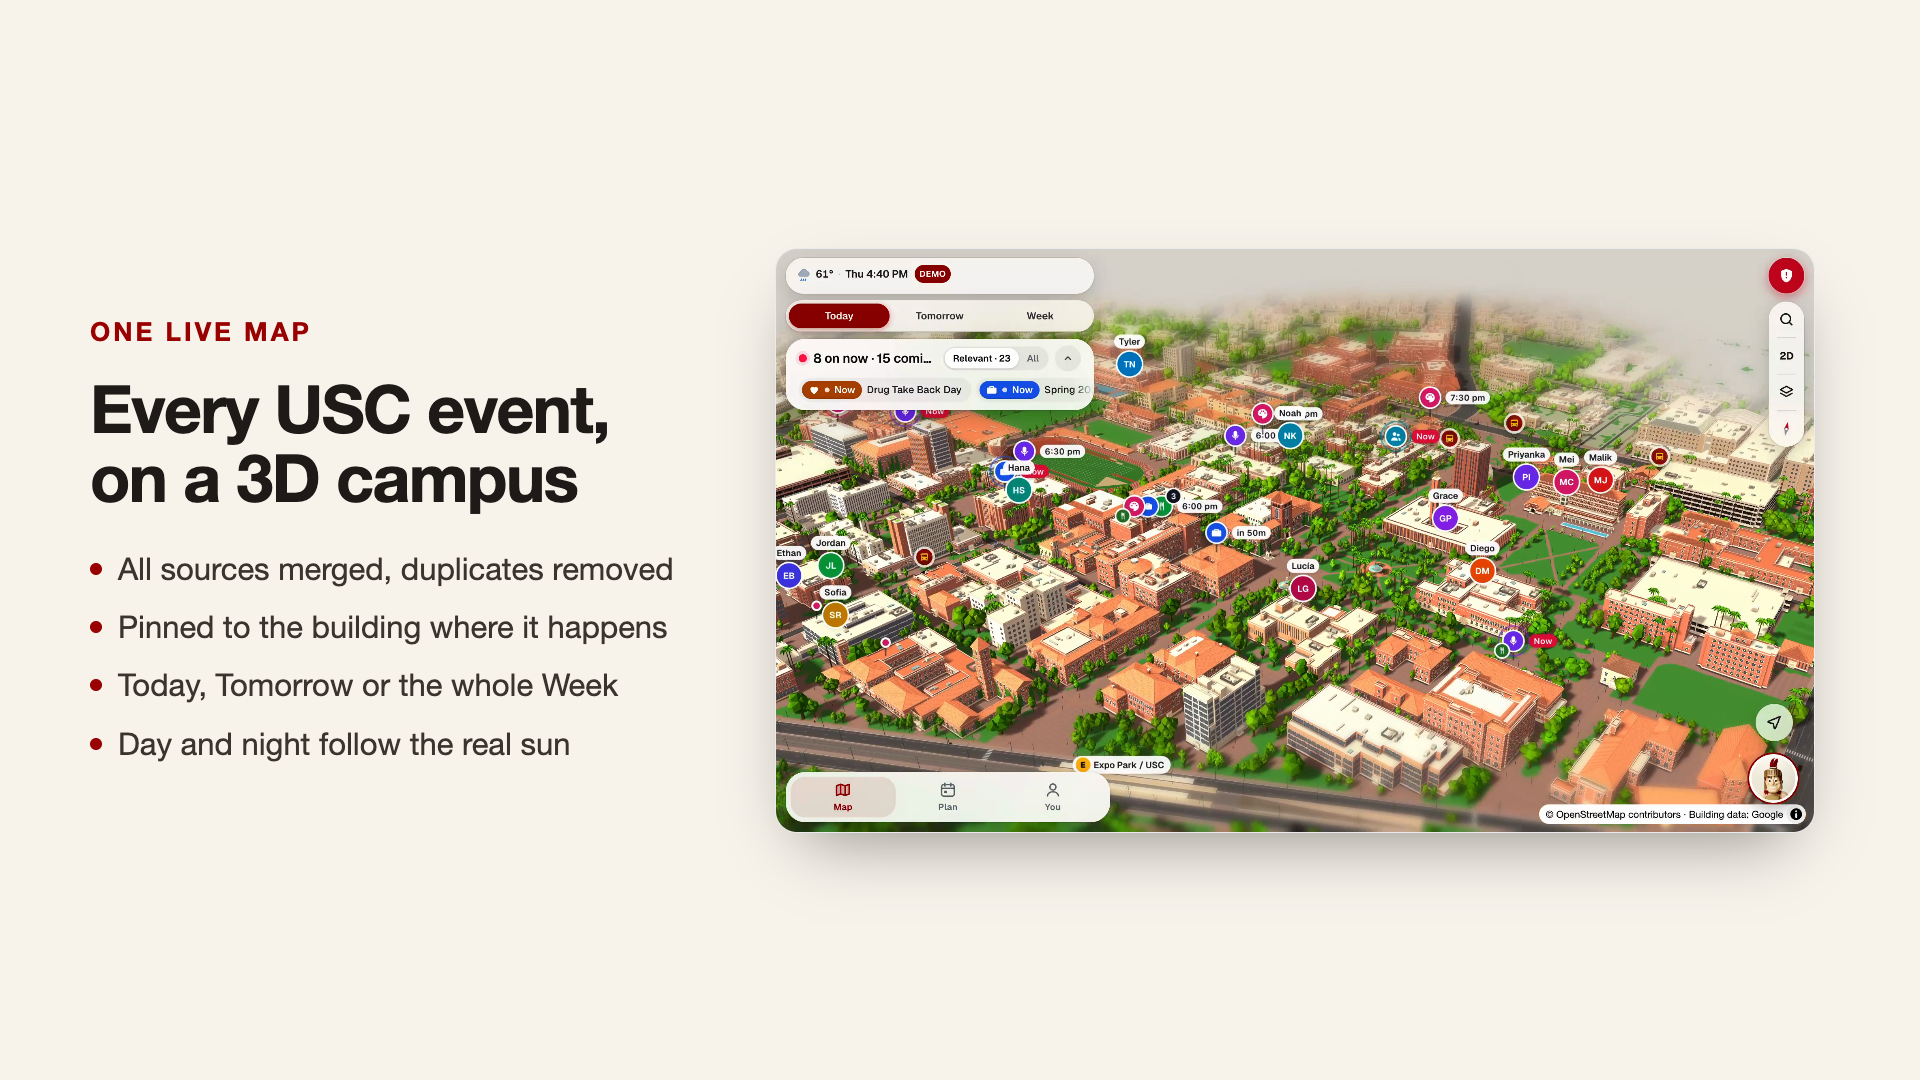
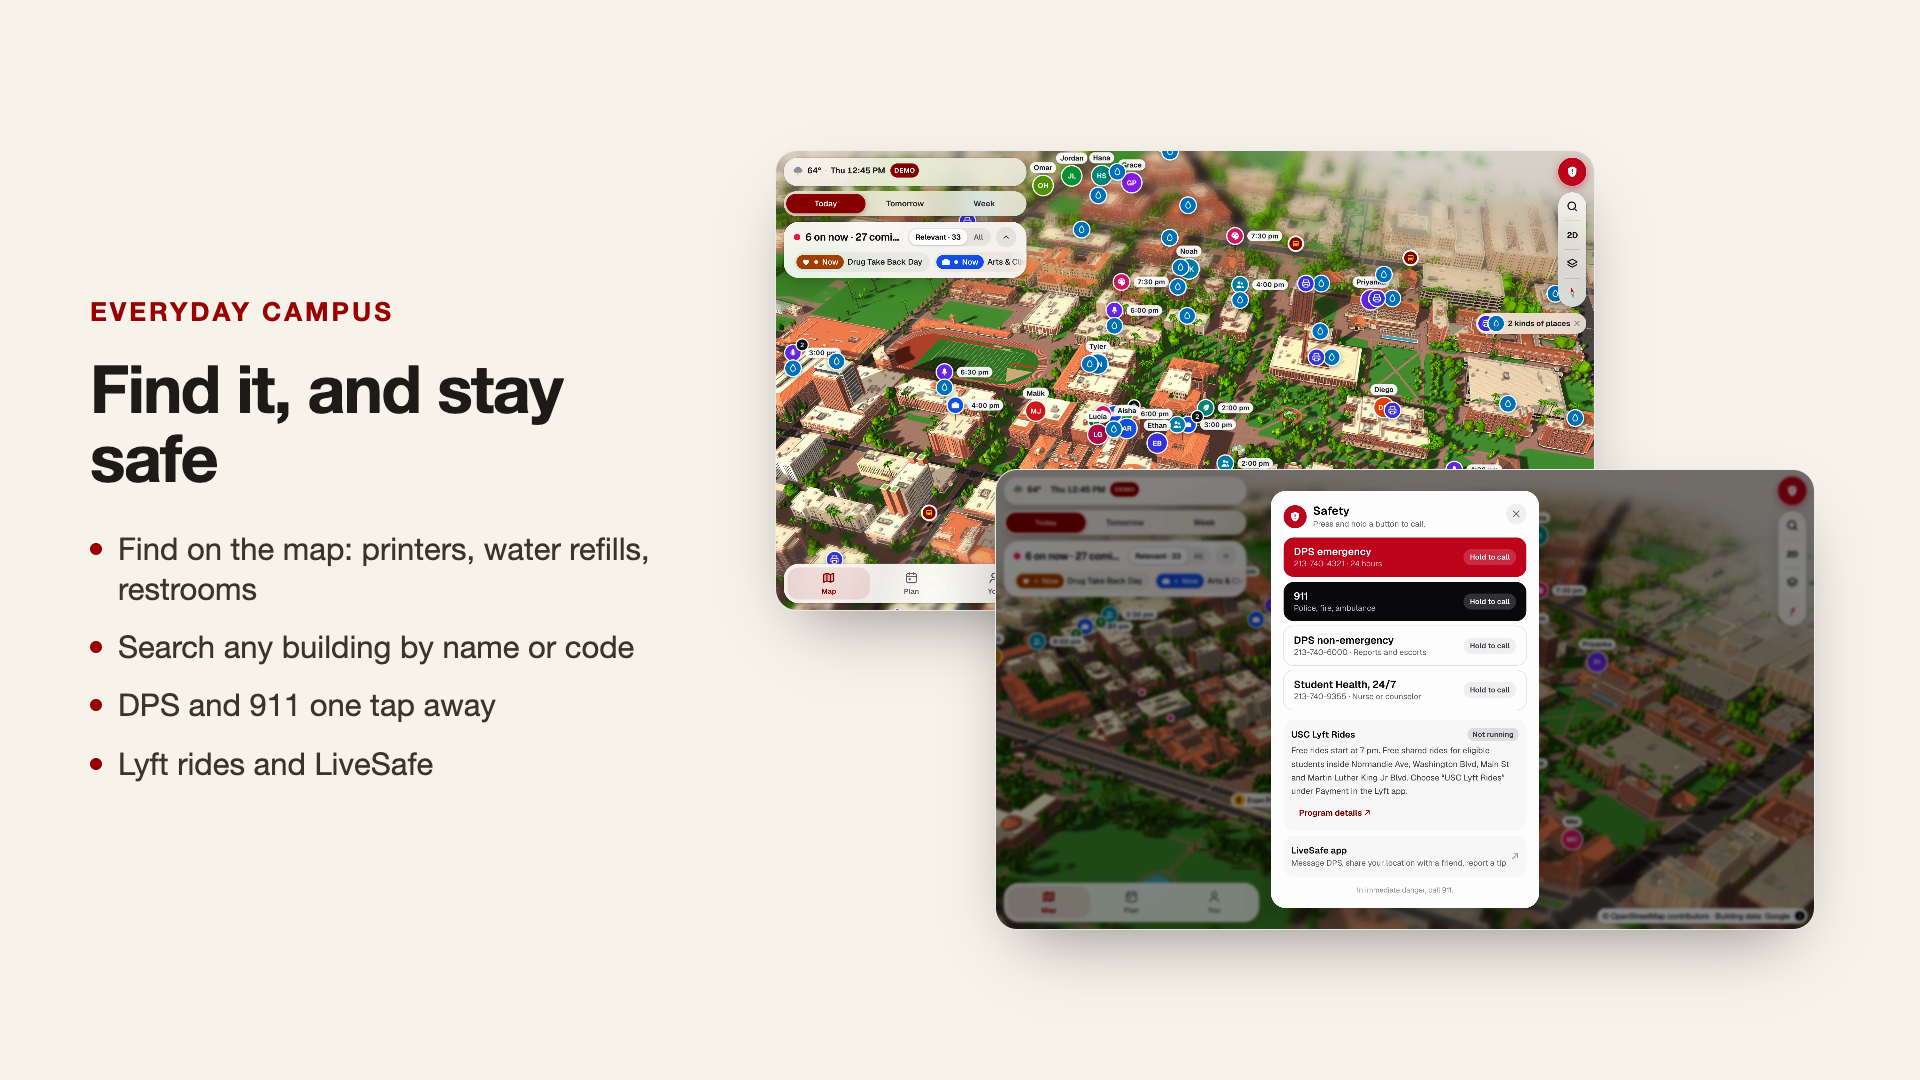
QuestSC turns University Park Campus into a stylized, interactive 3D world. Buildings, trees, pedestrians, traffic, shuttles, and trains bring the map to life. Lighting and shadows follow the time of day, taking campus from sunrise through golden hour into nighttime.
The map is also the interface: events appear where they happen, buildings reveal useful resources, and students can see how their plans connect across campus.
Discover events worth showing up for
QuestSC brings event listings from multiple sources into one map, removes duplicates, and lets students explore today, tomorrow, or the week. A free-food filter makes one particularly important student priority easy to find.
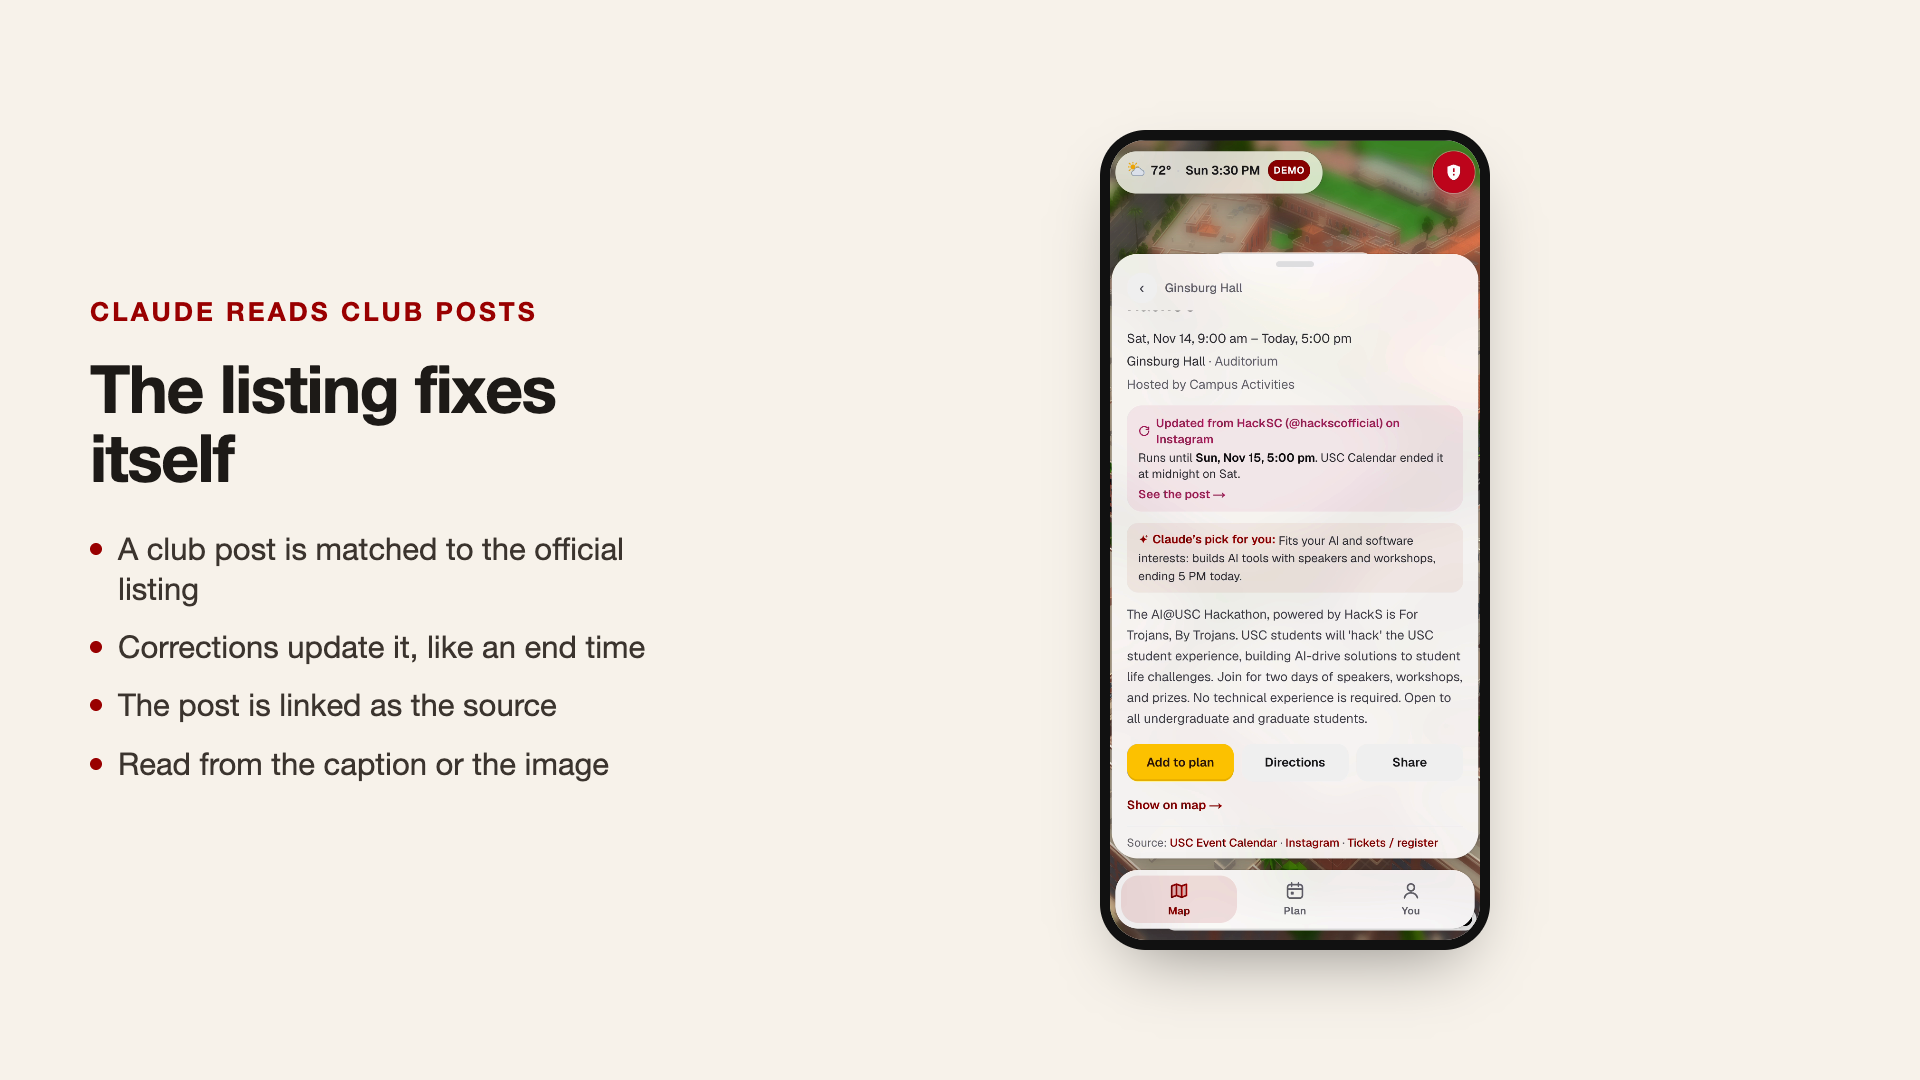
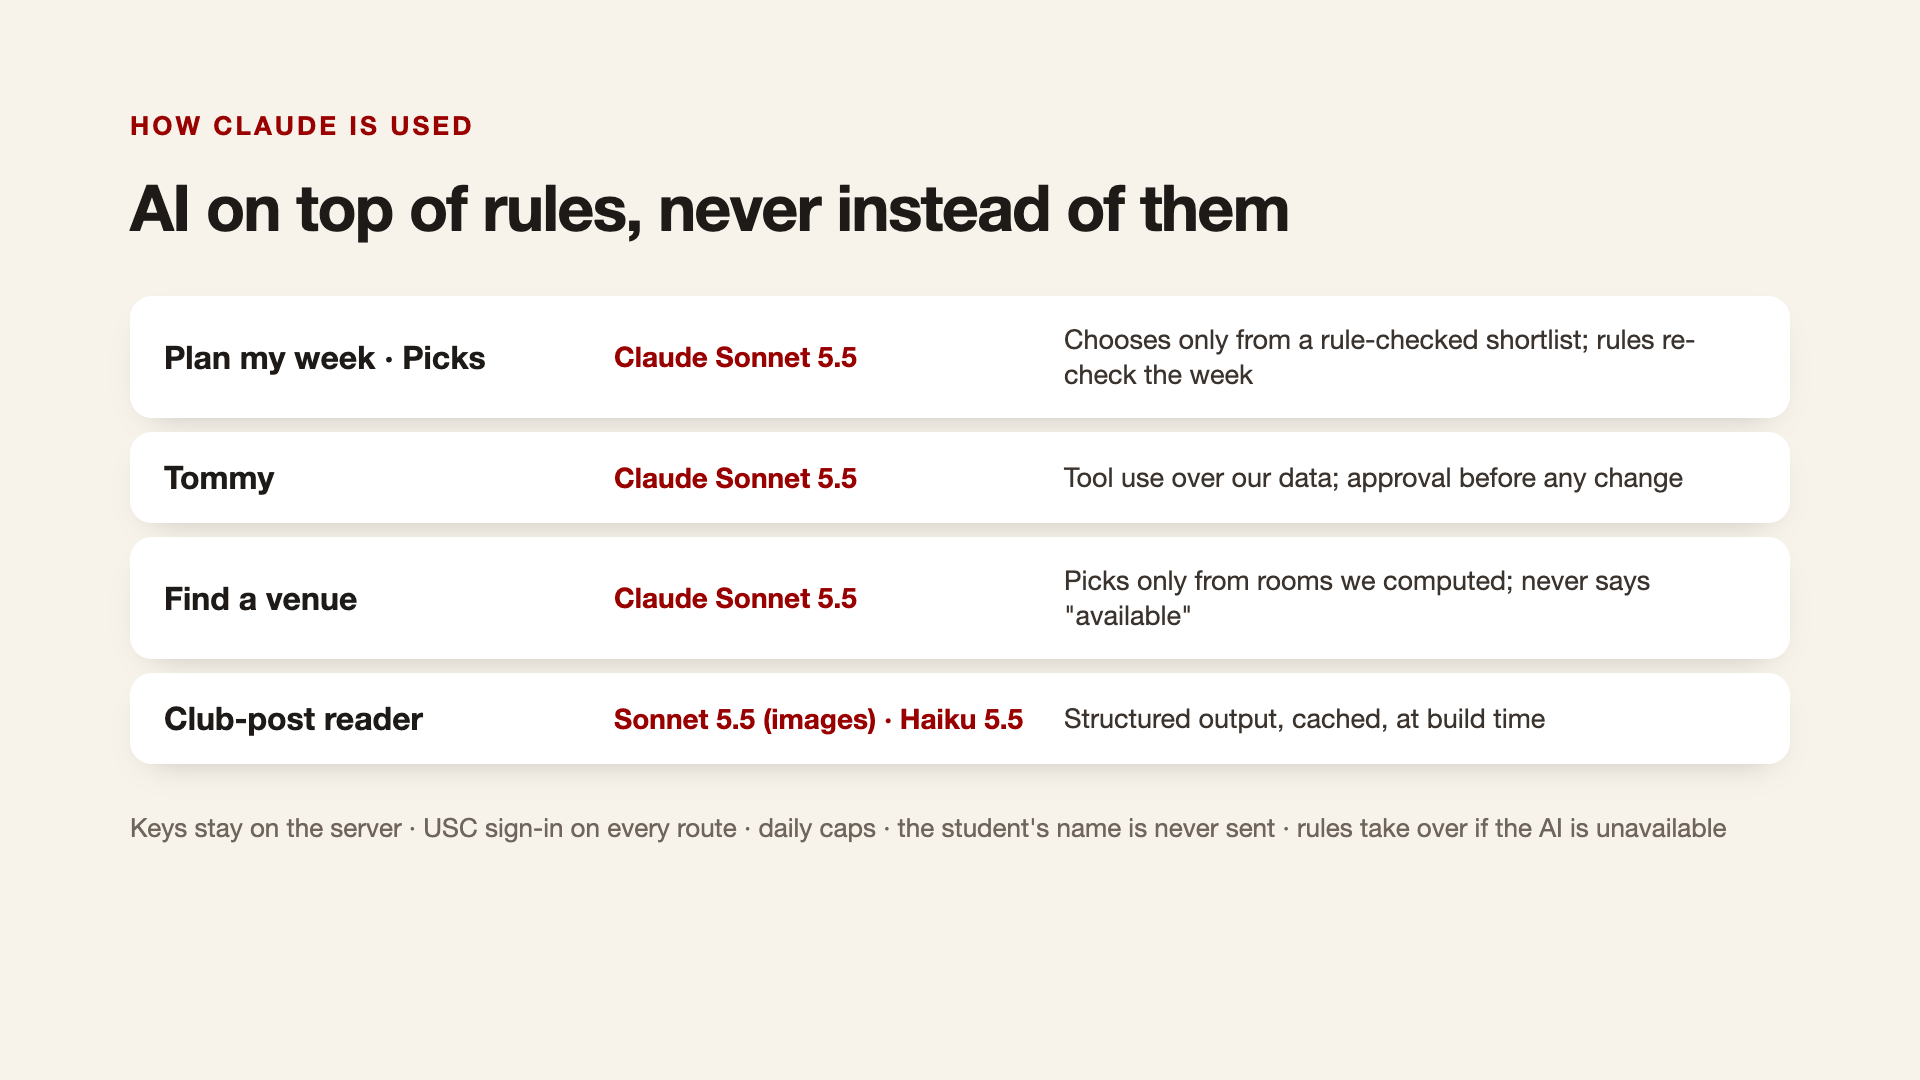
Claude reads club captions and event graphics, matches them to existing listings, and incorporates corrections with links back to their sources. Personalized recommendations consider students’ goals, interests, school, and courses, with a short explanation of why each event fits. Eligibility rules filter out events intended for other audiences.
Turn recommendations into a realistic week
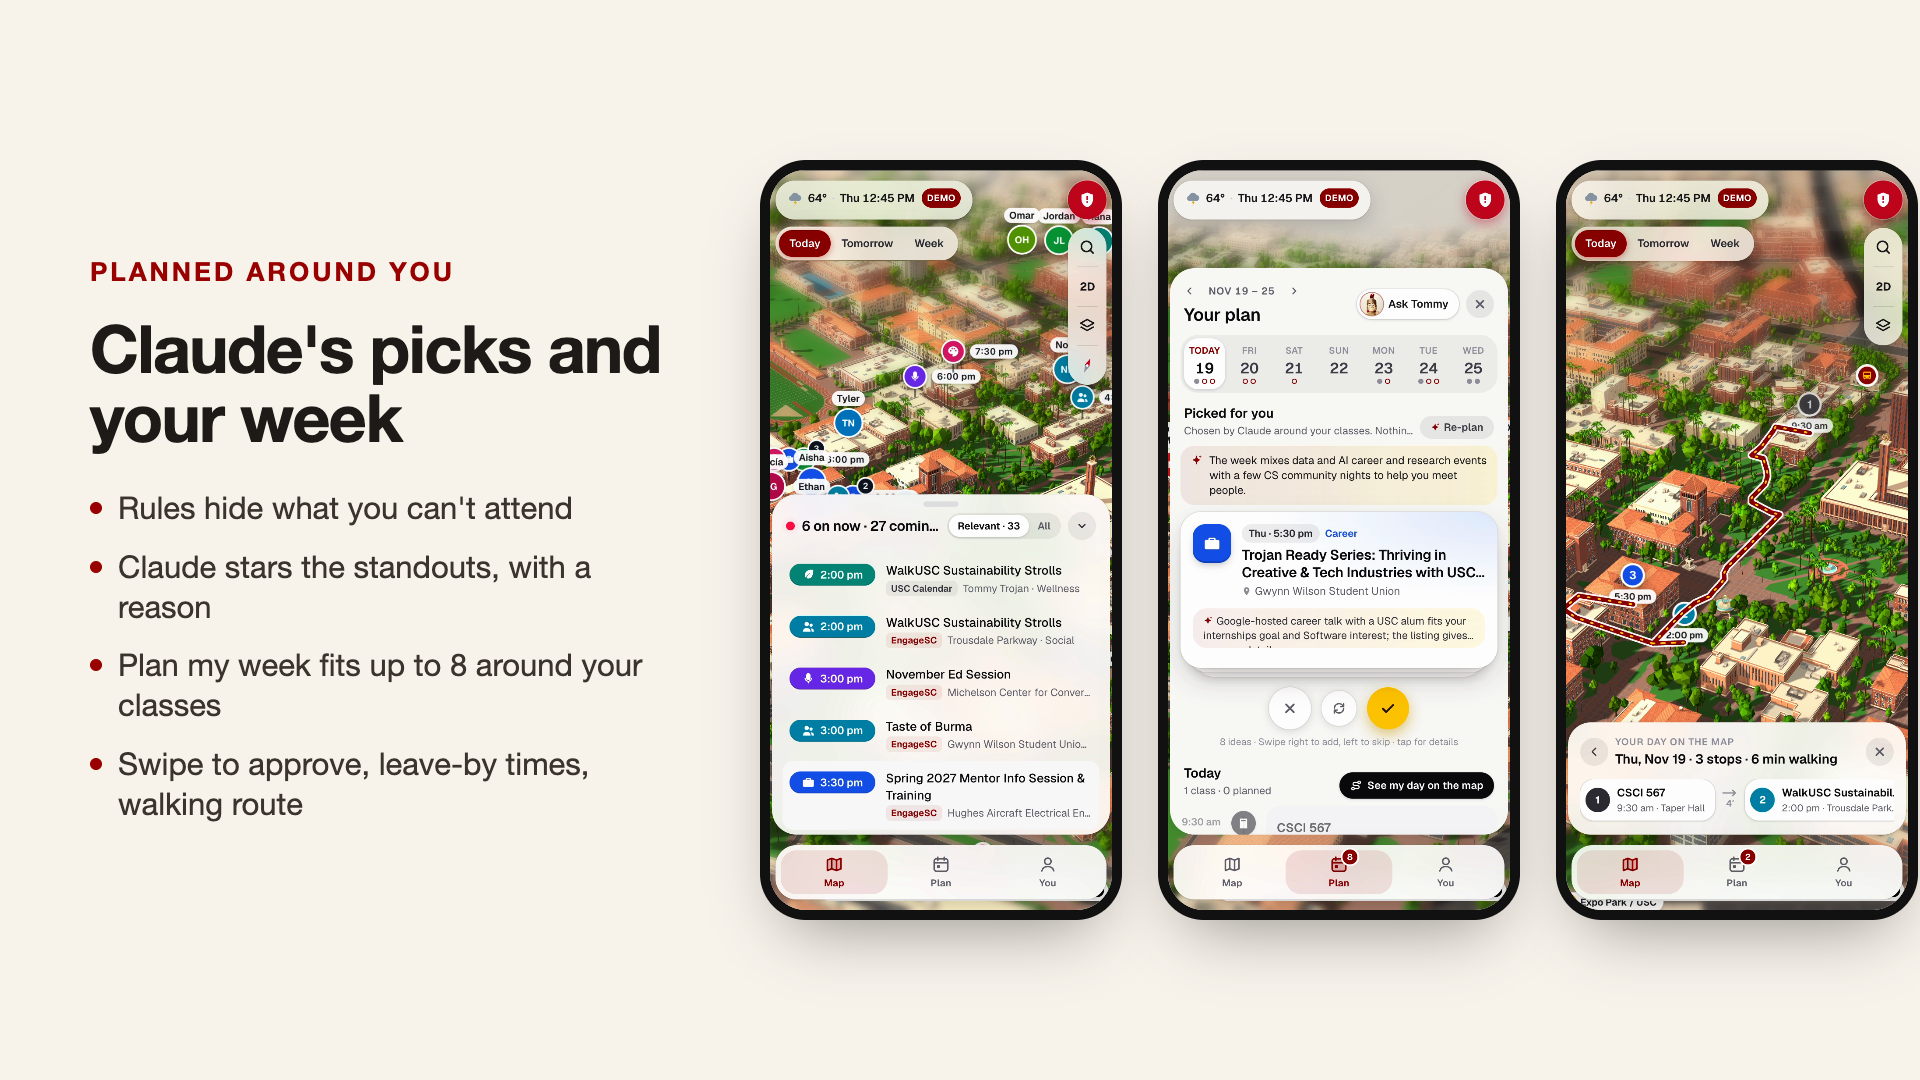
“Plan my week” suggests up to eight events around classes and imported calendar commitments. Students swipe through recommendations to approve, skip, or swap them, keeping control over what enters their schedule.
The planner also helps students:
- Find activities that fit gaps between commitments.
- View classes and accepted events in a daily timeline.
- See their day’s destinations and route on the map.
- Check walking estimates and leave-by times.
- Export their plan as an
.icsfile or add individual events to Google Calendar.
The prototype includes sample course schedules; students can import calendar commitments for planning around their own time.
Ask Tommy
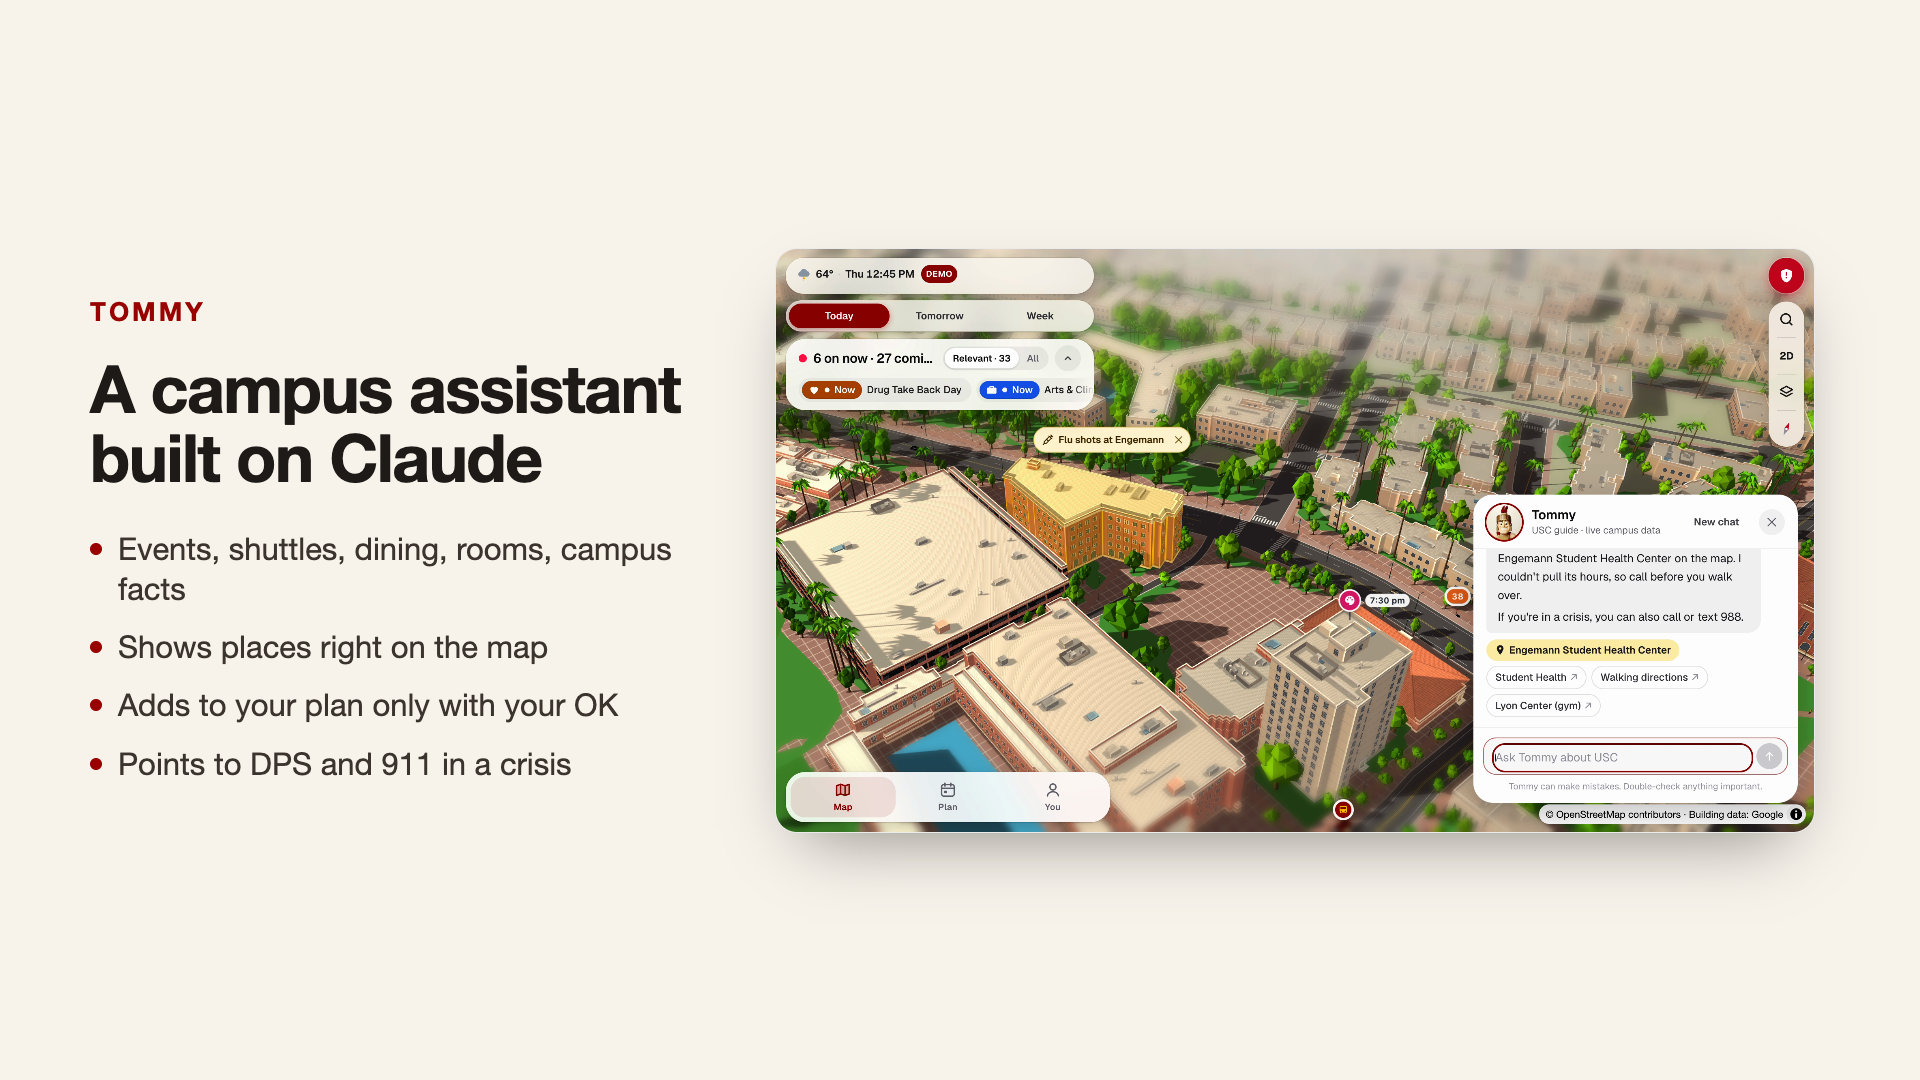
Tommy is a Claude-powered campus assistant connected to the app’s data and map. Students can ask about events, dining, libraries, study rooms, transit, and campus services.
Tommy retrieves changing information through tools, moves the map to relevant places, and provides useful source links. When a student wants to add an event to their plan, Tommy presents an approval card before making the change.
Find everyday campus essentials
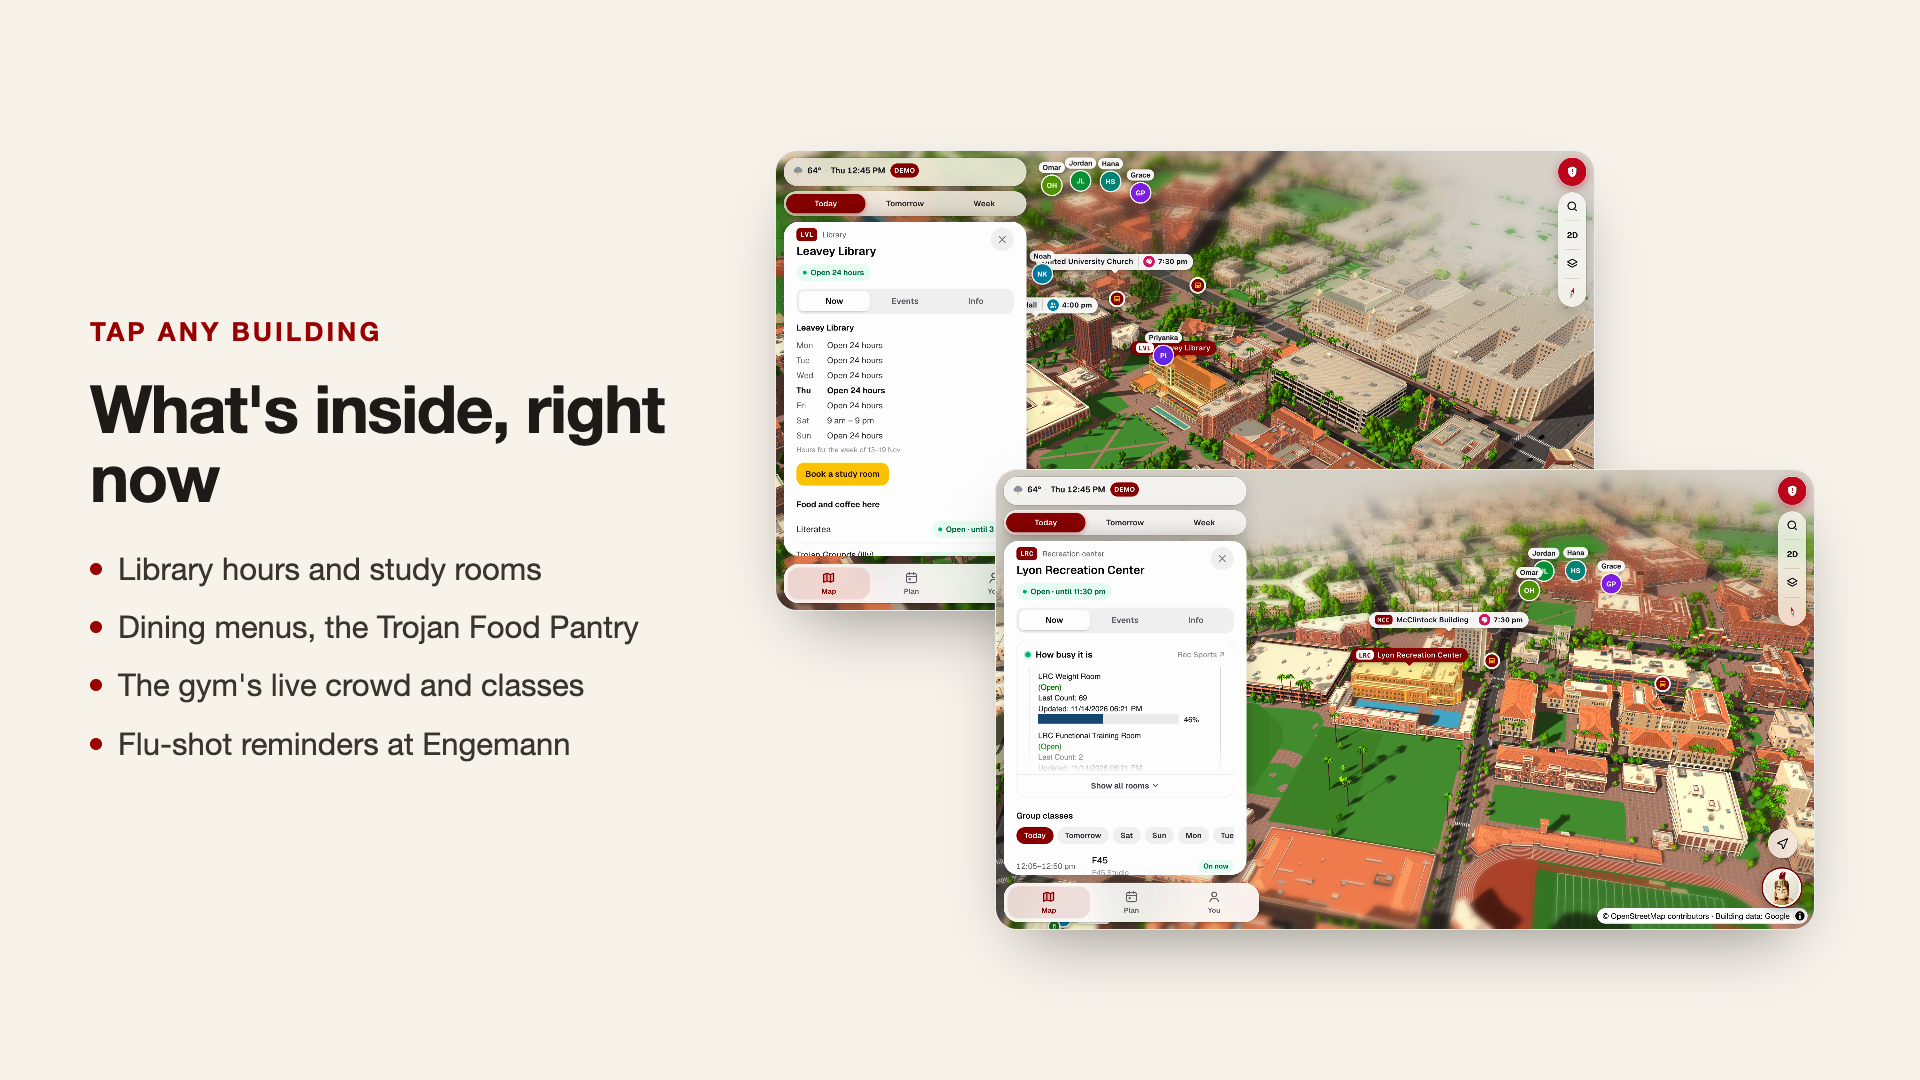
Building cards bring together information students would otherwise look up across several websites:
- Dining menus and dietary labels.
- Library hours and study resources.
- Trojan Food Pantry information.
- Gym crowd widgets and group fitness schedules.
- Student health resources and flu activity information.
- Shops, restaurants, and services within campus buildings.
Additional map layers help students locate printers, water refill stations, all-gender restrooms, lactation rooms, and bike repair stations. Sustainability layers highlight gardens, green buildings, EV charging, recycling, and other resources.
Get around and stay connected
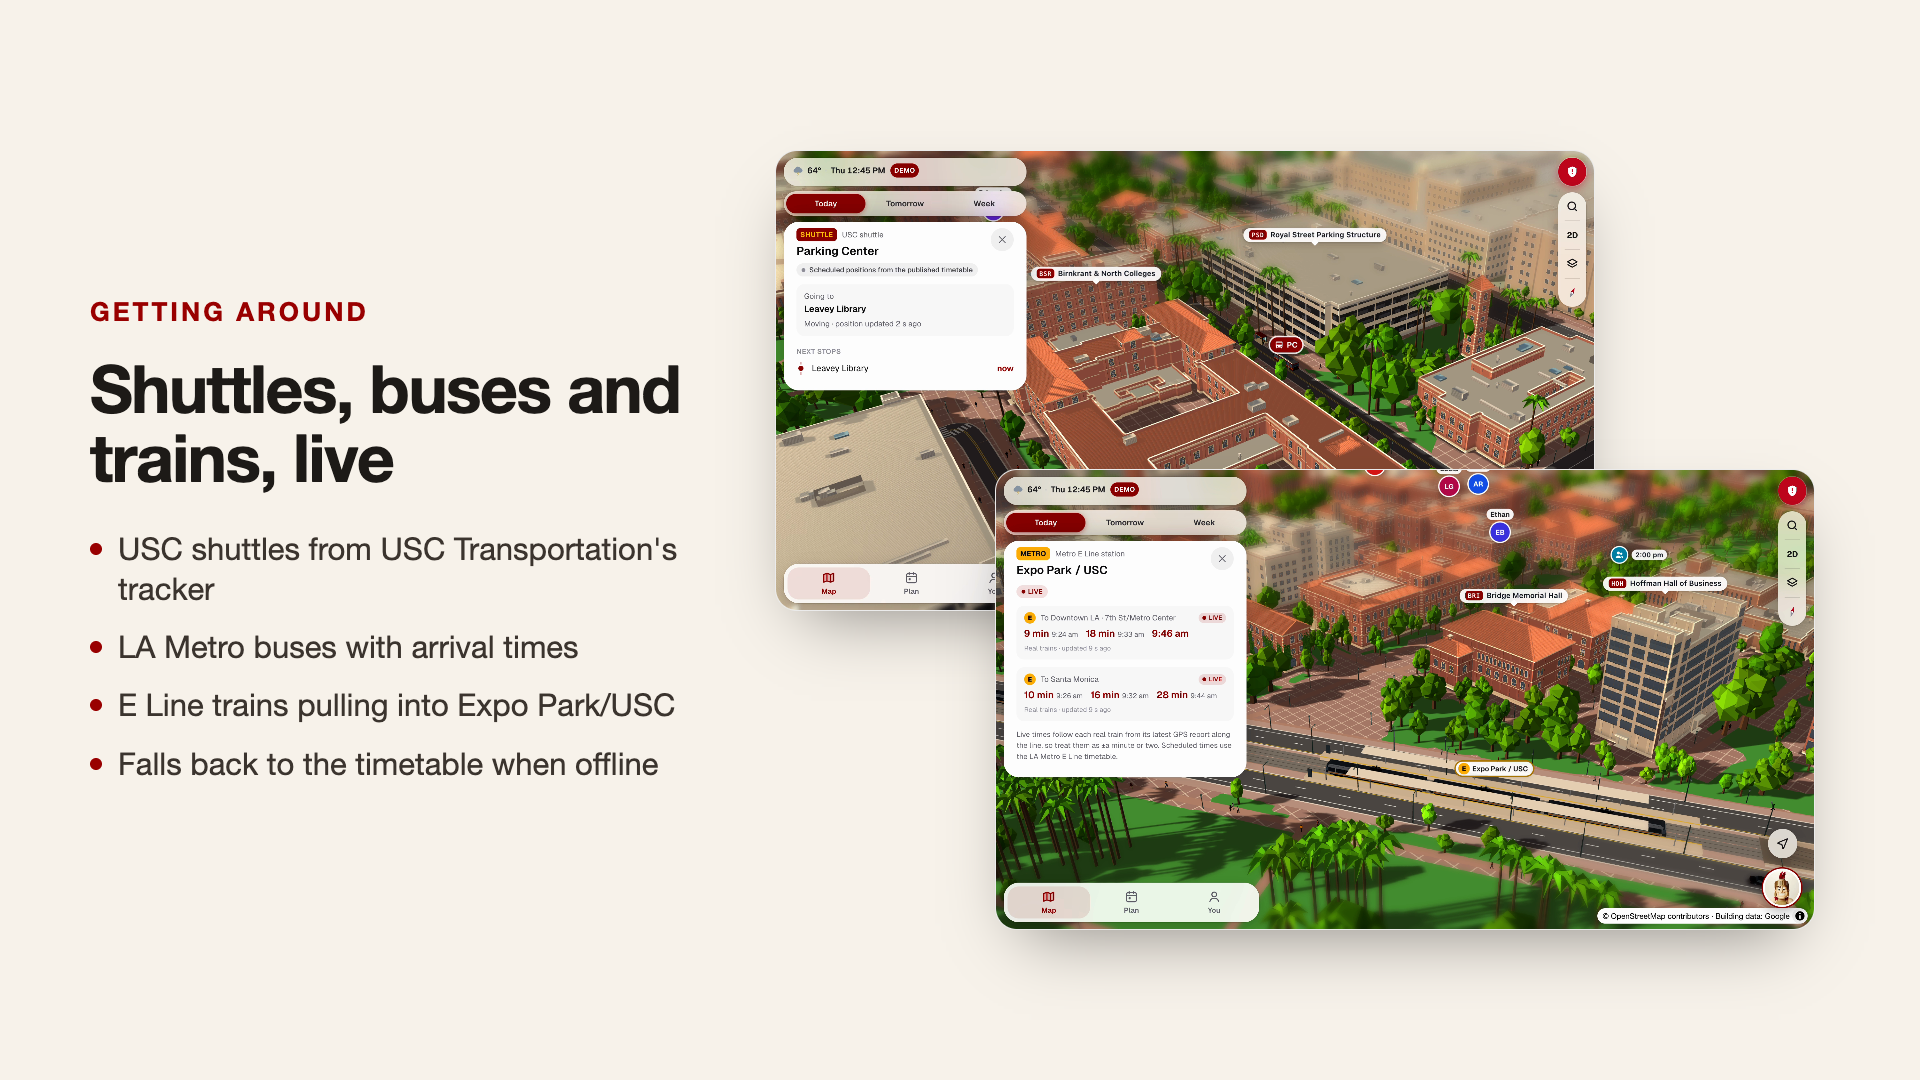
USC shuttle and LA Metro integrations bring transit information and arrival estimates onto the map, with timetable fallbacks where needed.
A dedicated safety panel provides press-and-hold calling for DPS and 911, USC Lyft Rides information, and access to LiveSafe.
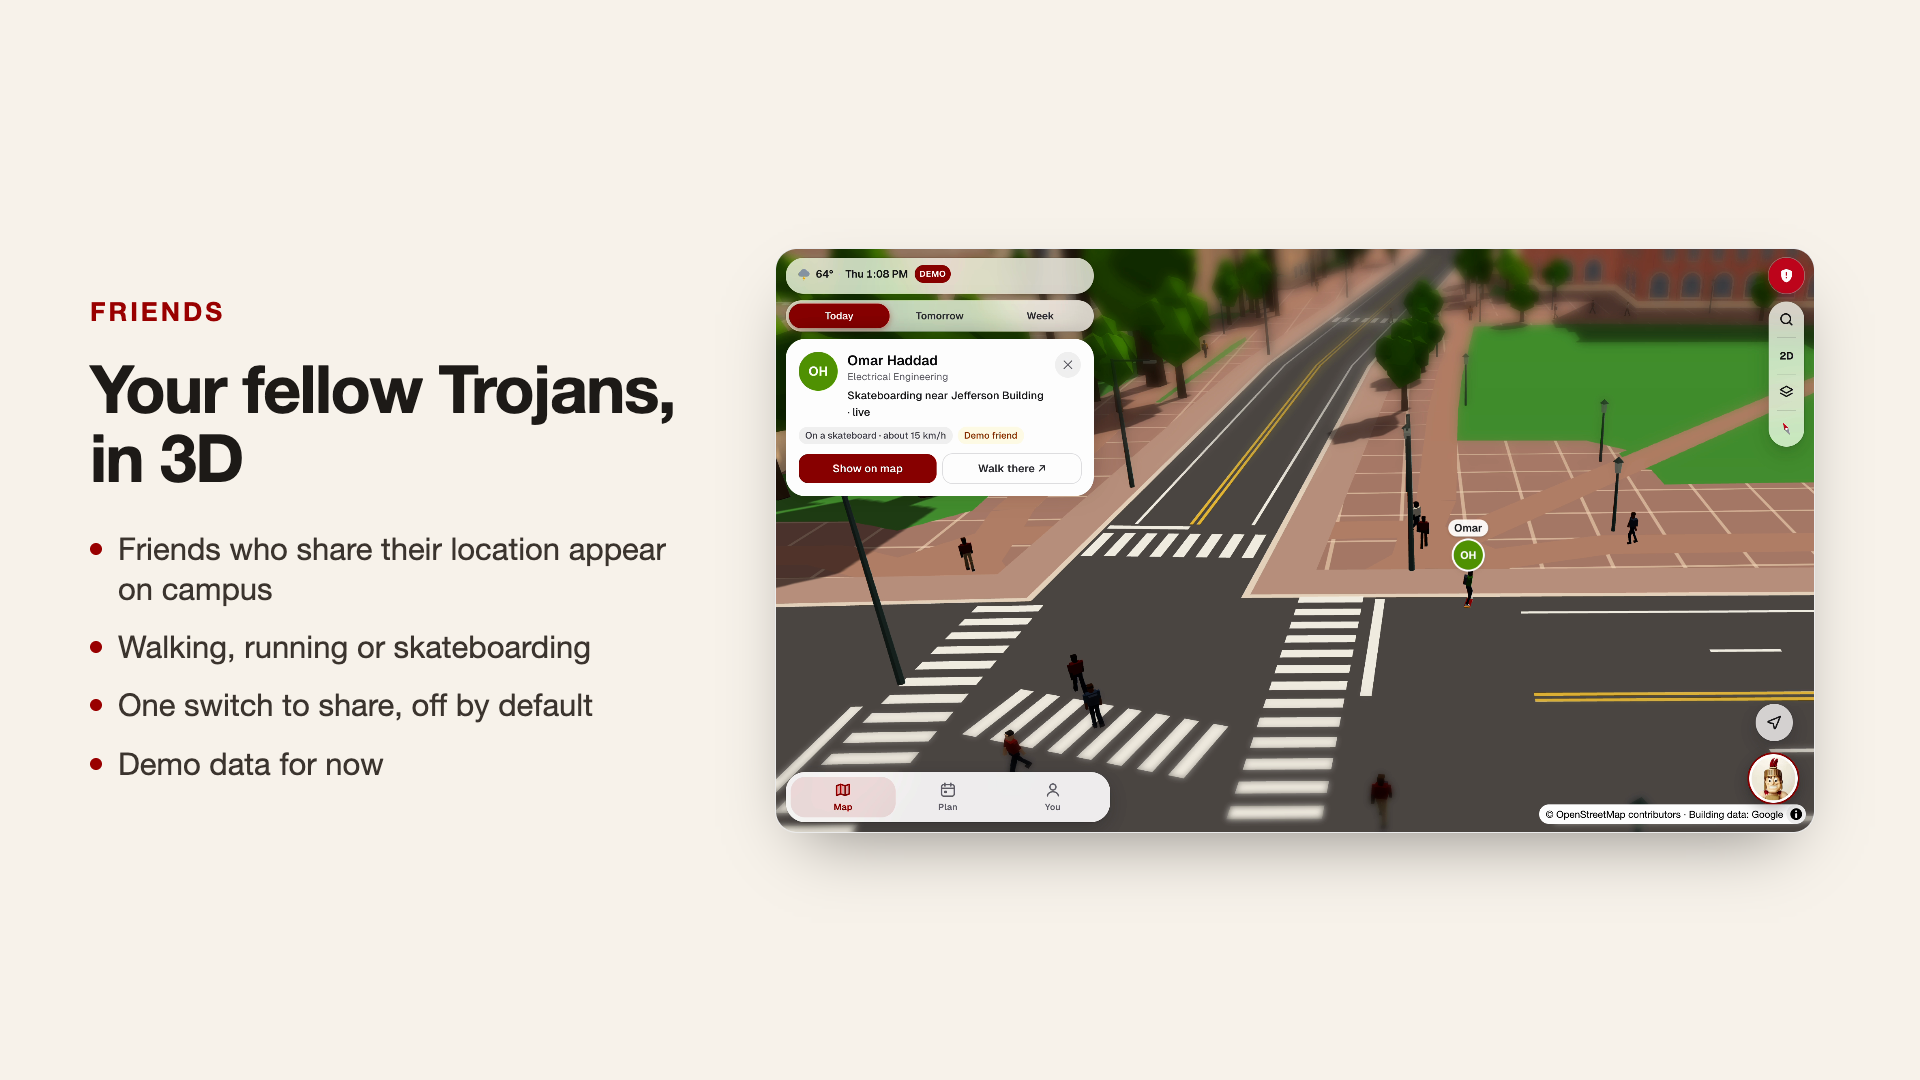
The prototype also demonstrates a social campus map: animated friends walk, run, and skateboard around USC, with controls designed for selective location sharing. Friend locations currently use seeded demo data, providing a preview of the opt-in social experience I want to build.
Help organizers find a venue
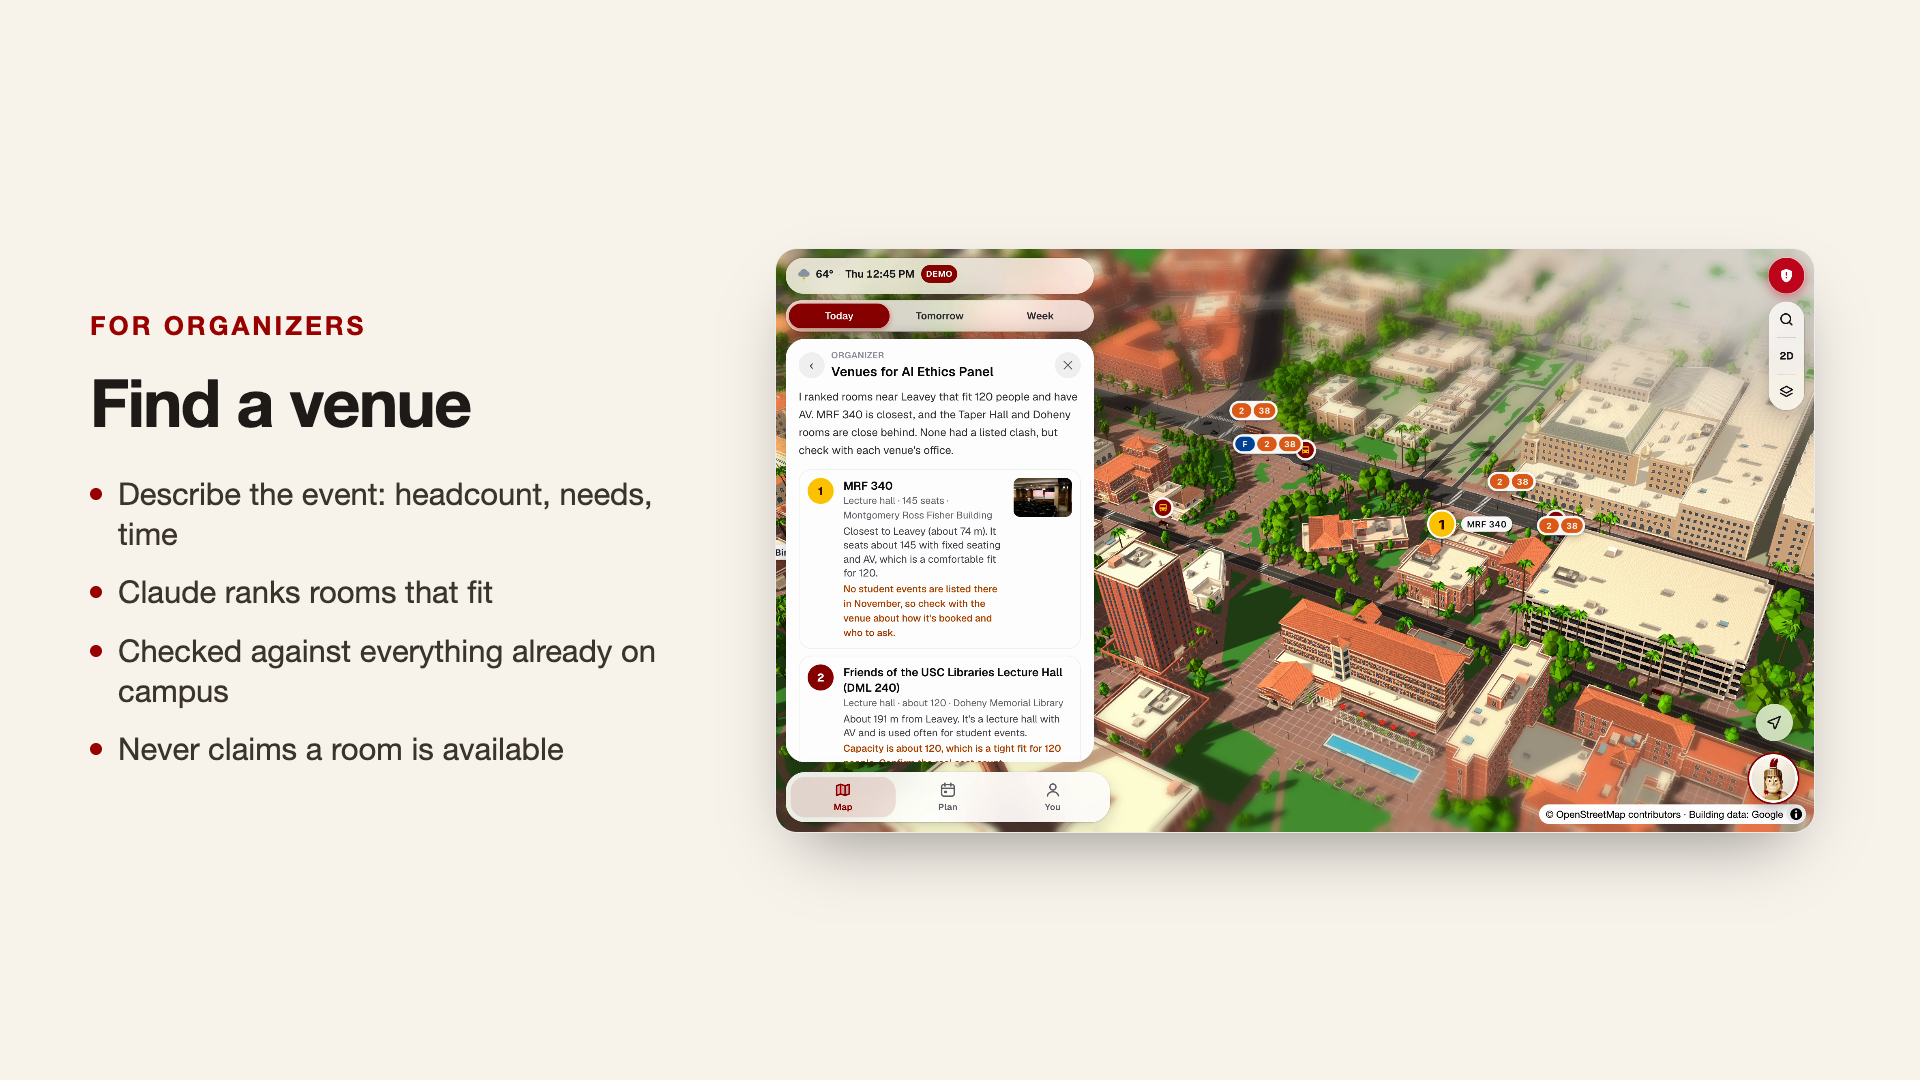
Student organizers can describe an event, expected attendance, timing, and requirements. QuestSC ranks suitable spaces, places them on the map, and flags conflicts with known events.
Suggestions include capacity, room features, reasons for the recommendation, and official links. They support venue discovery; booking availability still needs confirmation with the relevant office.
QuestSC is designed for phones, works in a browser, and is installable as a web app.
How I built it
I built QuestSC solo over one weekend using Next.js, React, TypeScript, Tailwind CSS, MapLibre GL, and Three.js, with deployment on Vercel.
MapLibre provides the geographic foundation, while a custom Three.js layer renders the stylized campus. Building footprints, heights, roof geometry, paths, landscaping, and moving objects turn geographic data into a world students can explore.
To create the buildings, I gathered public reference images and took many photos on my own phone. Claude and I worked together across multiple 3D modeling applications, experimenting with models, materials, and exports to create a consistent visual style.
The event pipeline merges sources into a shared snapshot, removes duplicates, and connects listings to campus locations. Claude handles tasks that benefit from interpretation: understanding club posts and graphics, choosing relevant events, explaining recommendations, answering campus questions, and ranking venue candidates.
One principle shaped the architecture: rules determine what is possible; AI helps decide what is worthwhile.
The planner checks eligibility and scheduling constraints before and after Claude makes its selections. Venue recommendations come from computed candidates. Tommy uses tools to retrieve changing information instead of guessing.
API keys stay on the server, AI routes require an authenticated USC session, and usage limits help control costs. Rule-based fallbacks keep core recommendations useful when AI is unavailable.
Challenges I ran into
The hardest part was building an interactive 3D USC that felt recognizable and ran smoothly in a browser.
Finding references was only the beginning. I used public images alongside photos taken on my own phone to understand building shapes, proportions, rooflines, and the spaces between them. Translating those references into models that looked consistent together took considerable experimentation.
My initial building models were too heavy, especially for phones. I shifted toward a low-poly artistic style, preserving recognizable shapes while reducing geometric complexity. That constraint helped define QuestSC’s cartoonish, game-inspired identity.
Claude and I iterated across multiple 3D modeling applications to produce models that looked good and worked within the interactive map. Balancing visual accuracy, a consistent style, and browser performance was the most demanding part of the project. I also used chunk culling, simpler distant objects, compressed geometry, and a pixel-ratio cap to reduce rendering load.
Another challenge was reconciling messy event information. Similar titles could describe different activities, while the same event could appear under different names. Important corrections sometimes existed only inside an Instagram graphic. I refined matching rules, used vision for image-based announcements, and made multi-day schedules explicit.
Making AI recommendations reliable required careful validation. An appealing suggestion only helps if the event exists, the student can attend it, and it fits their schedule. Structured outputs, constrained candidate lists, and checks after generation became essential parts of the system.
Even authentication introduced an unexpected problem: USC’s email scanner consumed magic sign-in links before students could use them. I switched to Google sign-in restricted to USC accounts.
Accomplishments that I’m proud of
I’m proud of bringing an interactive 3D campus, personalized planner, AI assistant, campus resources, and organizer tools together in one working experience over a single weekend.
I’m especially proud of the reliability demonstrated in my evaluations:
- 100% of Claude’s evaluated weekly event picks were events the student was eligible to attend.
- 100% of evaluated weekly plans passed the scheduling rules.
- 100% of evaluated venue suggestions accommodated the requested headcount and had no confirmed conflict in the available event data.
- 45 out of 45 evaluated club-post fields were extracted correctly.
- Tommy passed 5 out of 5 safety checks.
- 102 unit tests passed.
These results reflect the evaluated cases, with perfect scores on several key checks. Building explicit validation around Claude helped make its recommendations more dependable.
I’m also proud of the visual identity that emerged from the technical constraints. Moving to low-poly models made the project more practical to run and gave it the playful character that inspired it in the first place.
What I learned
I learned that a useful AI application depends heavily on the structure around the model: clean data, well-defined tools, explicit constraints, and thoughtful recovery when something fails. Evaluation helped me identify weaknesses that a polished demo alone could have hidden.
Building the campus taught me how closely visual design and engineering affect each other. A model can look excellent in a 3D editor and still be unsuitable for an interactive phone experience. Choosing what detail to preserve became as important as creating that detail.
I also learned how much spatial context changes discovery. An event becomes easier to act on when students can see its building, understand the travel time, and place it within their day. Bringing those pieces together helps turn “that sounds interesting” into “I can actually go.”
What’s next for QuestSC
My first priority is improving the campus itself. The hackathon timeline meant I couldn’t create a fully accurate, 1:1 recreation of USC. Several building models still need correction, and there are surface glitches and visual inconsistencies to fix. I want to revisit those areas with better references and refine the geometry and materials while preserving the low-poly style and mobile performance.
QuestSC currently focuses on University Park Campus (UPC). I want to expand it to Health Sciences Campus (HSC) and off-campus USC locations, including the Institute for Creative Technologies (ICT) and the Information Sciences Institute (ISI). That expansion would bring their buildings, events, resources, and transportation connections into the experience.
I also want to work with USC Student Government and Campus Activities on direct event-feed integrations, replace the seeded friend demo with real opt-in location sharing, and add reminders that help students follow through on their plans.
The experience I want to create is simple: a student opens QuestSC, discovers something they would otherwise have missed, and decides to go. Along the way, they can find friends to hang out with, catch the right shuttle, and explore more of what USC has to offer.
Built With
- anthropic-api
- claude
- claude-haiku
- claude-sonnet
- eta-spot
- google-oauth
- la-metro-api
- maplibre-gl
- national-weather-service-api
- next.js
- node.js
- openstreetmap
- pwa
- react
- tailwindcss
- three.js
- typescript
- vercel
- vitest
- webgl
- wikidata


