-
-
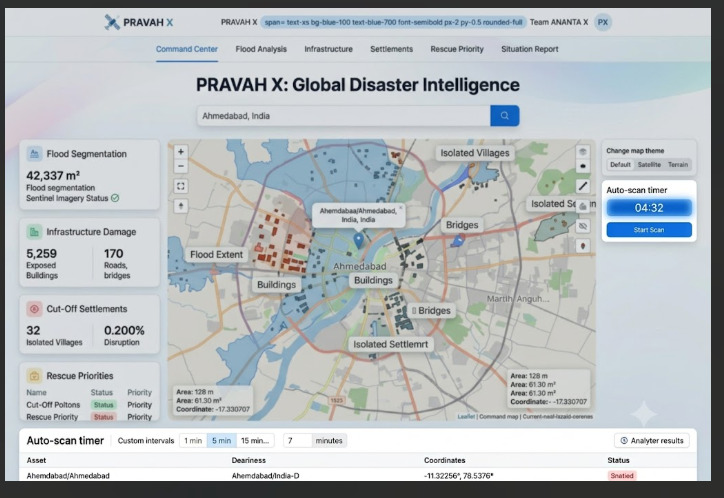
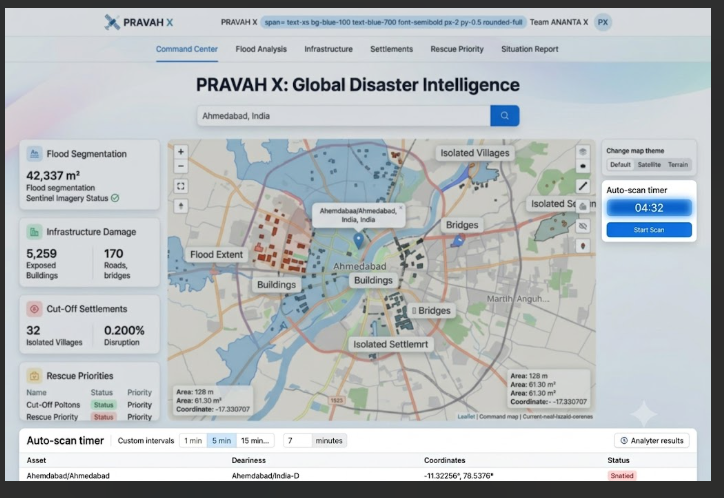
PRAVAH X Main Interface: Search and metrics dashboard for Ahmedabad. This is the primary landing view,
-
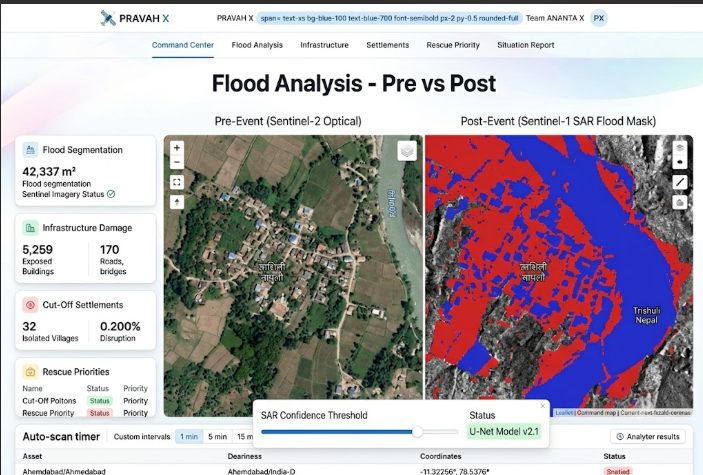
PRAVAH X Flood Analysis: Comparing Sentinel-2 Optical (Pre-Event) with Sentinel-1 SAR (Post-Event).
-
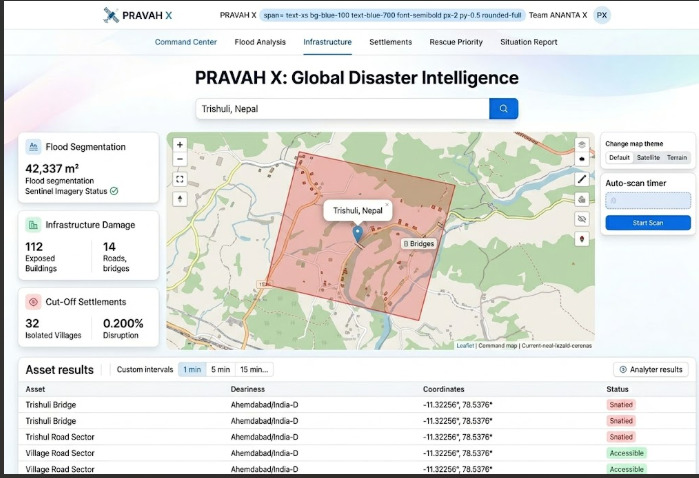
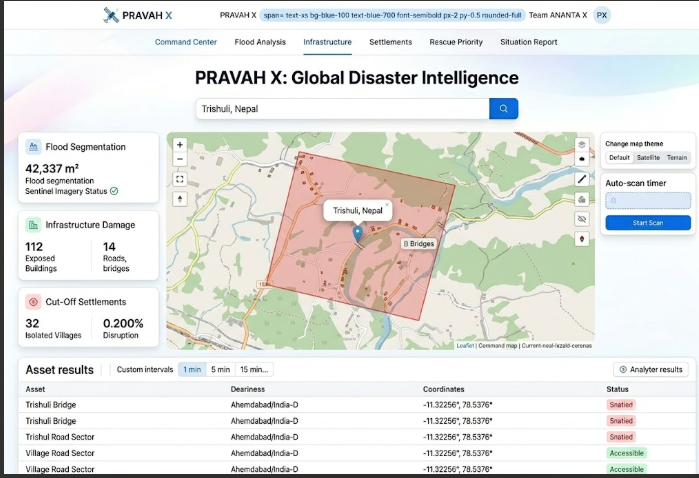
PRAVAH X Infrastructure View: OpenStreetMap bridge intersecting the SAR flood vector near Trishuli.
-
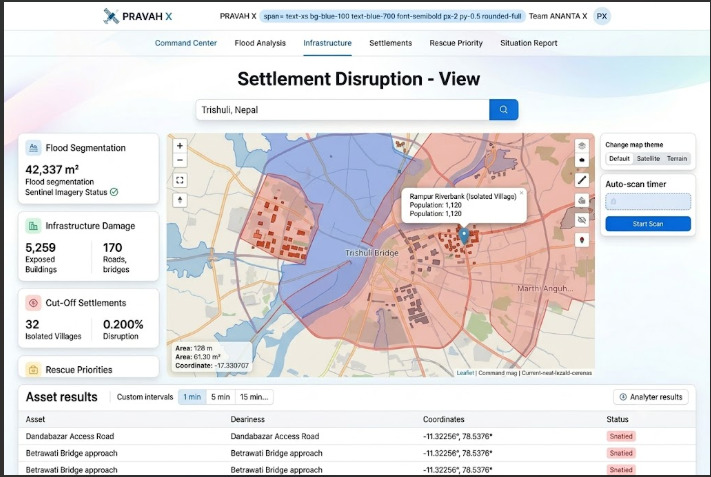
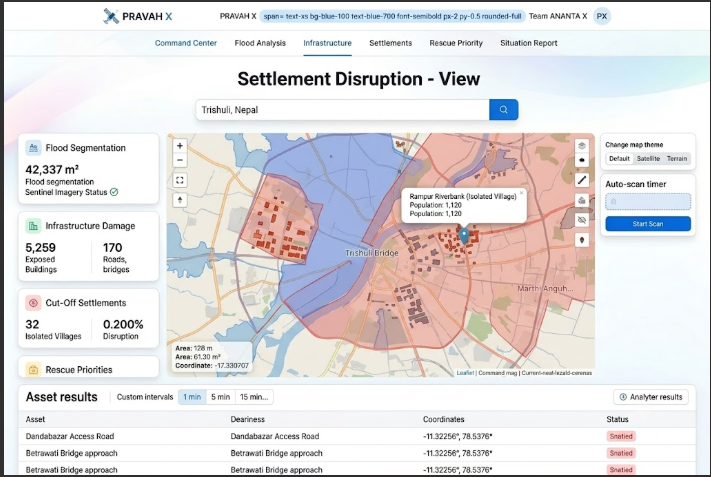
RAVAH X Settlement View: Topological graph analysis showing a village near Trishuli with severed road access.
-
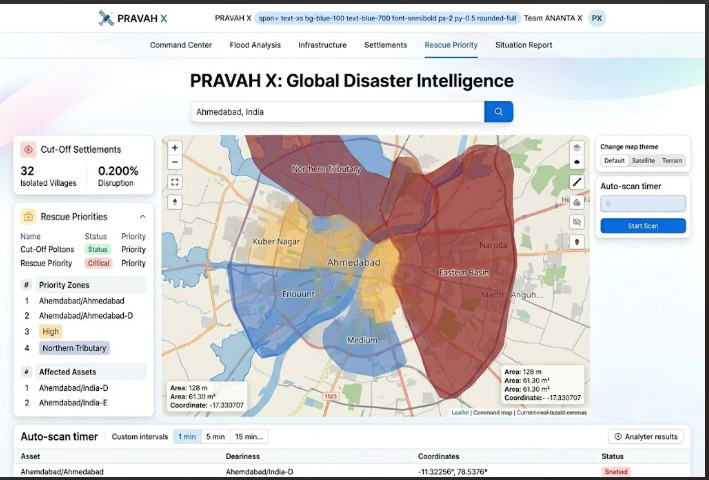
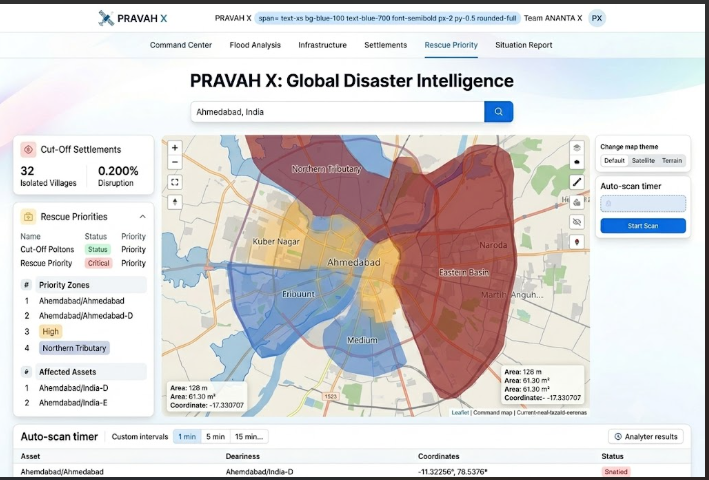
PRAVAH X Rescue Priority View: Ranking Ahmedabad neighborhoods by flood exposure and isolation.
-
PRAVAH X System View: Managing the autonomous Sentinel scan engine and countdown timer.
-
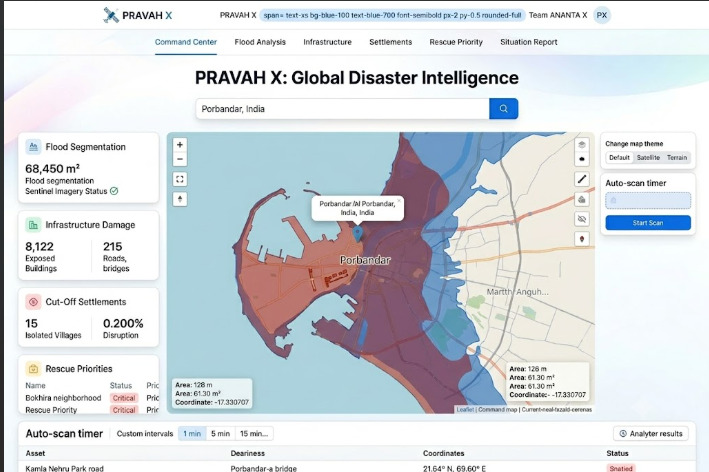
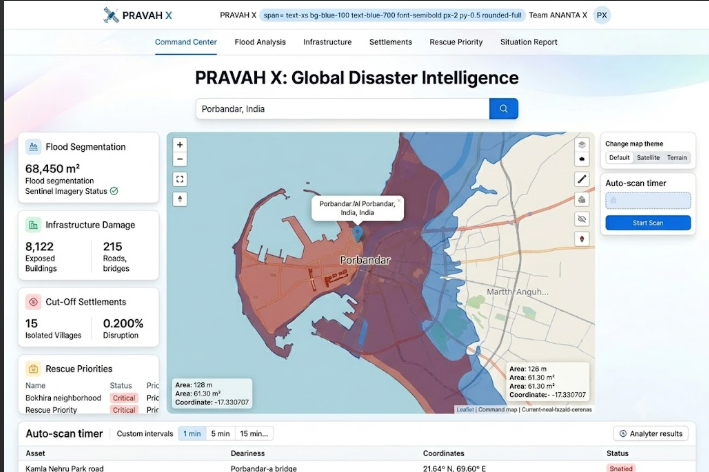
PRAVAH X Regional View: Assessing flood risk in Porbandar, India. This image demonstrates the global search and scalability
-
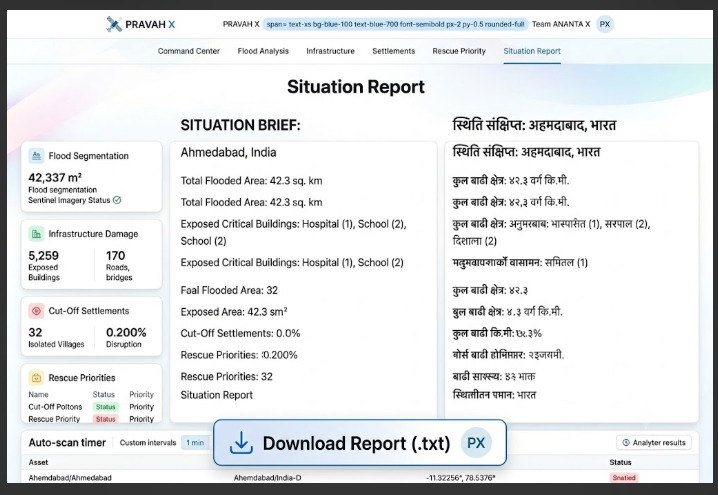
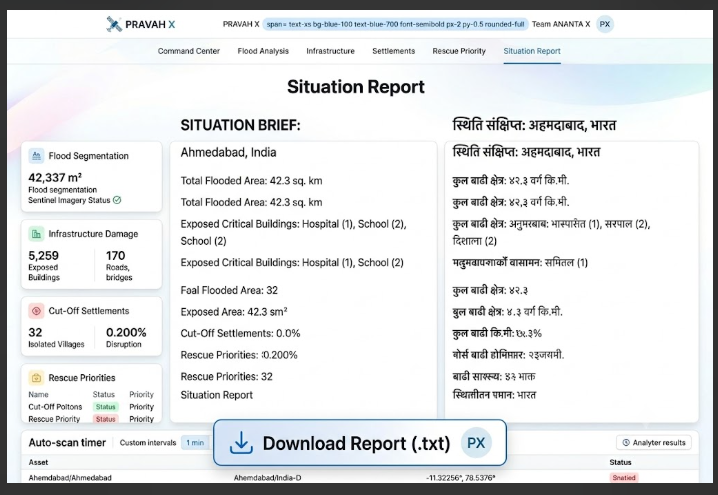
PRAVAH X Report View: Generating and downloading a bilingual Situation Brief (English/Nepali).
-
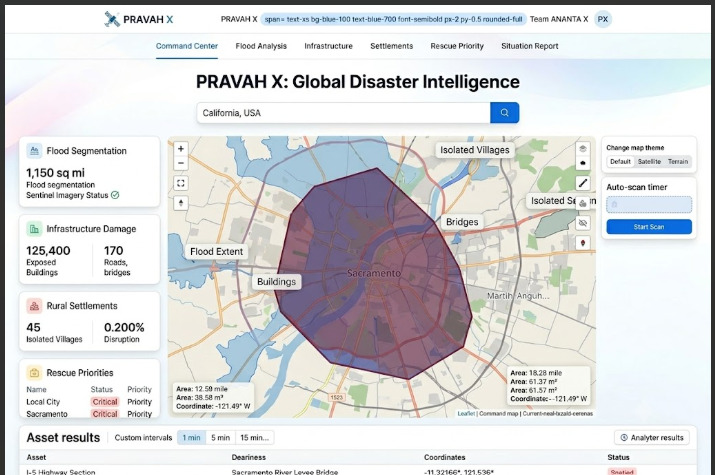
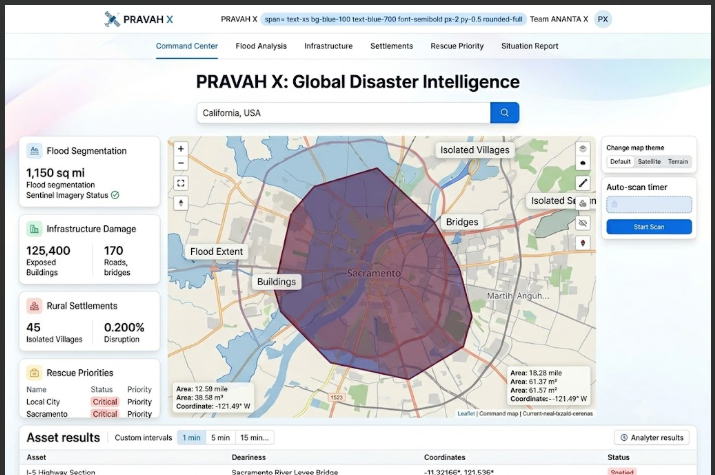
PRAVAH X Scalability View: Analyzing a custom defined region in California, USA. This image demonstrates the custom drawing tools.
-
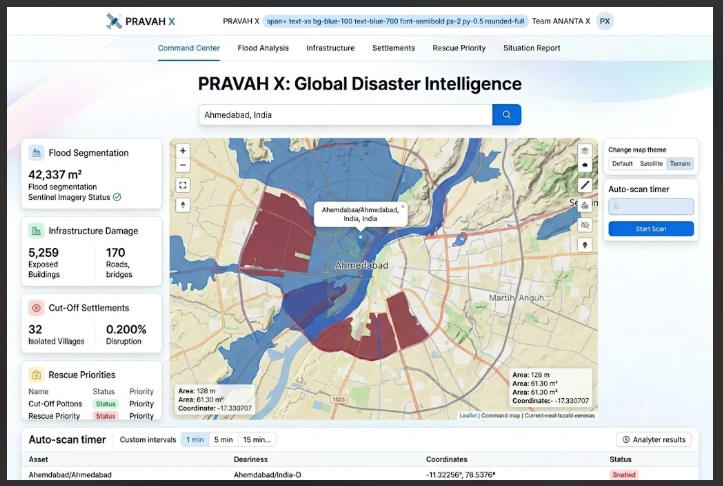
PRAVAH X Map View: Displaying flood overlays against the Terrain/Topography basemap.
-
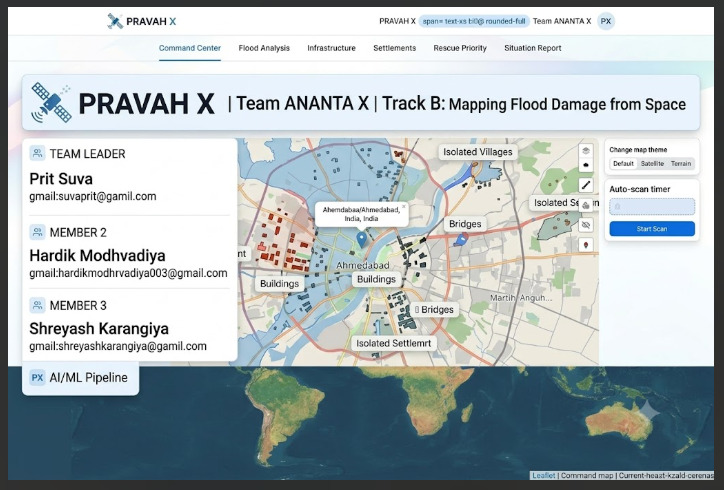
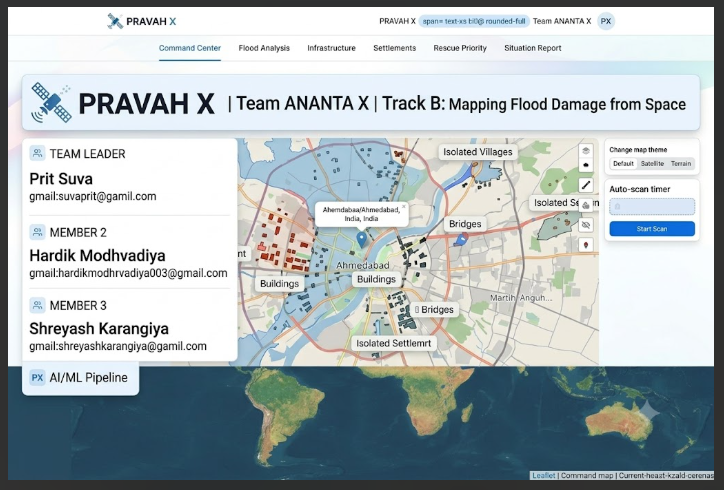
PRAVAH X Project View: Team ANANTAX credits and hackathon Track B credentials. This image highlights the human element and project identity.
-
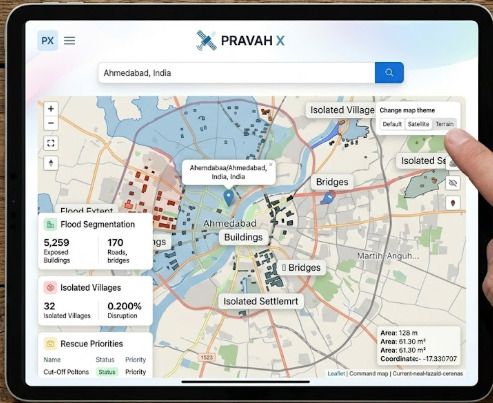
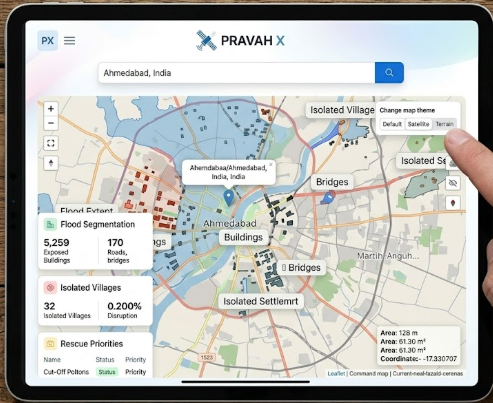
PRAVAH X Scalability View: Fully responsive dashboard optimized for mobile tablets. This image demonstrates scalability and field use
-
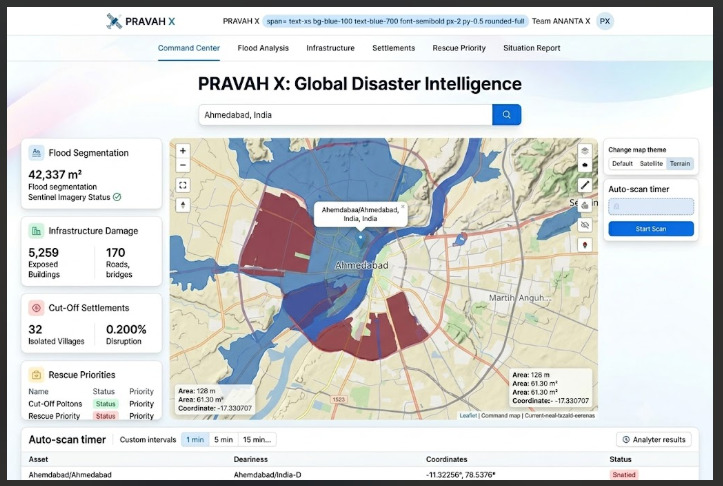
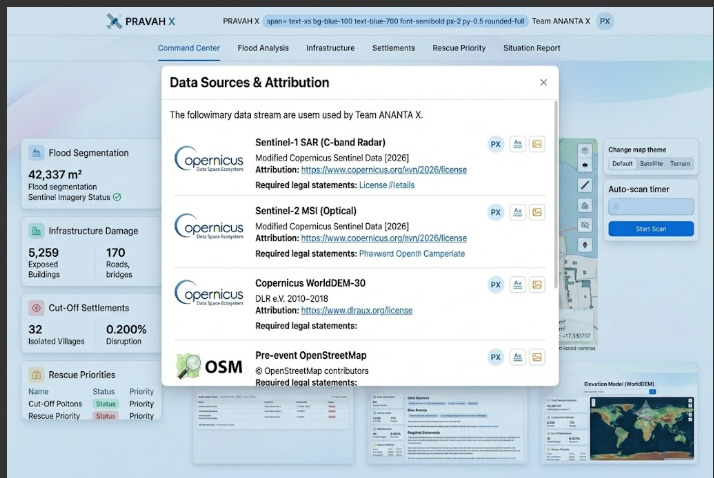
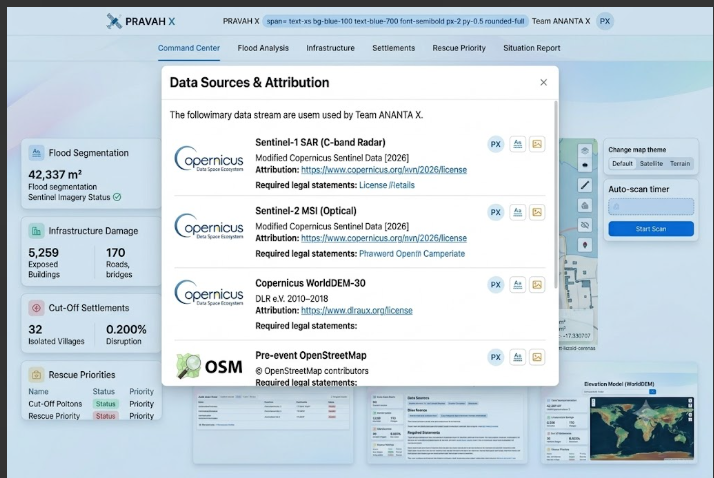
: PRAVAH X Data View: Citing the multimodal input streams and attribution required by Copernicus.
-
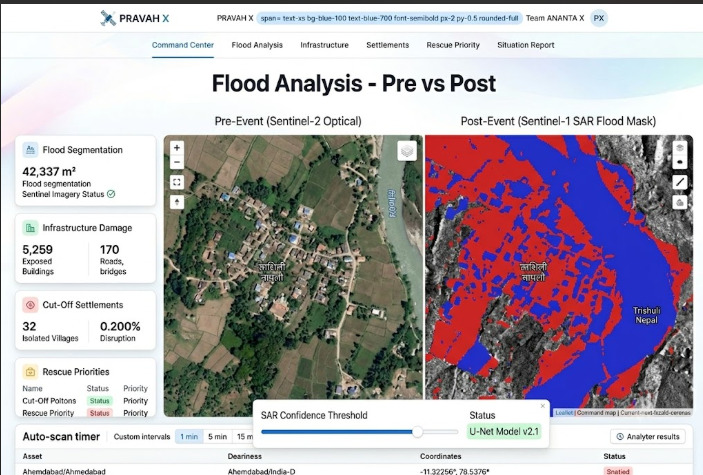
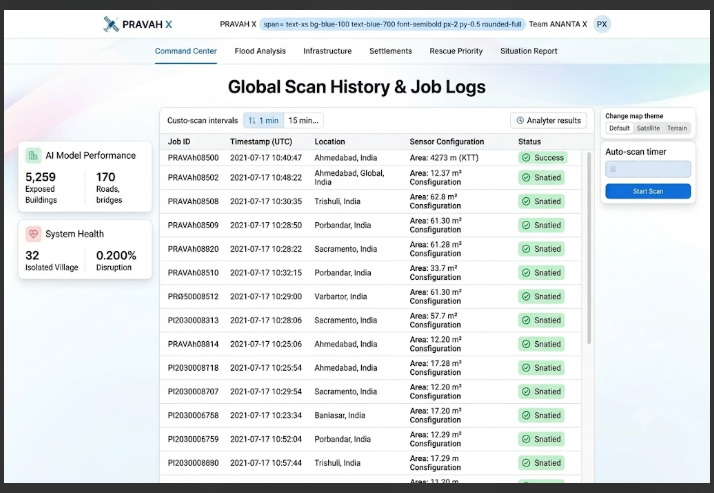
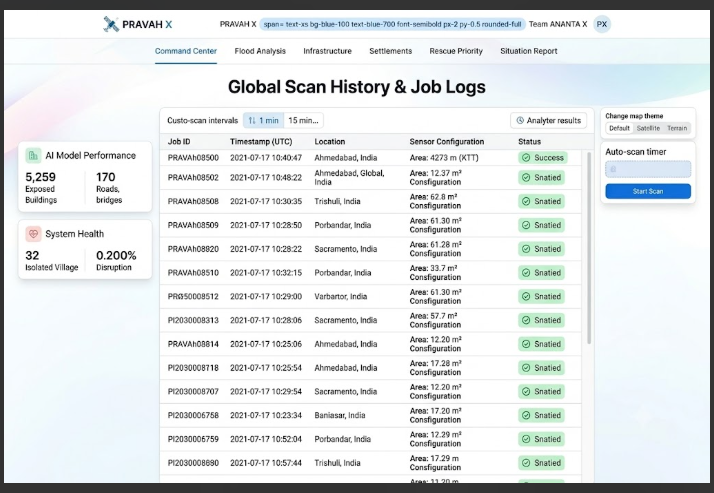
PRAVAH X System View: Chronological log of global analysis jobs and processing status.
-
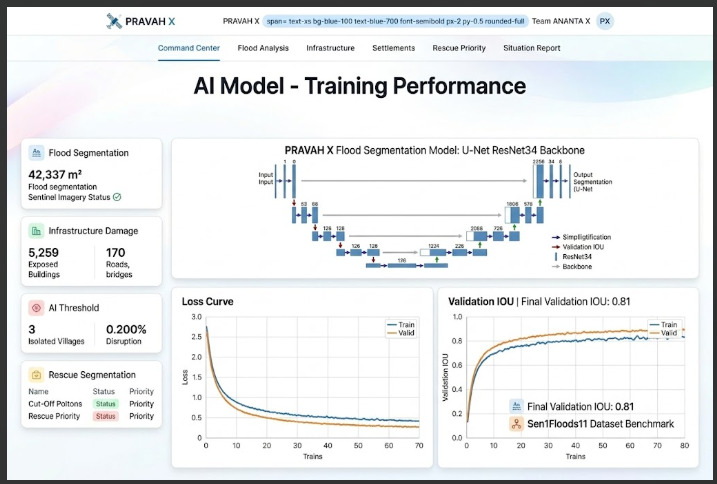
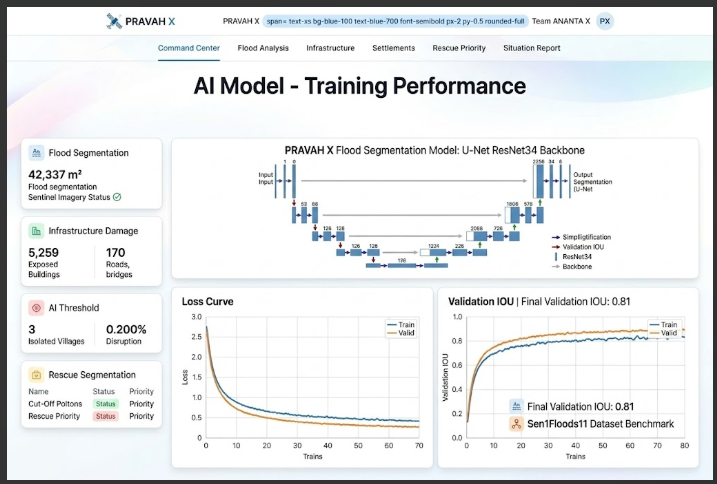
PRAVAH X ML View: U-Net ResNet34 flood segmentation model and validation metrics. This image highlights the technical core
About PRAVAH XTagline: See the Flood. Find the Damage. Reach the Cut Off.💡 What Inspired UsDuring severe flood disasters, critical humanitarian response is often bottlenecked by a single brutal reality: information blackout. Traditional optical satellite imagery fails under dense cloud cover, ground surveying teams are physically blocked by destroyed infrastructure, and first responders struggle to prioritize rescue missions across vast geographical regions.When floodwaters breach riverbanks, knowing that flooding occurred is not enough. Emergency command centers need answers to granular, high-stakes questions in real time:Which specific bridges have lost structural approach roads?Which isolated villages have completely lost road access to the nearest hospital?Where should amphibious rescue units be deployed first to save the maximum number of human lives?We were inspired to build PRAVAH X to bridge the gap between complex Earth Observation (EO) satellite data and actionable decision support for frontline disaster responders.🛰️ How We Built PRAVAH XPRAVAH X was engineered as an end-to-end, real-time satellite disaster intelligence platform featuring a dark command-center UI, multimodal image fusion, and dynamic topological graph routing.1. Multimodal Satellite Data Fusion (SAR + Optical)To overcome cloud cover limitations during active monsoons, we integrated Sentinel-1 C-band Synthetic Aperture Radar (SAR) alongside Sentinel-2 Multispectral Imagery (MSI).Using specular reflection properties, water surfaces appear characteristically dark in SAR backscatter imagery ($\sigma^0$). We applied thresholding and continuous radar speckle filtering to isolate water bodies:$$\text{Flood Mask} = \Big( \sigma^0_{\text{post, VH}} < \tau_{\text{SAR}} \Big) \;\cap\; \Big( \text{DEM Slope} < \theta_{\text{max}} \Big)$$where $\tau_{\text{SAR}}$ represents the backscatter calibration threshold in decibels ($\text{dB}$) and Copernicus WorldDEM-30 elevation data removes false positives on steep terrain shadows.2. AI Flood Segmentation PipelineOur AI engine utilizes a deep convolutional segmentation model (U-Net with a ResNet-34 backbone) fine-tuned on benchmark EO datasets (Sen1Floods11 and Kuro Siwo). The segmentation loss function balances binary cross-entropy ($L_{\text{BCE}}$) with Dice Loss ($L_{\text{Dice}}$) to handle severe class imbalance between flooded and non-flooded terrain:$$\mathcal{L}{\text{total}} = \alpha \cdot \mathcal{L}{\text{BCE}} + (1 - \alpha) \cdot \mathcal{L}{\text{Dice}}$$$$\mathcal{L}{\text{Dice}} = 1 - \frac{2 \sum_{i} y_i \hat{y}i + \epsilon}{\sum{i} y_i + \sum_{i} \hat{y}i + \epsilon}$$3. OpenStreetMap (OSM) Infrastructure OverlapBy downloading pre-event OpenStreetMap vector graphs, PRAVAH X performs real-time spatial intersection between the detected flood vector layer ($\mathcal{F}$) and critical infrastructure geometry ($\mathcal{I}$):$$\mathcal{I}{\text{exposed}} = { x \in \mathcal{I} \;\mid\; \text{Intersects}(x, \mathcal{F}) = \text{True} }$$4. Topological Cut-Off Settlement AnalysisTo determine Who is Cut Off?, we construct a directed road network graph $\mathcal{G} = (\mathcal{V}, \mathcal{E})$. When flood vectors intersect road edges $e_k \in \mathcal{E}$, those edges are removed ($\mathcal{E}' = \mathcal{E} \setminus {e_k}$). We then compute shortest-path reachability algorithms (such as Dijkstra's algorithm) from isolated settlement vertices $v_s$ to the nearest emergency hospital node $v_h$:$$d(v_s, v_h){\mathcal{G}'} = \infty \implies \text{Settlement } v_s \text{ is Isolated}$$5. Multi-Criteria Rescue Prioritization MatrixLocations are dynamically assigned a Priority Score ($P$) using a weighted combination of flood depth exposure, road network isolation severity, distance to critical healthcare facilities, and population vulnerability:$$P = w_1 \cdot \text{Exposure}{\text{flood}} + w_2 \cdot \text{Isolation}{\text{network}} + w_3 \cdot \frac{1}{\text{Distance}{\text{hospital}}} + w_4 \cdot \text{Pop}_{\text{density}}$$🚧 Challenges We FacedRadar Speckle Noise & False Positives: Synthetic Aperture Radar (SAR) signals suffer from inherent graininess ("speckle noise") and false-positive water detection caused by smooth asphalt roads, airfield runways, and topographic hill shadows. We mitigated this by combining Lee filtering with Copernicus WorldDEM-30 elevation slope constraints.Dynamic Geocoding & Map Re-Centering: Synchronizing real-time global Nominatim geocoding searches with interactive Leaflet map rendering required careful state management to ensure seamless tile updates without crashing polygon overlays.Graph Calculation Scale: Calculating road graph severance across large geographical territories in real-time placed heavy computational loads on the client side. We solved this by clipping the spatial extent to the user's active search bounding box before building edge matrices.Bandwidth Efficiency in Disaster Zones: Transmitting high-resolution satellite imagery consumes high bandwidth. We implemented client-side vector geoJSON tile rendering and compressed field situation briefs into lightweight .txt and JSON formats.📚 What We LearnedPower of Multimodal EO Data: Relying on a single imagery source is insufficient during real-world disasters. Fusing radar (SAR) with optical multispectral data provides continuous all-weather monitoring capabilities.Topological Routing Over Visual Mapping: Simply displaying a flooded map isn't enough for emergency responders; calculating network connectivity loss (road severance to hospitals) provides far greater tactical value than visual overlays alone.Human-Centric Emergency Design: In high-stress situation rooms, user interfaces must be clear, actionable, and free from misleading AI claims. Incorporating explicit confidence intervals and field-verification disclaimers builds trust with first responders.👥 Developed by Team ANANTA XPrit Suva (Team Leader) — [email protected] Modhvadiya — [email protected] Karangiya — [email protected]
Built With
- architecture
- copernicus
- css
- fastapi
- geopandas
- leaflet.js
- lucide
- msi
- numpy
- openstreetmap
- osmnx
- python
- rasterio
- react
- recharts
- resnet-34
- sar
- sentinel-1
- sentinel-2
- shapely
- tailwind
- typescript
- u-net
- vite
- worlddem-30

Log in or sign up for Devpost to join the conversation.