-
-
Battery
-
Forecast
-
-
-
Programs
-
Register
-
-
Fleet
-
Digital Twin
Inspiration/Problem
A building permit from 1995 says a house has a heat pump, and nobody has filed anything since. Is it still there? That question is where this started. As electricity demand grows and data centres press on local grids, distributed energy resources matter more: rooftop solar, batteries, electric vehicles, flexible household loads. Those resources sit in thousands of separate homes, and what we know about them is scattered across building permits, equipment records, satellite imagery and consumption data. Permits go out of date. Imagery shows a panel exists without showing it still works. Meter data is the best evidence there is, and you need the household's permission to see it.
Then we noticed the same information answers an opposite question. A household with solar, a battery and an EV charger is worth enrolling in a flexibility programme. The household next door with none of that, on the same substation, is the one that needs help when the power goes out. One scores high for the grid, the other scores high for support, and both numbers come from the same place. This helps energy aggregators and decision makers understand what exists, how confident we are that it exists, where grid stress may matter most, and which households should be prioritised for enrolment or support.
What it does
WattNext scores every household in a service area. The demo covers 360 households across seven communities served by MCE, the community choice aggregator for Marin, Napa, Solano and Contra Costa.
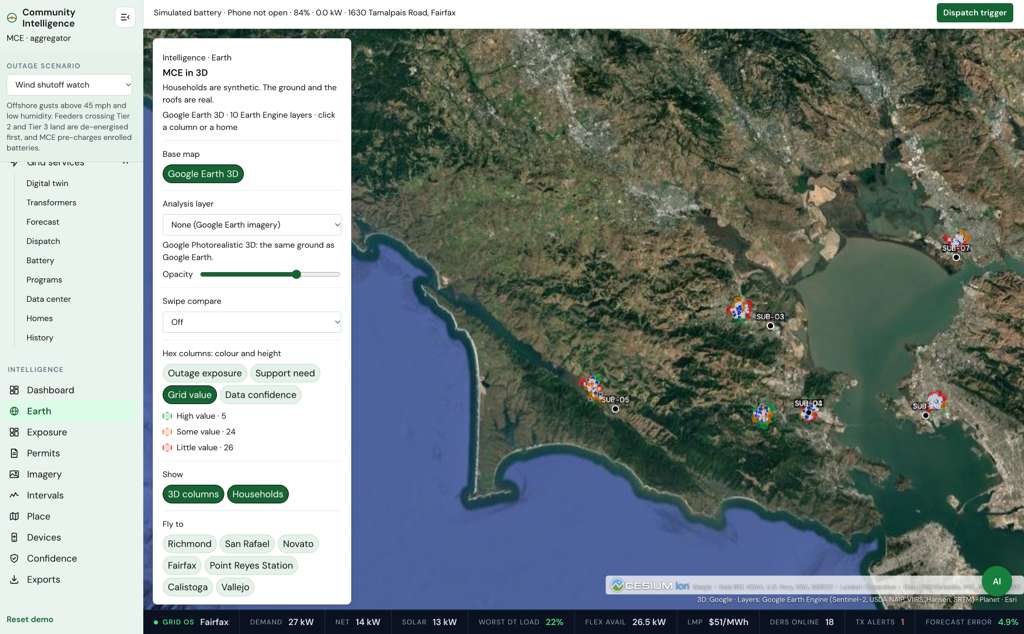
- Grid value: what its equipment could earn in a flexibility programme.
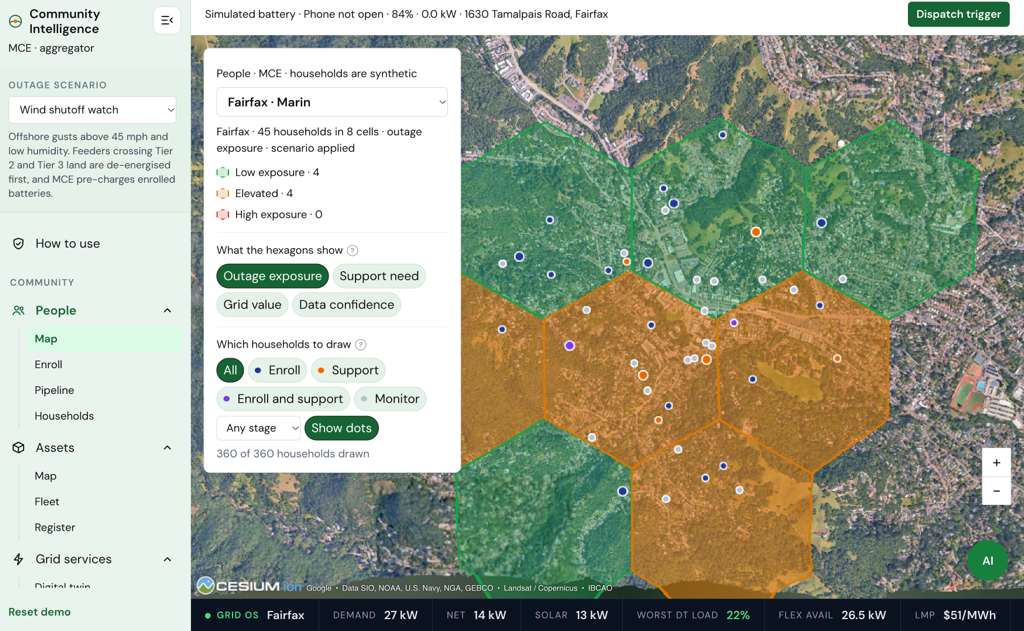
- Outage exposure: the chance its substation area loses power, multiplied by how badly this home would suffer it.
- Support need: how badly an outage would hurt it, after allowing for what it could afford to fix itself.
- Data confidence: how sure we are that it owns what we think it owns.
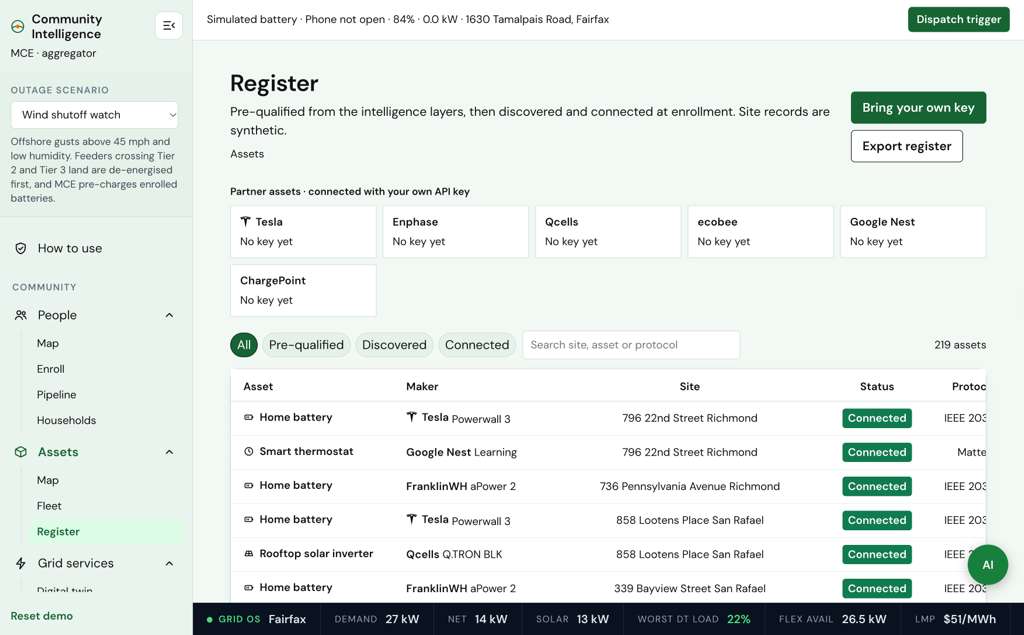
Every asset we believe a household owns carries a confidence score that records where the belief came from. A building permit starts at 85%, imagery at 70%, Green Button meter data at 90%, and a device the customer's own app finds at enrolment at 97%. Each one halves for every half-life of the equipment. Area averages are capped at 30%. Sources that agree raise confidence. When they conflict, the newest wins and the conflict is flagged.
Around those scores the platform gives an operator five things.
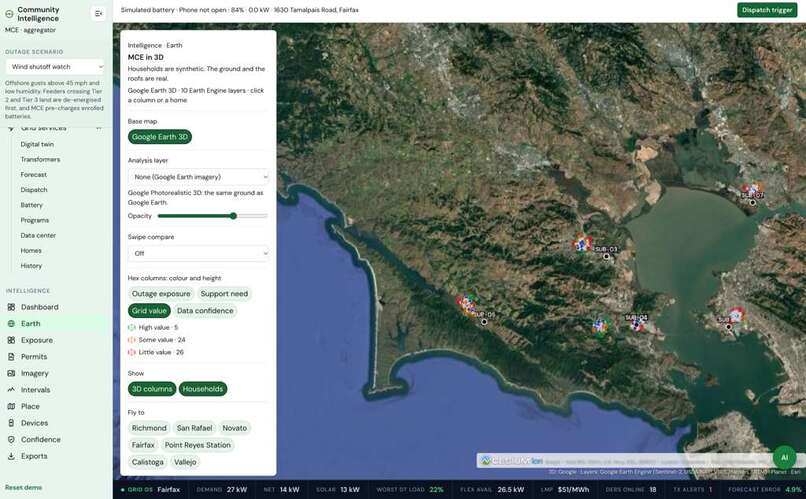
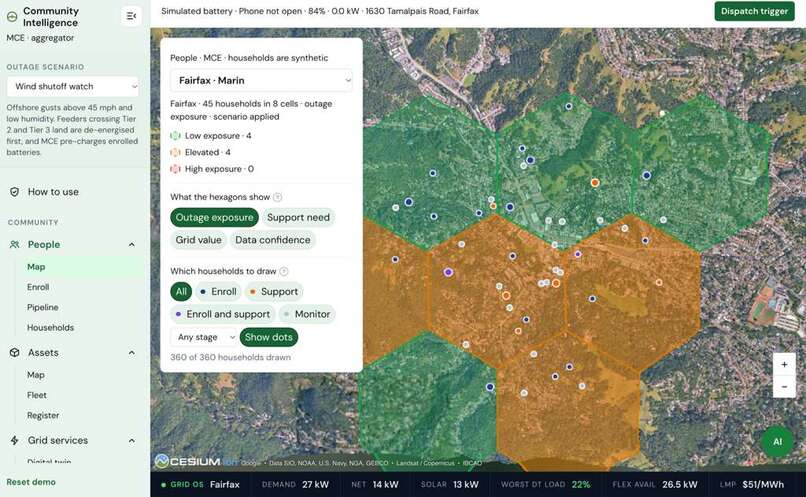
- A map of the service area on Google Photorealistic 3D, with Earth Engine and Planet imagery, a hex grid of substation areas, and a dossier for any household. Clicking a home flies to its real roof and shows Google Solar data.
- A chart that plots any two of 20 variables against each other, filtered by area or pipeline stage, which names the households worth opening and what to do about each.
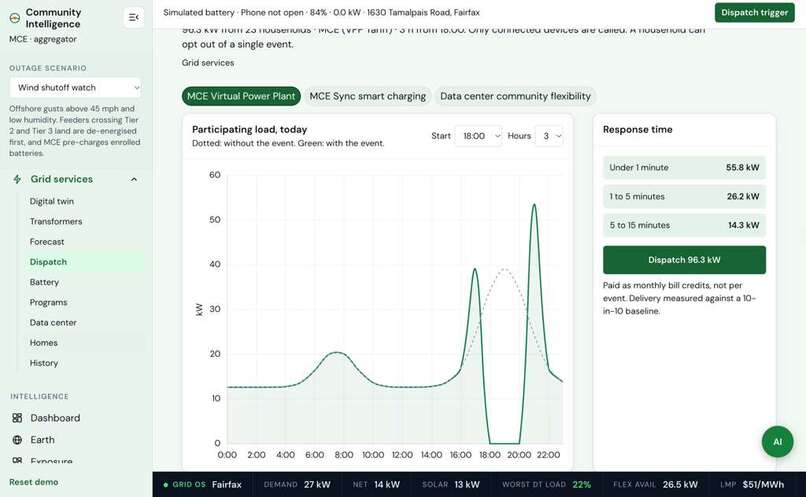
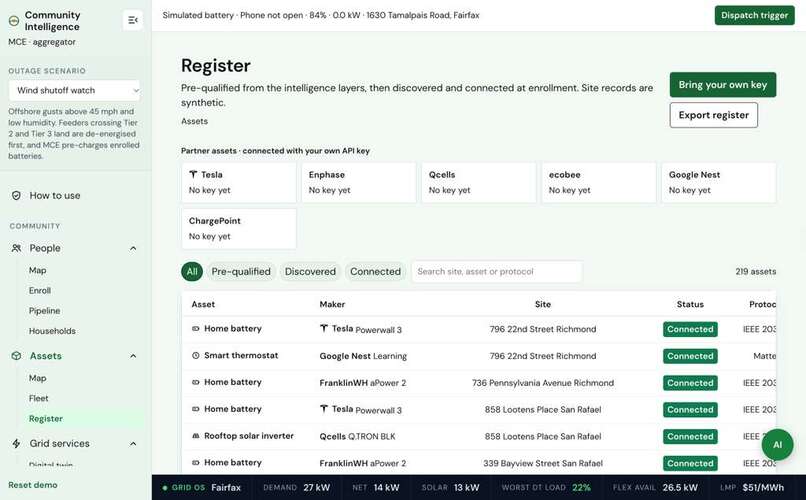
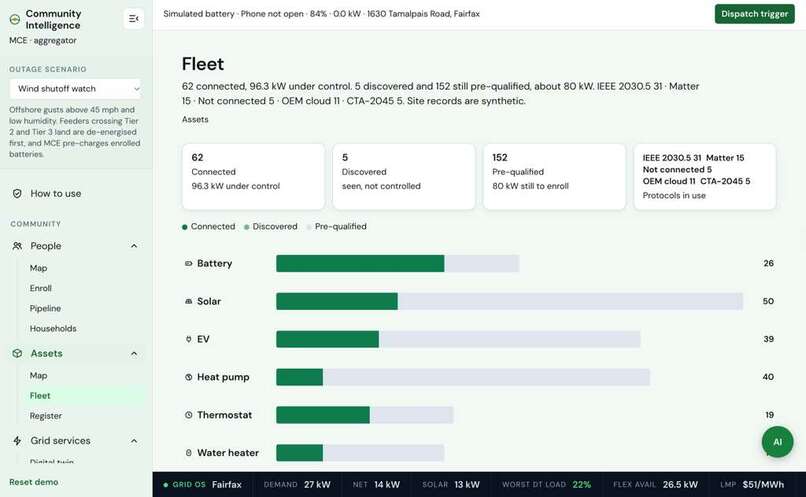
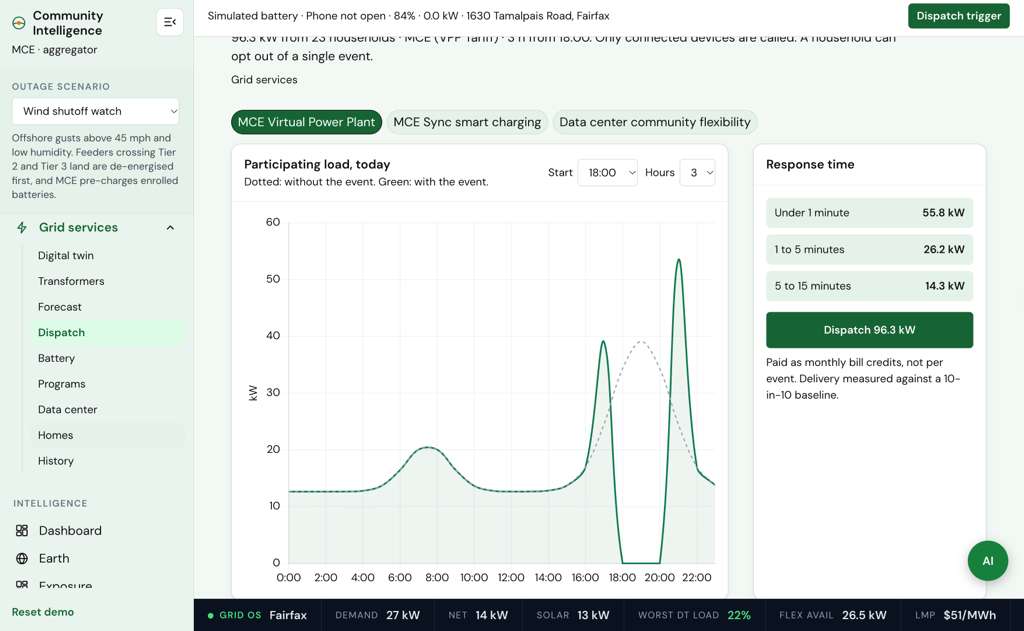
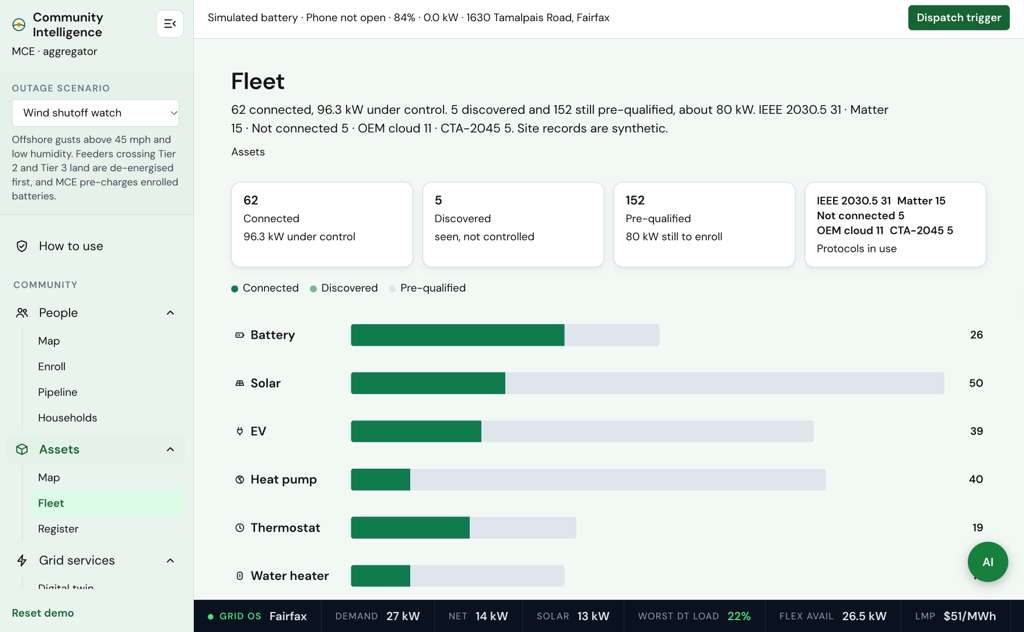
- Enrolment and dispatch, capturing each device with the protocol it would be dispatched over (IEEE 2030.5, Matter, CTA-2045), then calling events once a household is signed up. Claude recommends the kW and duration of each dispatch.
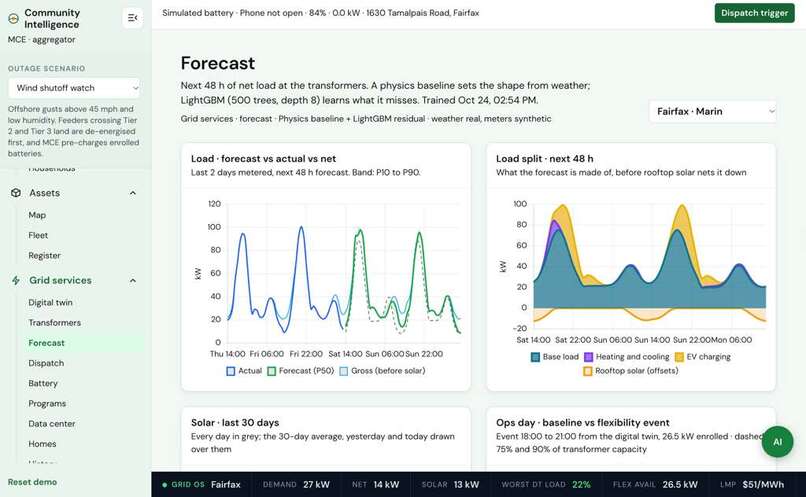
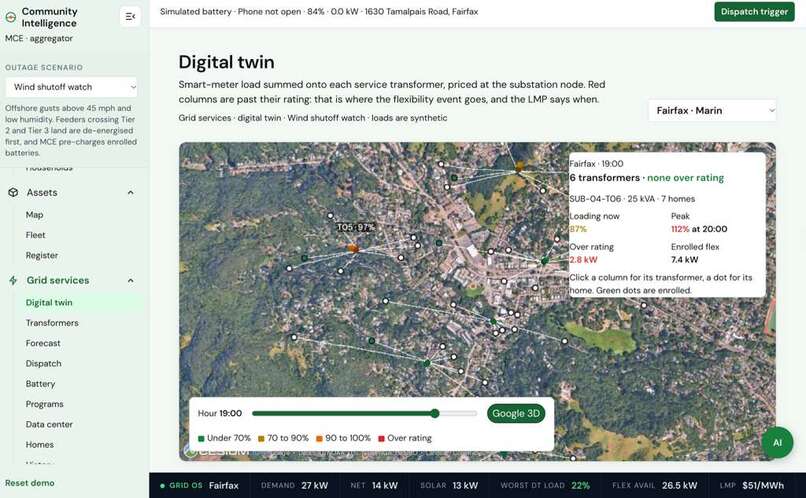
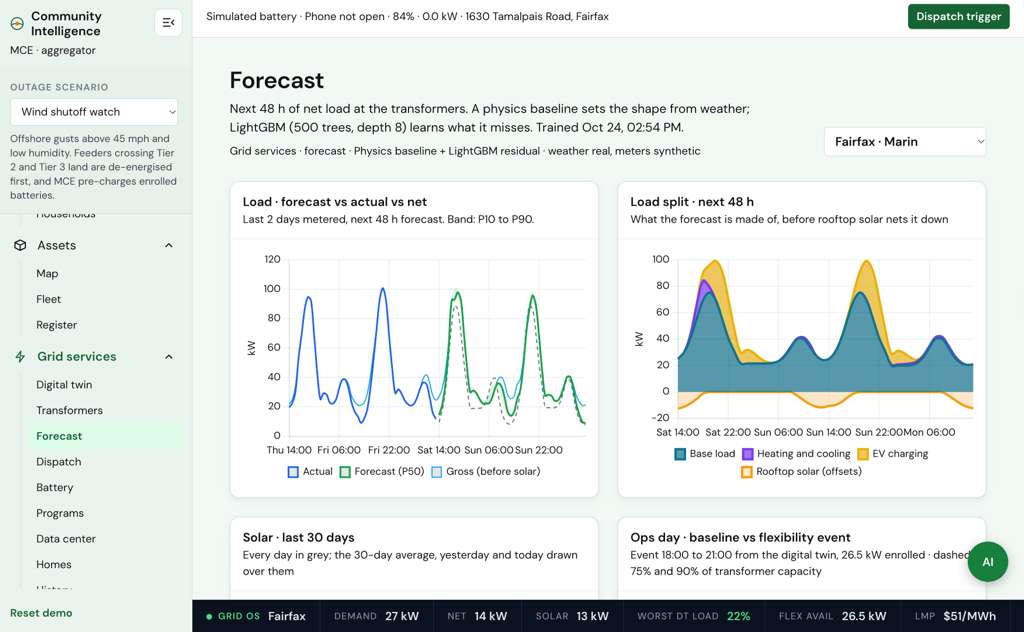
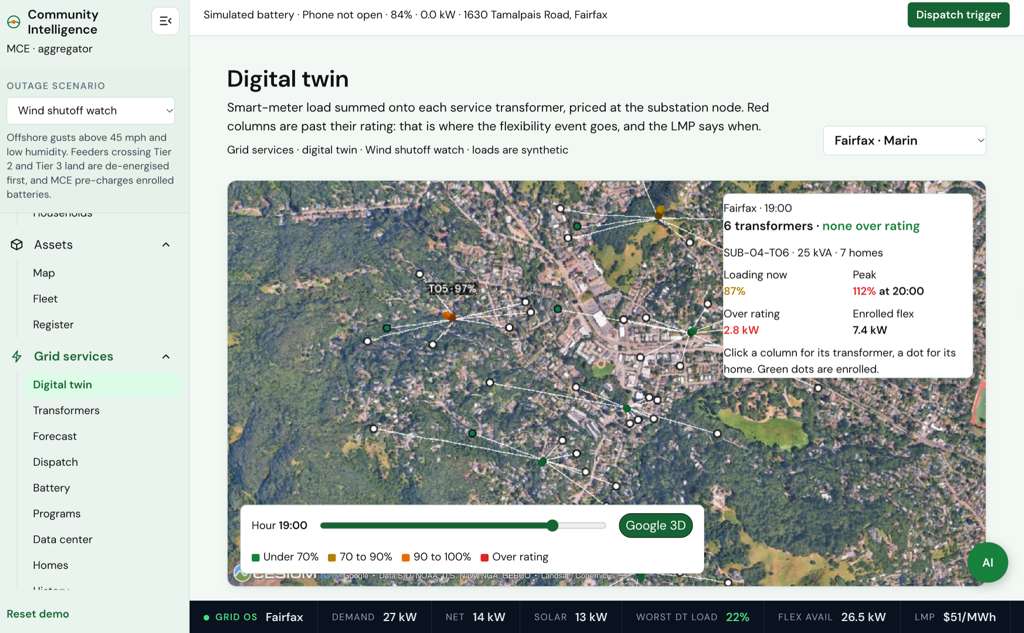
- A digital twin and forecast: transformer loading, substation prices, and a 48-hour load forecast for each community.
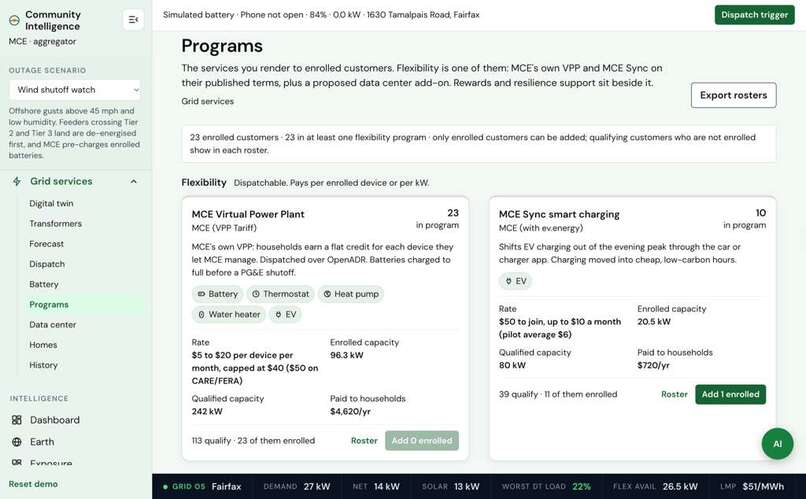
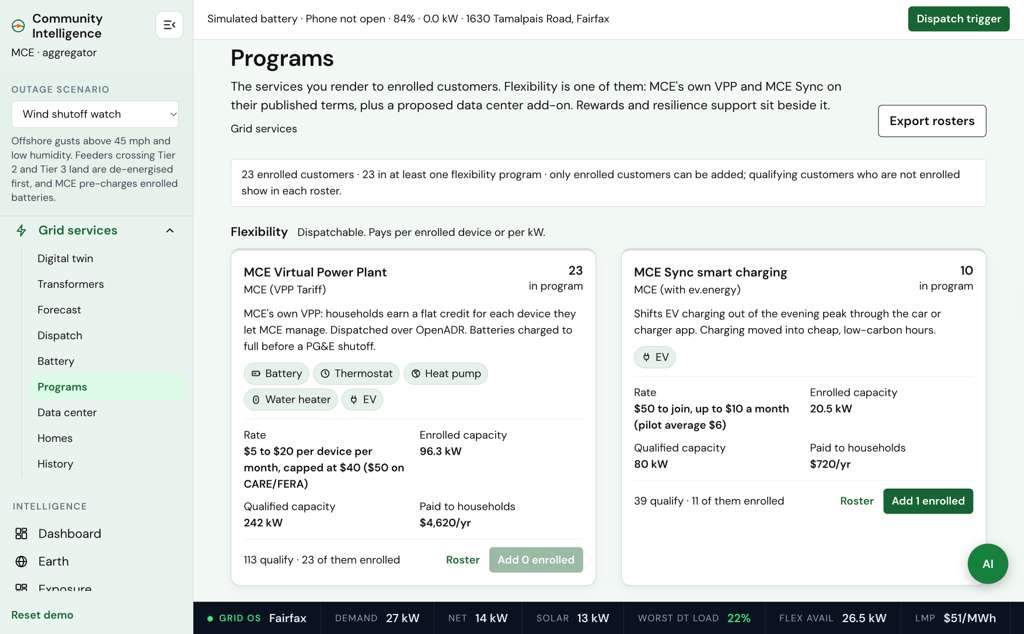
- Programme valuation on MCE's published VPP and MCE Sync terms, and a data centre campus designer that sets a campus's peak against substation headroom and the household flexibility behind it.
How we built it
WattNext is a Vite and vanilla JavaScript web app with client-side scoring. Cesium renders the maps and hex grid on Google's Photorealistic 3D Tiles, and Chart.js visualises relationships between household, asset, and grid variables. Earth Engine supplies the imagery layers (NAIP at 0.6 m, Sentinel-2, ESA WorldCover), Planet adds monthly basemaps, and we read Google's Solar API for rooftop insights. Every tile, imagery and AI call goes through our own server, so the keys never reach the browser.
A Node pipeline pulls real Census ACS, CPUC fire-threat tiers, OpenStreetMap buildings and substations, and Open-Meteo weather for the seven communities. The households on top are synthetic, generated from a fixed seed on real building footprints, so the same house gets the same score every time you run it. A LightGBM model on a physics baseline forecasts load 48 hours ahead from real weather.
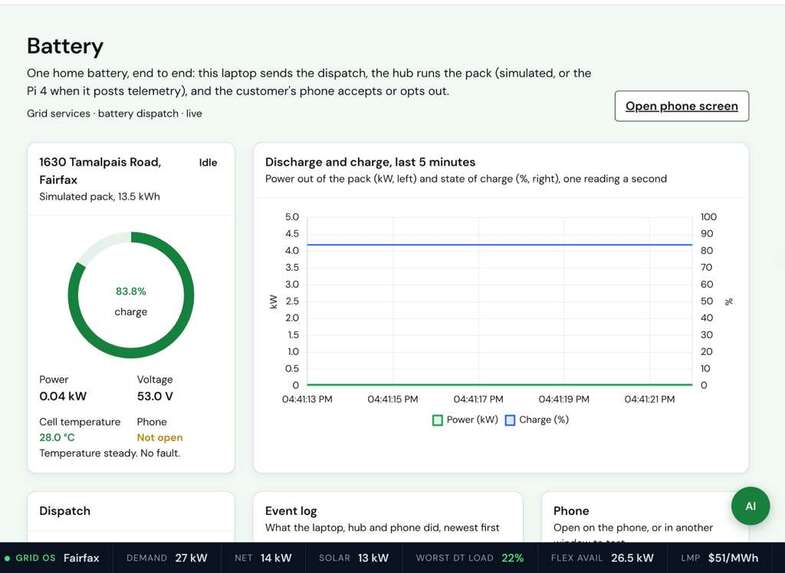
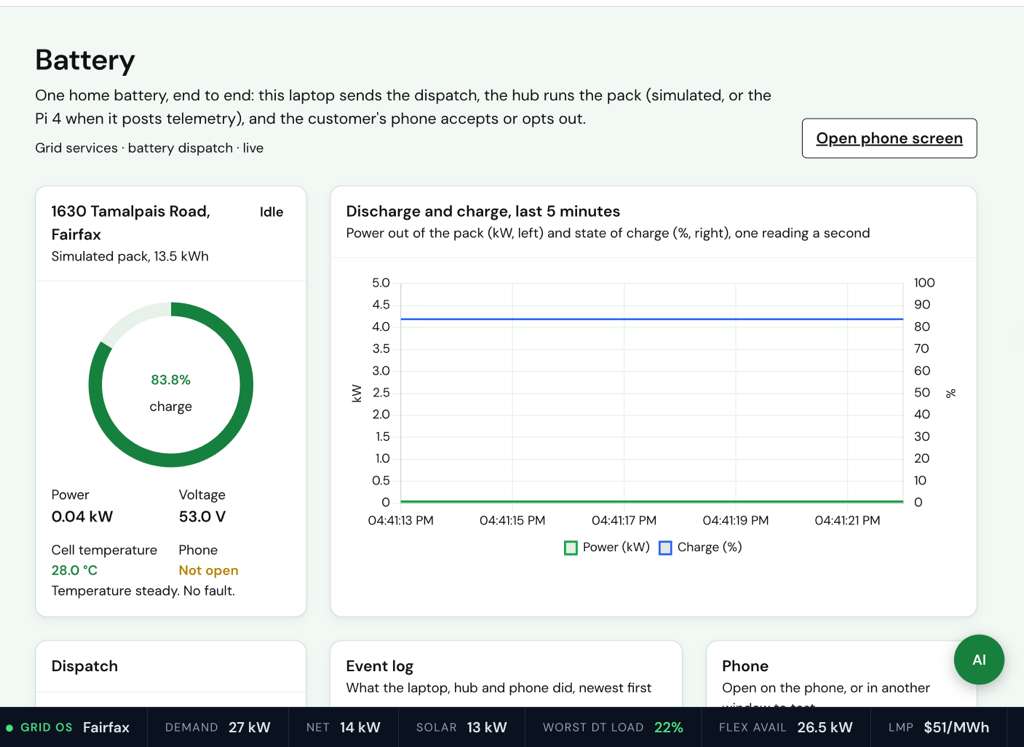
We also wired up a Raspberry Pi 4 that simulates a home battery and streams its telemetry. A dispatch from the laptop goes through a local hub to the customer's phone, which accepts or opts out.
Why it matters
As data-centre electricity demand grows, WattNext helps operators and energy aggregators understand where flexible distributed energy resources exist, assess local grid exposure, and identify communities that may need outage support. By combining household asset intelligence with grid and community context, the platform helps decision-makers identify promising flexibility-programme participants while highlighting households that may need additional resilience support.
WattNext is an intelligence and decision-support platform, not an automated grid controller: an operator triggers every dispatch, and only to enrolled devices. Its households are synthetic for the demo, placed on real geography and real tariffs. Its scoring helps explore enrolment, programme valuation, and support priorities rather than claiming to predict data-centre workloads or automatically schedule computing tasks.
Challenges we ran into
- Everyone on the same substation loses power together, so the chance of an outage is identical for all of them. That left us no way to tell those households apart, which is why we built a second score: how badly each one would be hit, reduced by what they could afford to fix themselves.
- Permits, imagery, meter data and area averages all disagree with each other, and they go out of date at different speeds. So we gave each source its own starting confidence, let it decay with the equipment's age, and flagged conflicts instead of hiding them.
Accomplishments that we're proud of
- The scoring points at its own weakest data. Across our demonstration portfolio, heat pumps sit at 37% average confidence while smart thermostats sit at 89%, so an aggregator can see which households to contact before committing to a programme.
- We kept the sources visibly separate. Permits, imagery, meter intervals and app discovery each have their own view, rather than being presented as one verified dataset, and every household record can be opened and checked.
- Coherence checks run on all 360 households: more backup never raises exposure, and more income never raises support need.
- The loop is end to end, from finding a household to a dispatch the customer's phone can accept or refuse.
What we learned
The hard part was being honest about what we were guessing at. Once every asset carried a confidence score, we could see which of our valuable households we actually knew nothing about.
We also found the same scores answer two opposite questions. An aggregator reads them to decide who to enrol. A data centre reads them to decide who to subsidise.
What's next for WattNext
Real permit and Green Button data instead of the seed, and real meters behind the load forecast. Outage probability fitted on DOE EAGLE-I and PG&E shutoff records, because right now you pick a scenario and we score it; we don't predict which one actually happens. And checking transformer data after an event, so we can prove the load really dropped when we asked.
Built With
- census-acs
- cesium
- chart.js
- cloudflare-tunnel
- css
- google-ai-edge-gallery
- google-earth-engine
- google-maps-platform
- google-pixel
- google-solar-api
- html
- javascript
- lightgbm
- node.js
- openadr
- openstreetmap
- planet-labs
- raspberry-pi
- react
- vercel
- vite
- web-bluetooth

Log in or sign up for Devpost to join the conversation.