-
-
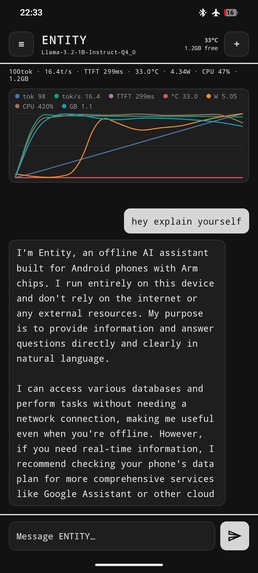
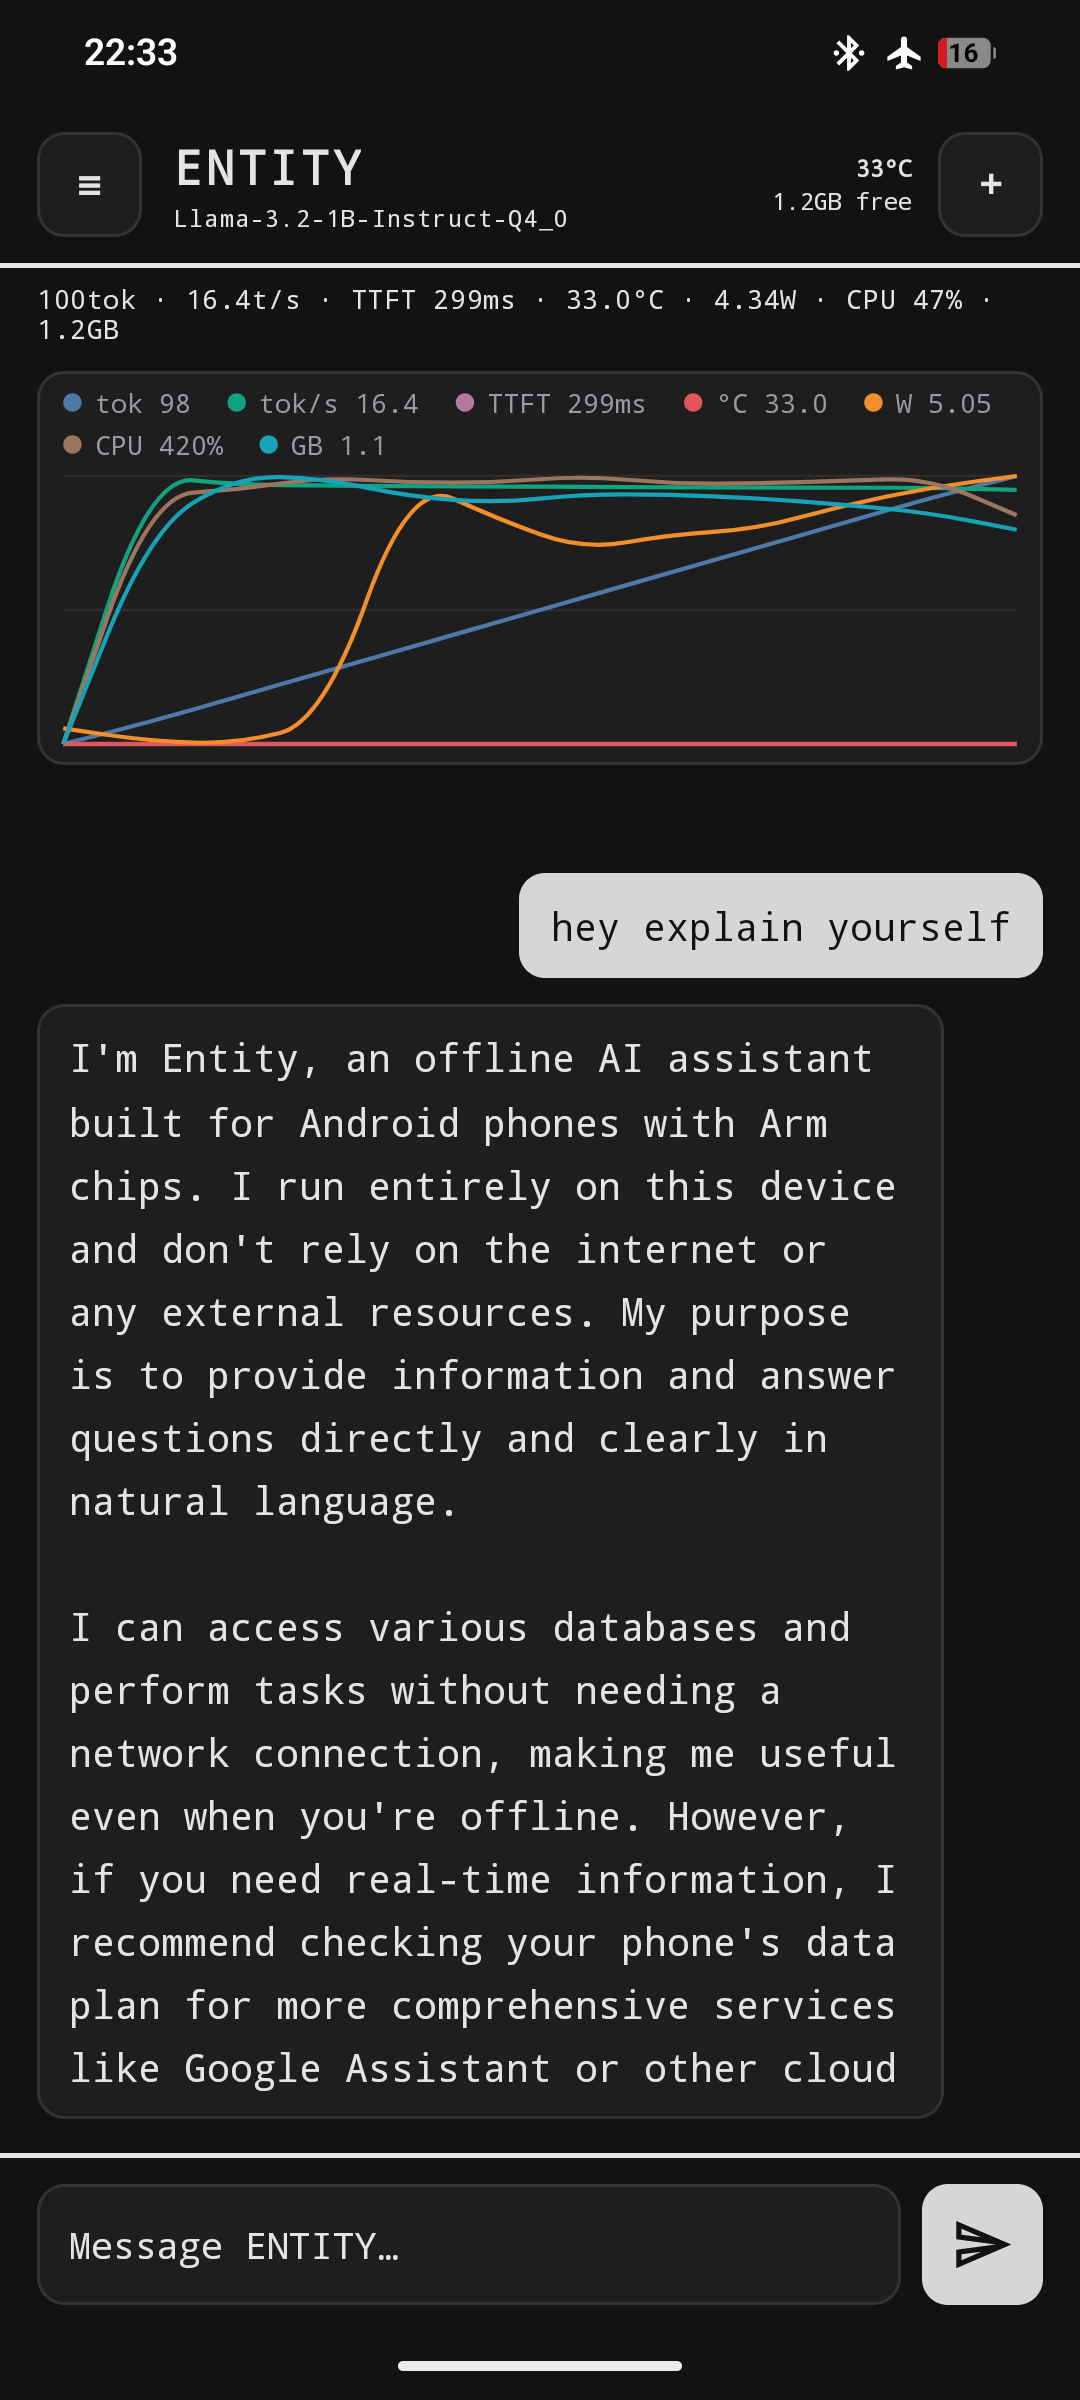
Home_Chat Page
-
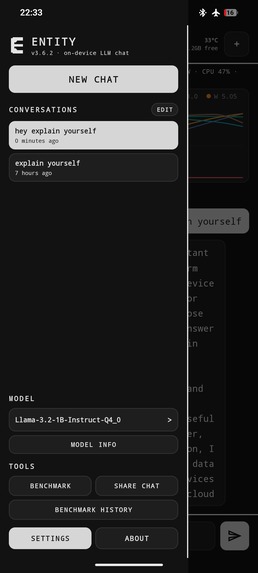
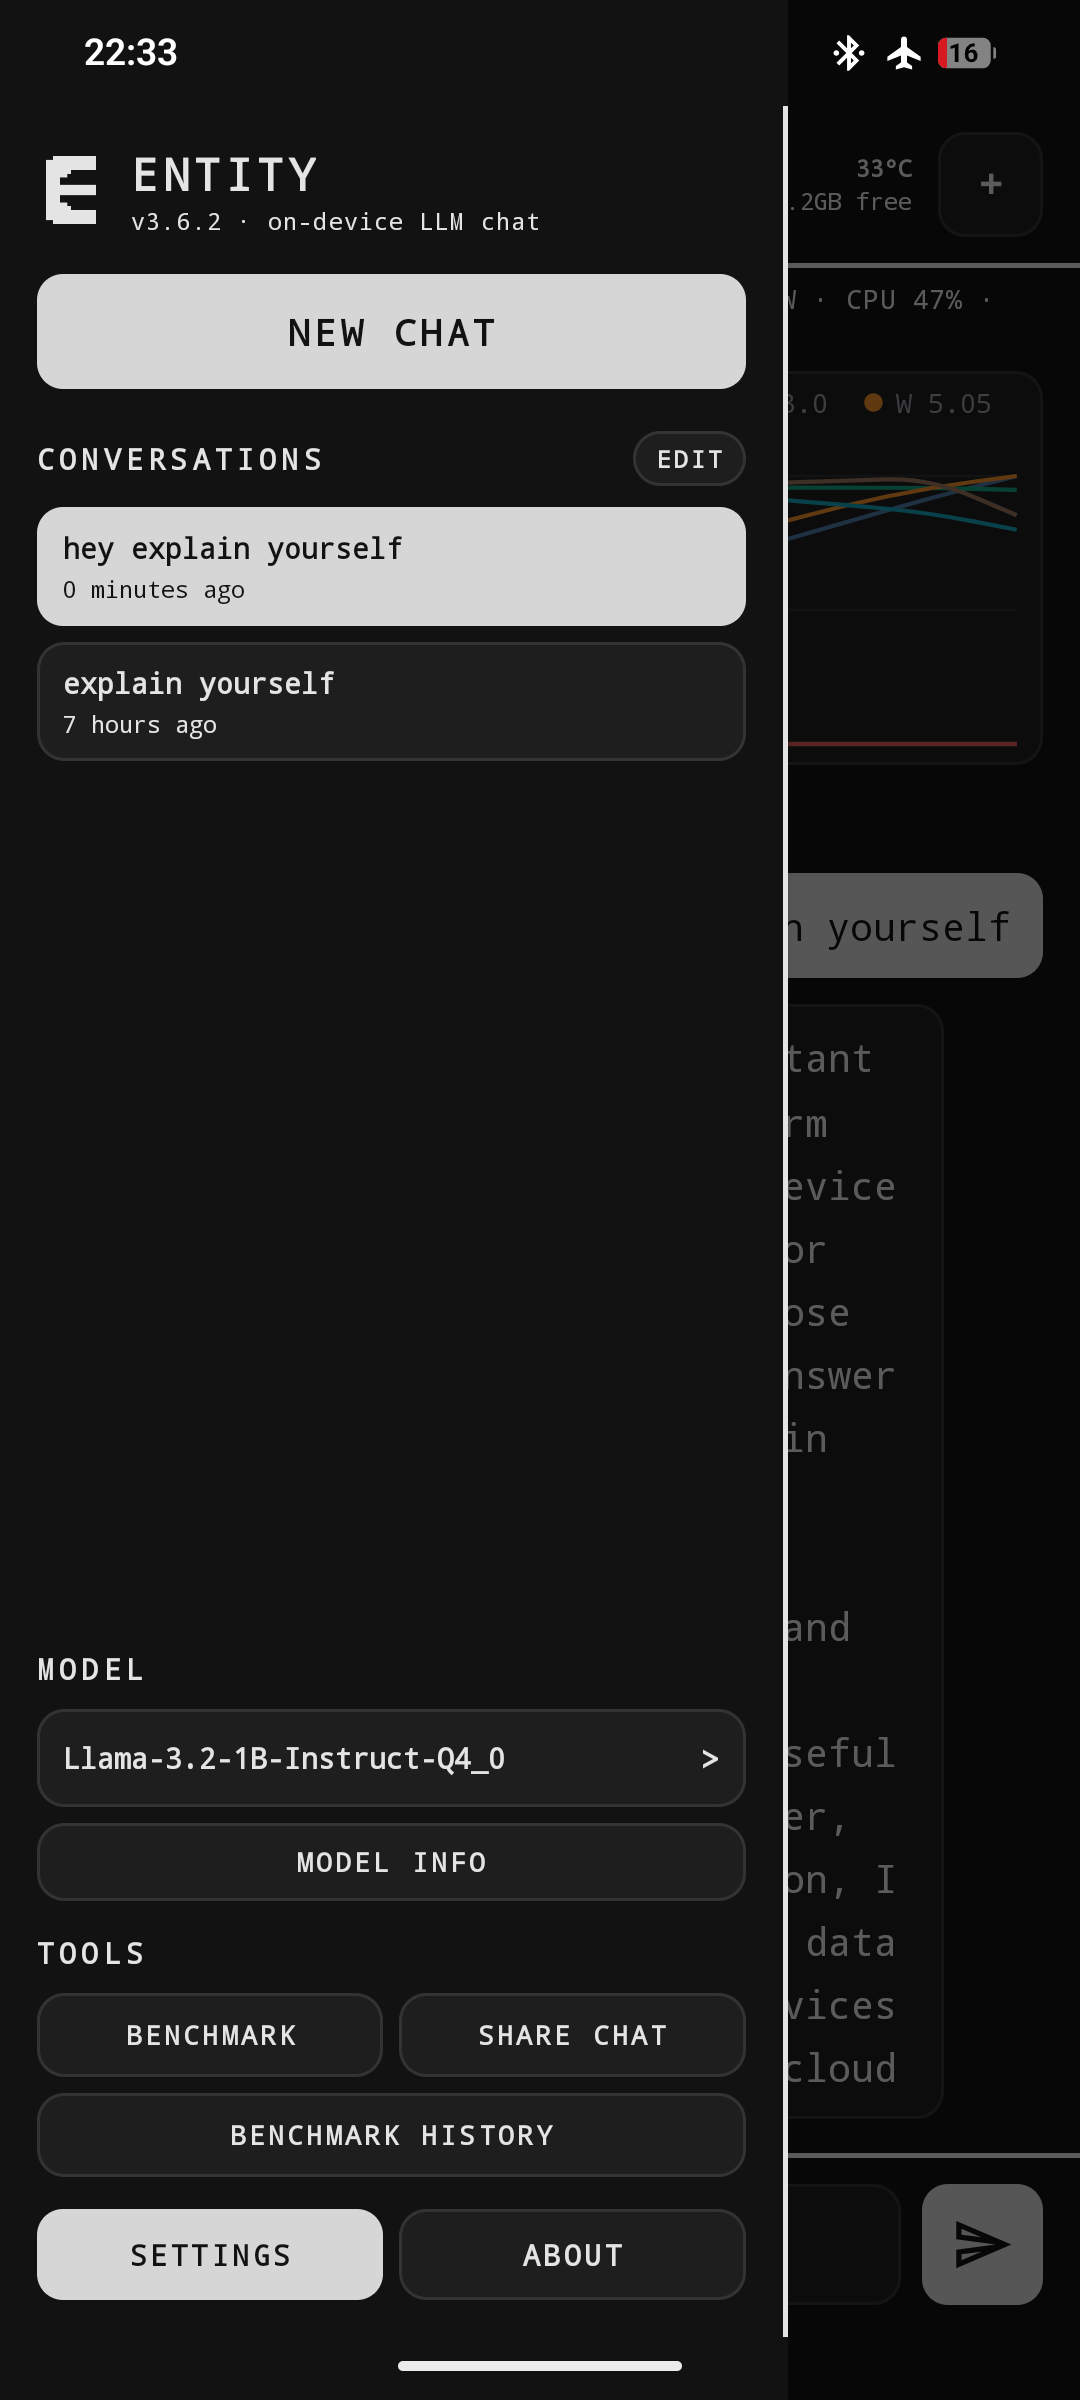
Menu Page
-
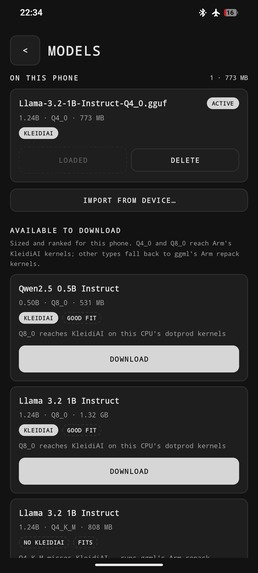
Models Page
-
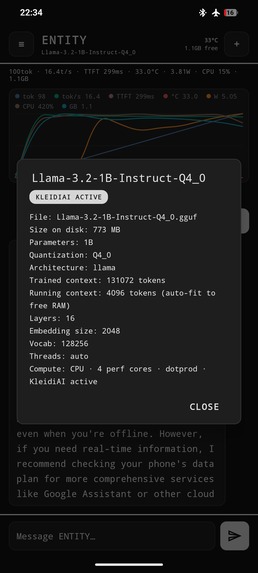
Model_Info Page
-
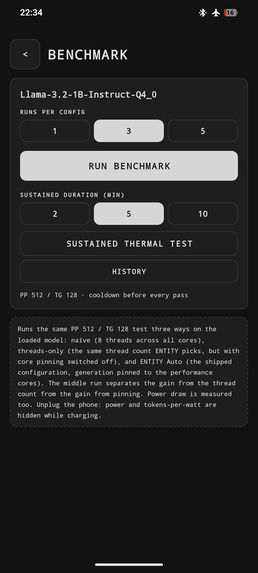
Benchmark Page
-
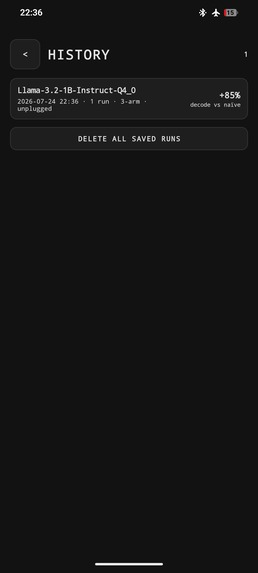
Benchmark_History Page
-
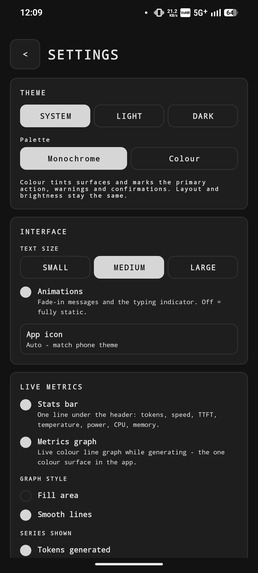
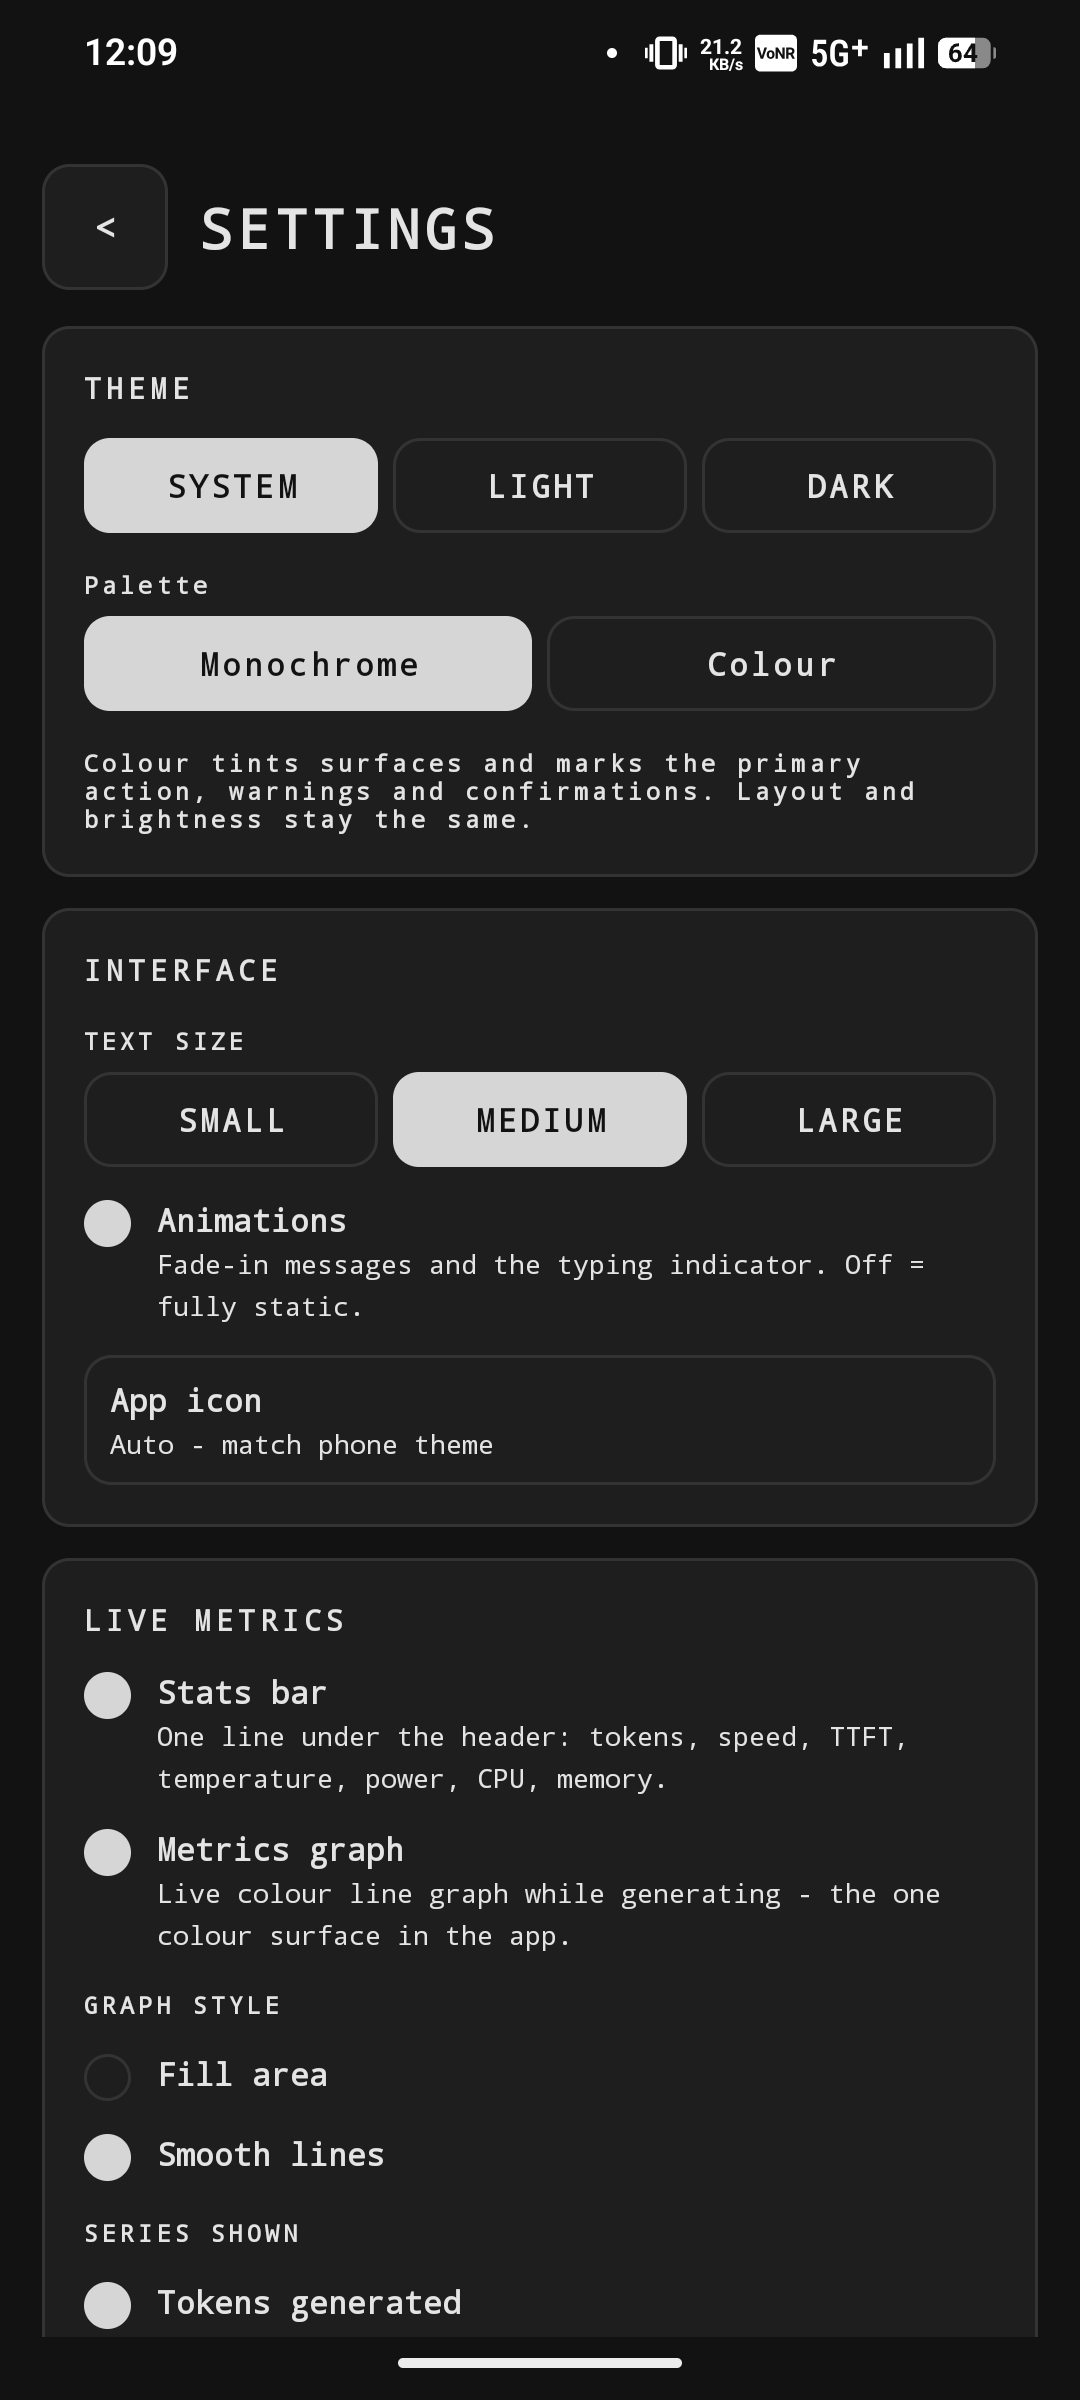
Settings_1 Page
-
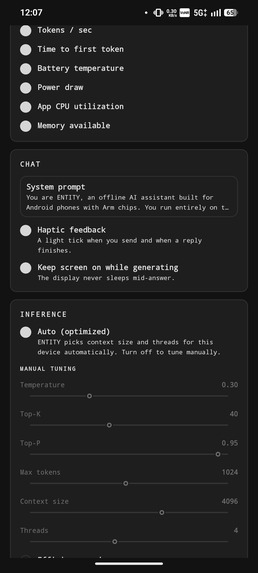
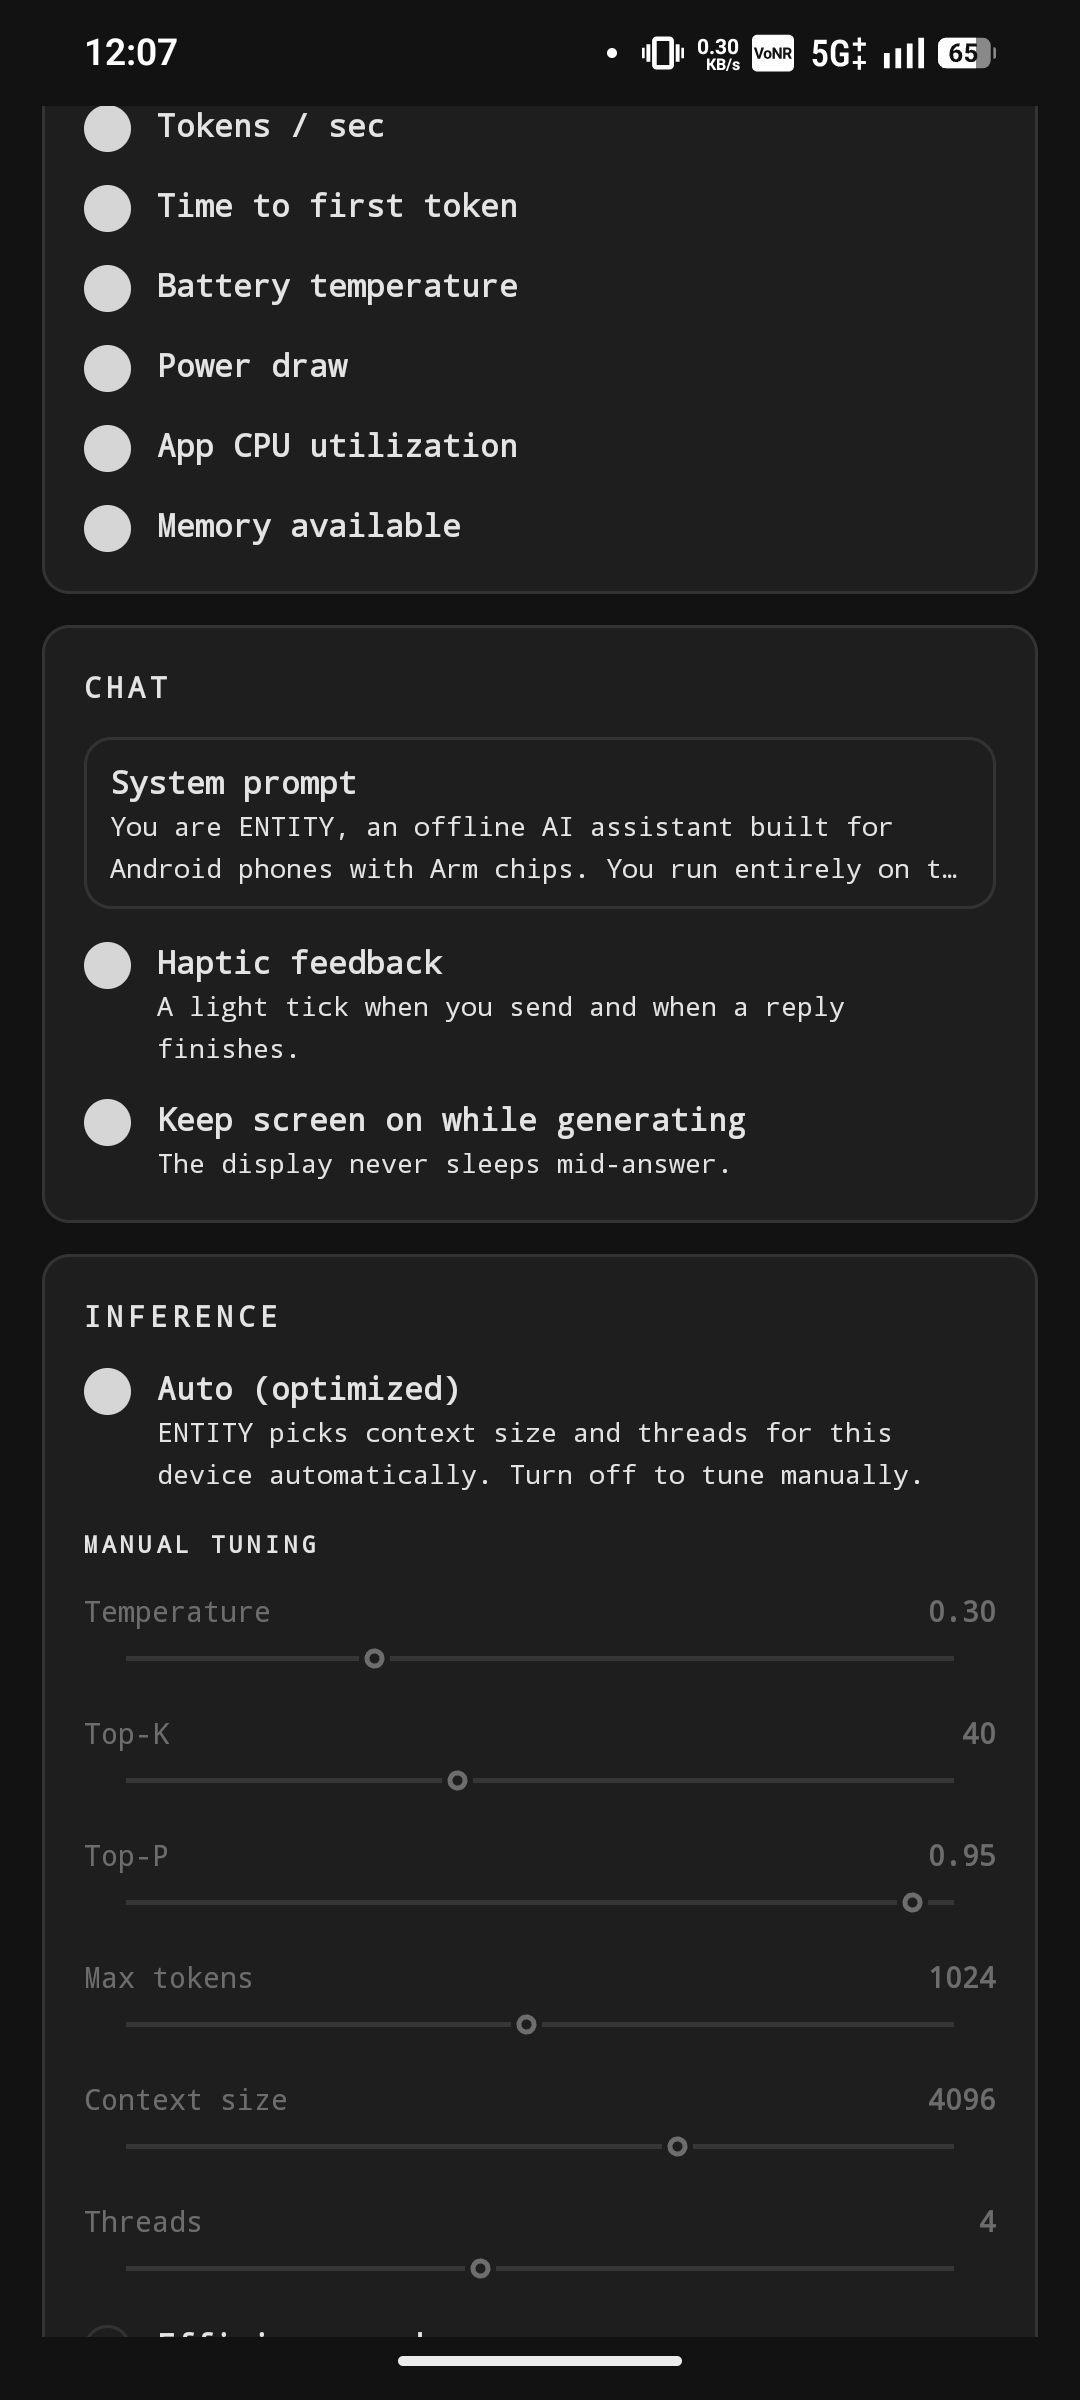
Settings_2 Page
-
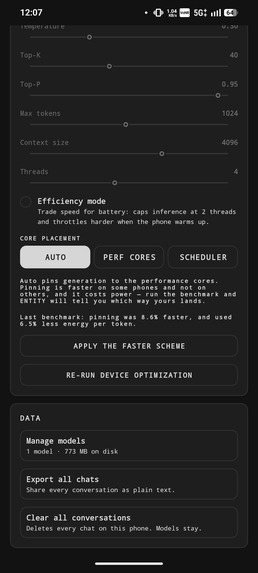
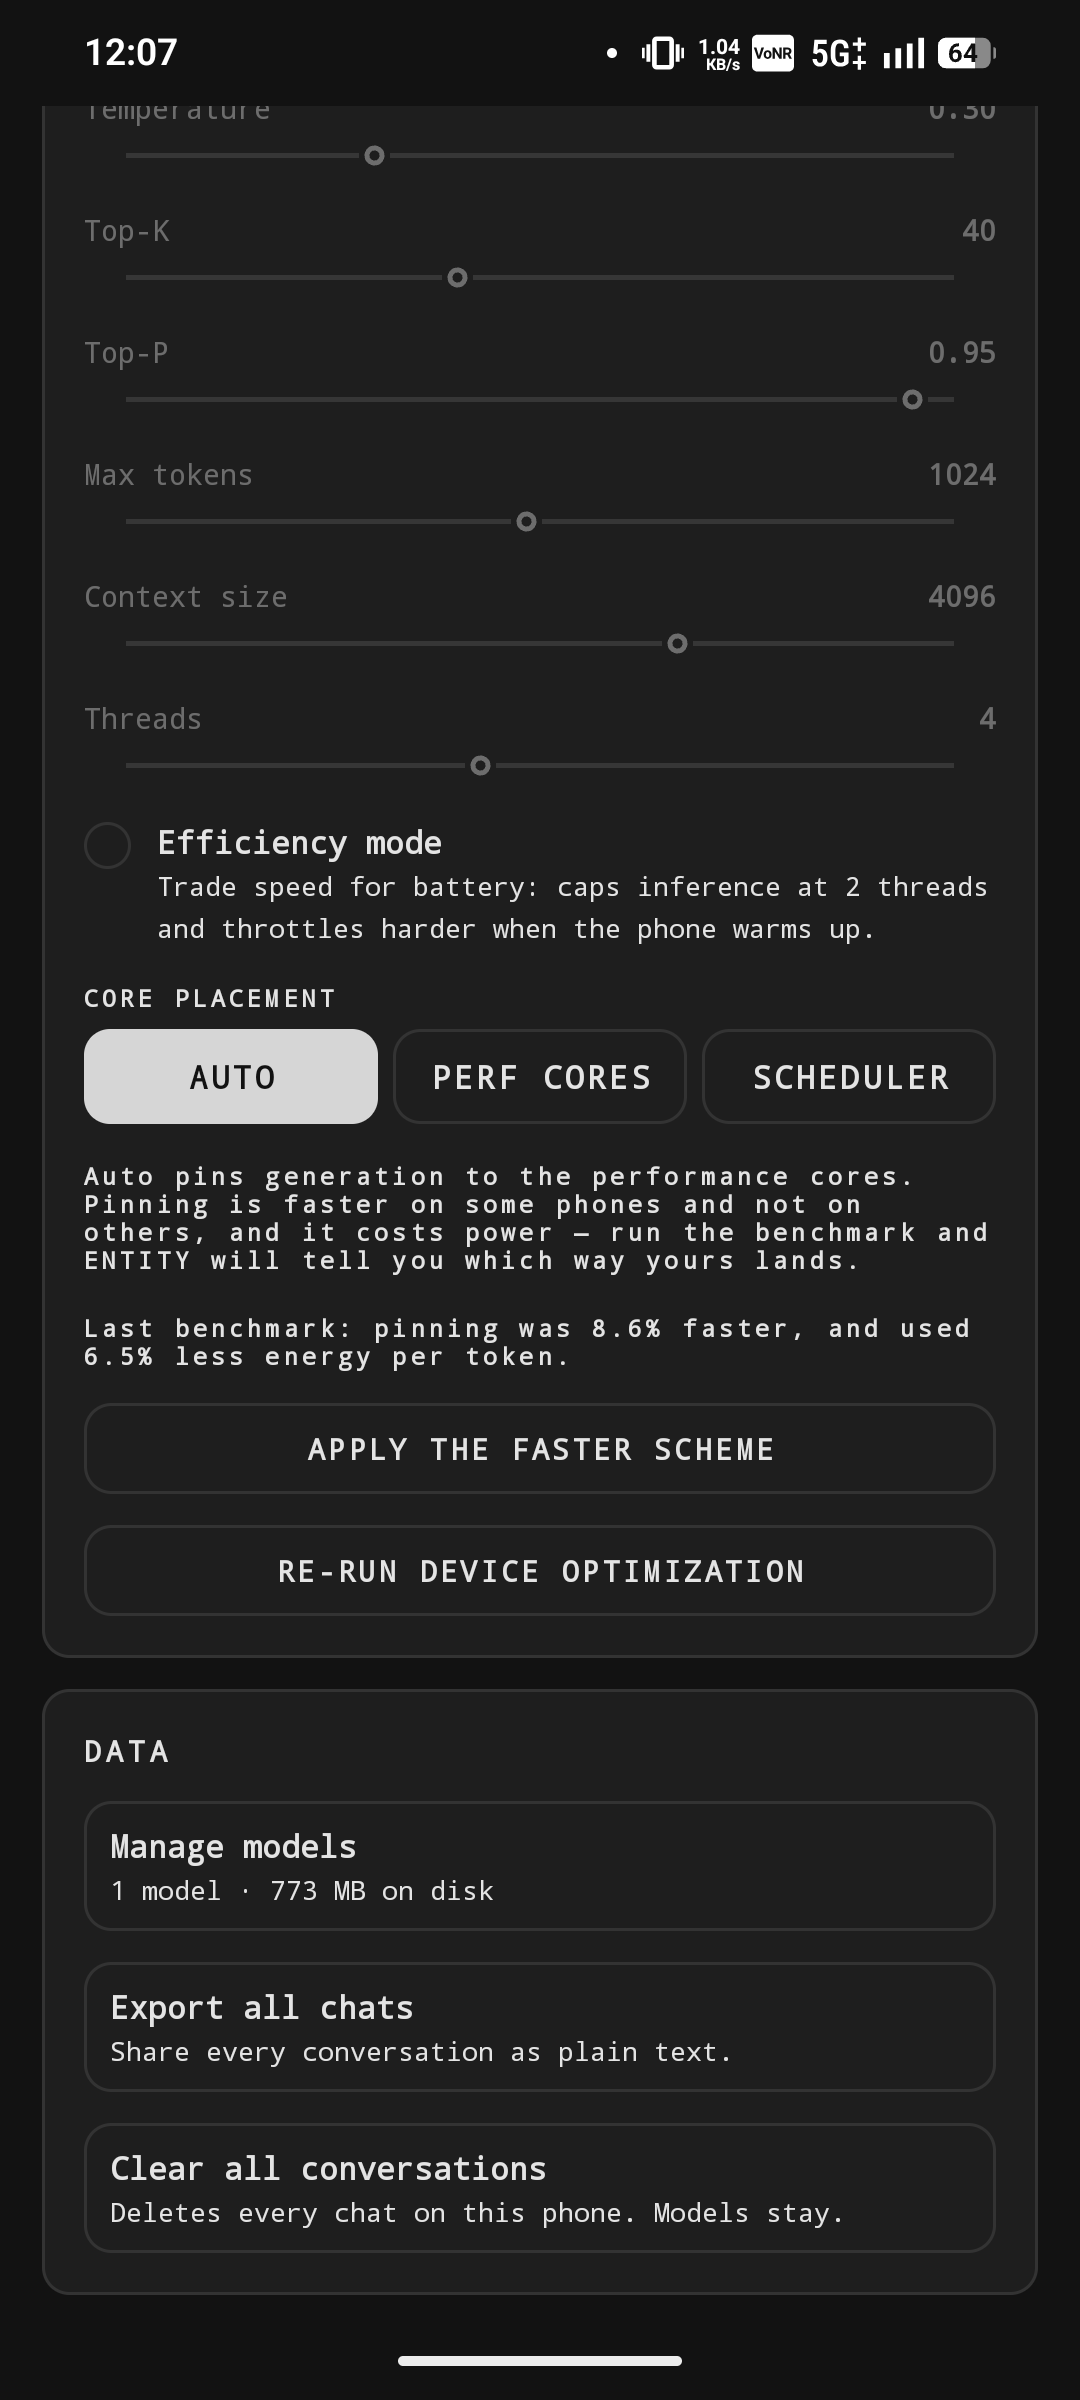
Settings_3 Page
-
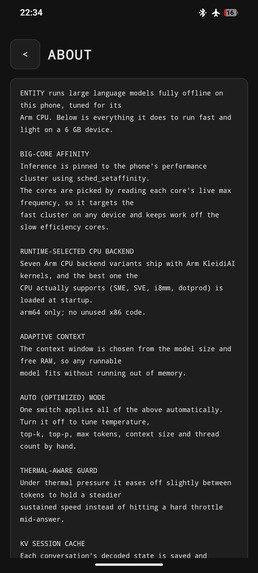
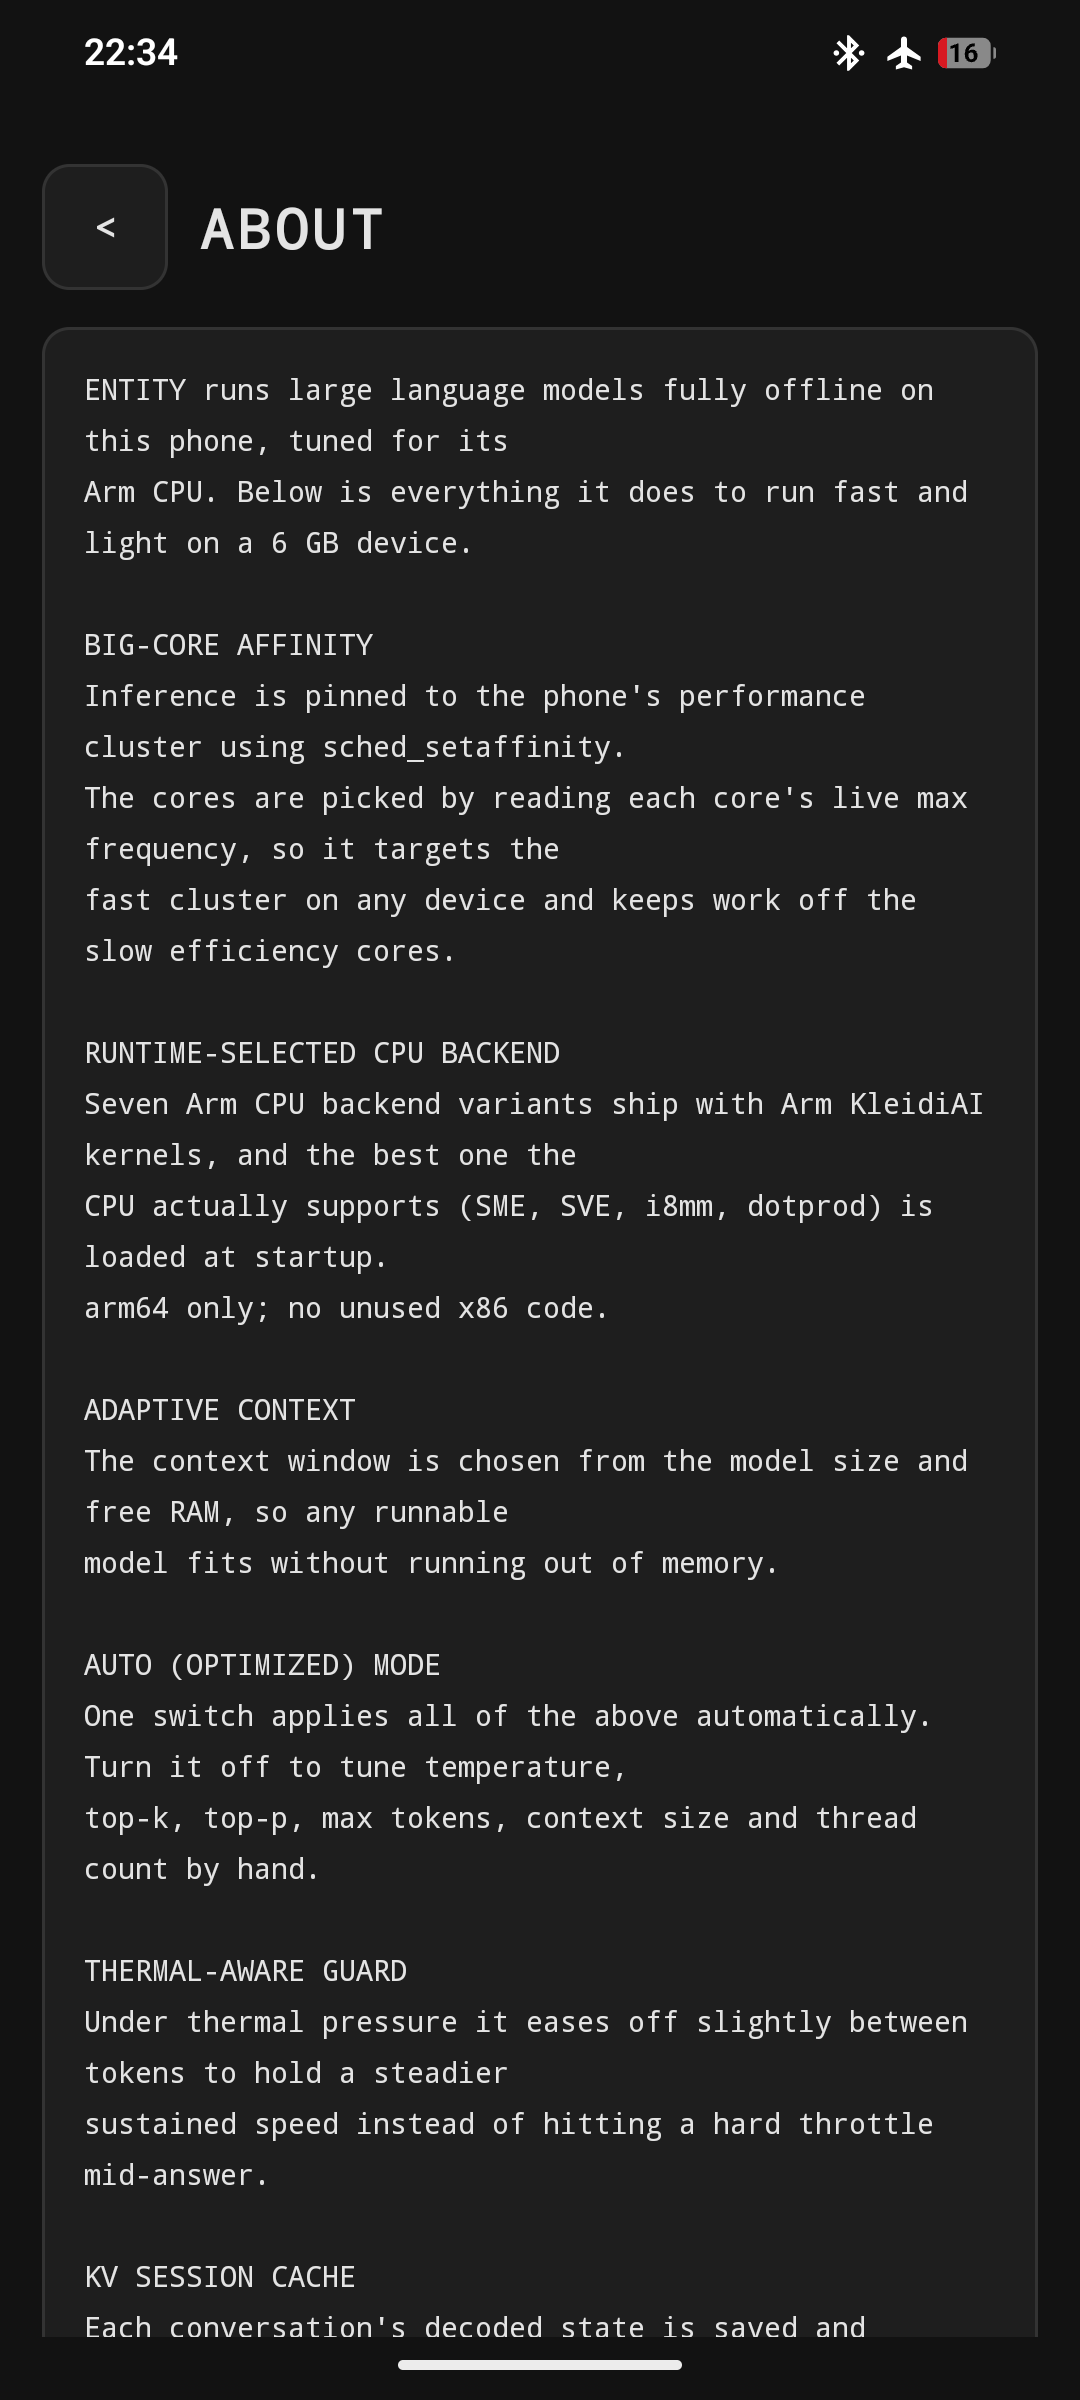
About Page
Inspiration
ENTITY generates tokens 47% faster than Arm's own reference app, on Arm's own silicon, running the identical model file in a matched session. Time to first token fell 3.4x. The same 128 token reply costs 42% less battery. And the fix underneath it is merged into llama.cpp, reviewed by Arm's own KleidiAI maintainer.
Give me an Arm phone and an LLM. ENTITY examines the silicon, chooses the execution strategy, runs the model offline, measures the CPU, thermal state, power and tokens/watt and lets you experimentally prove whether its optimization actually helped.
Then the part I did not plan: I built a benchmark to prove my headline optimization and it proved me wrong. Three times, including once about my own retraction.
Can a normal Arm phone run a useful private AI assistant fully offline if the software is designed for the hardware instead of treated like a small desktop? Most on-device demos stop at "it runs." I wanted speed, memory fit, thermal stability and battery cost — so ENTITY became an adaptive LLM runtime for Arm phones rather than only a chat app.
The challenge judges performance per watt. The same 128-token reply costs 42% less battery on the tuned path (86 J against 50 J), and on a Snapdragon 6 Gen 4 the tuned path holds decode flat while lifting tokens per watt 6.80 to 9.85, up 45% — measured unplugged on the phone, not inferred from a token rate.
Why you can trust those numbers
The same method repeatedly destroyed my own claims. Six acts:
- I credited a +121% decode gain to pinning threads to the big cores, and shipped it.
- A three arm ablation said the thread count earned the whole multiplier and pinning roughly nothing. I published the retraction instead of the headline.
- A fourth arm, a second vendor and five runs per arm said the correction went too far: pinning gains 21% decode on MediaTek, and on Qualcomm no decode but 30% less power.
- I shipped a way for other people to benchmark phones I do not own, and new SoCs falsified a prediction in my own optimization document. My thread rule counted cores within 10% of the fastest clock; every modern flagship puts its prime core 17-20% above its own big cluster, so the rule collapsed to one core and prefill had been running on two threads on every flagship. Both of my phones were structurally immune.
- The dataset came for my energy claim: isolated properly the median was +0.6% decode, -1.5% tok/W, positive on 3 of 6 rows. I stopped asserting it and made it a setting.
- Then the dataset falsified my retraction. A Dimensity 7300 came back at +24.0% decode on 7.9% less power, tok/W up 34.4%. The median across 15 rows is a flat +0.7% but the range runs -8.5% to +29.3% and both ends are real. The sign is device dependent and unpredictable from the spec sheet — which is why shipping it as a setting was right even though my reasoning was wrong.
Revising upward on your own evidence is the harder half. Nothing about it looks humble.
And the question nobody asks until they do: does the speedup change the answer?
Every speed number above comes from changing how work is scheduled, so the assumption is that only the wait gets shorter. That assumption is not free: ggml splits a row's dot product across threads and sums the partials, so the thread count fixes the order of a floating-point reduction — and floating-point addition is not associative. This project already depends on the effect being real (my perplexity sweep pins its thread count for exactly that reason), and I had never measured it.
Four arms, one device, greedy decoding at a fixed seed plus per-chunk perplexity over wikitext-2. 8 threads against the shipped 4 — the only pair where the reduction width actually changes, and the baseline the decode gain is measured from — produced the same 96 tokens byte for byte and the same twelve per-chunk perplexity values. Final PPL 19.2128 on all four.
Three controls, because a broken test also prints "identical": the reference arm run twice must match, and did; the same arm with one word added must differ, and did; and the same arm over 3 chunks instead of 12 must differ — which it does, chunk 1 scoring 8.3443 against 8.3423 on the same 512 tokens. Perplexity packs chunks into one batch, so the chunk total changes how many sequences are scored together and therefore the shape of the matmuls scoring them. The instrument moves when the arithmetic is reorganized, by two parts in ten thousand. Doubling the thread count and crossing from the A78 cluster to the A55 cluster moved it by zero.
Not a claim of bit-exactness — the series prints to four decimals and greedy decoding is a blunt
detector. But "output is unchanged" is now measured rather than assumed; raw files in
quant-lab/results/equivalence/.
And the last one: how much of this is Arm the architecture, and how much is Arm the platform?
Every optimization above works by reading and steering the hardware — which cores are fast, what they are clocked at, where a thread lands, what the battery is drawing, which Arm ISA extensions the binary can dispatch to. So here is the uncomfortable question: is any of that about arm64, or is it all about Android exposing arm64?
There is a control for this, and it is the best one available. Apple silicon is also arm64. Same architecture, same big.LITTLE shape, same class of quantized model, very fast. It just refuses to let an application see or steer any of it.
I ported the intent to iOS and counted what survived. Six of ten mechanisms are removed or crippled. Four are gone outright — per-core frequency, ADPF hints, energy telemetry, and multi-variant v8.0–v9.2 backend dispatch, because iOS cannot load code outside the signed bundle. Two survive only degraded: core placement becomes a QoS request the scheduler need not honour and will not confirm, where Android reads the applied CPU mask back; and a temperature becomes four coarse levels. One is genuinely better: Apple reports the P-core count exactly, where Android makes you parse per-core max frequency — the heuristic this project already had to correct once.
Measured on an iPhone 16 and an iPhone 17 Pro Max with real int8 ONNX inference:
- The runtime settles on one thread and reports
affinity: unavailable. A second thread costs +16.8% on the A18 and +11.4% on the A19 Pro — on Android the thread count is my single largest earner; here it is a straight loss, because nothing can say which core it may use. - KleidiAI still pays — 1.089× and 1.045× — the one mechanism crossing the boundary intact. Both phones report SME and SME2, which none of my Android SoCs have, and it changes nothing: one static binary, no variant to select.
- The base iPhone 16 beats the 17 Pro Max at peak, 76.7 against 74.0 tok/s, then gives up 11% over six sustained windows while the Pro Max holds flat.
Four of my ten mechanisms are gone outright on Apple silicon and two more survive only as
requests I cannot verify. That is the honest
scope of this project's thesis, and it took a second arm64 platform to measure it. No energy
numbers from iOS: the platform exposes no battery current, so tokens-per-watt stays an
Android claim. Full analysis in docs/PORTABILITY-ARM-VS-APPLE-SILICON.md, raw exports in
benchmarks/results/ios/.
What it does
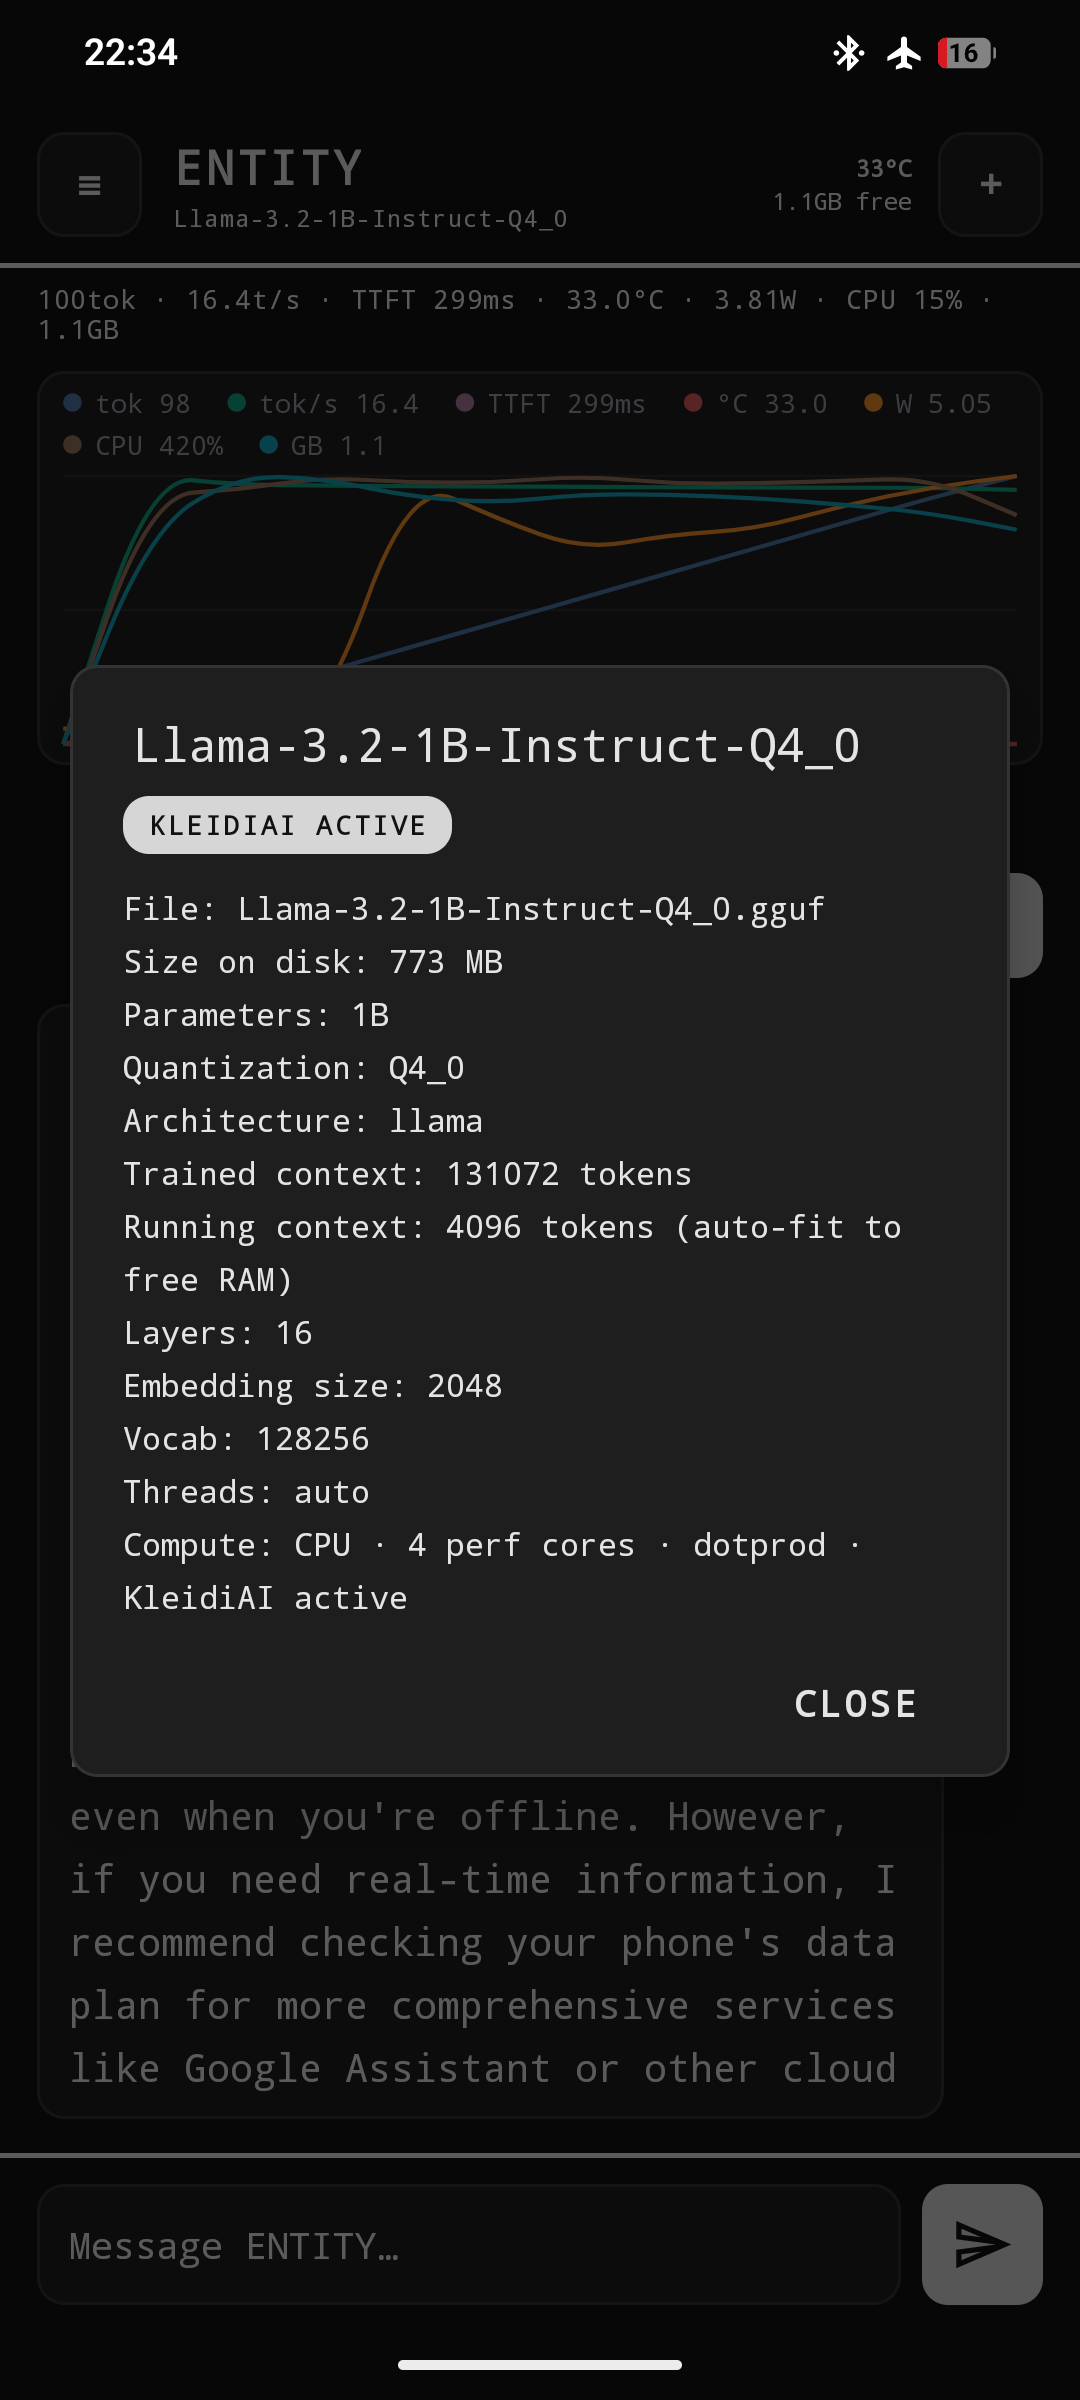
A fully offline Android assistant running GGUF models on device, built around big.LITTLE topology, limited RAM, thermal limits and battery.
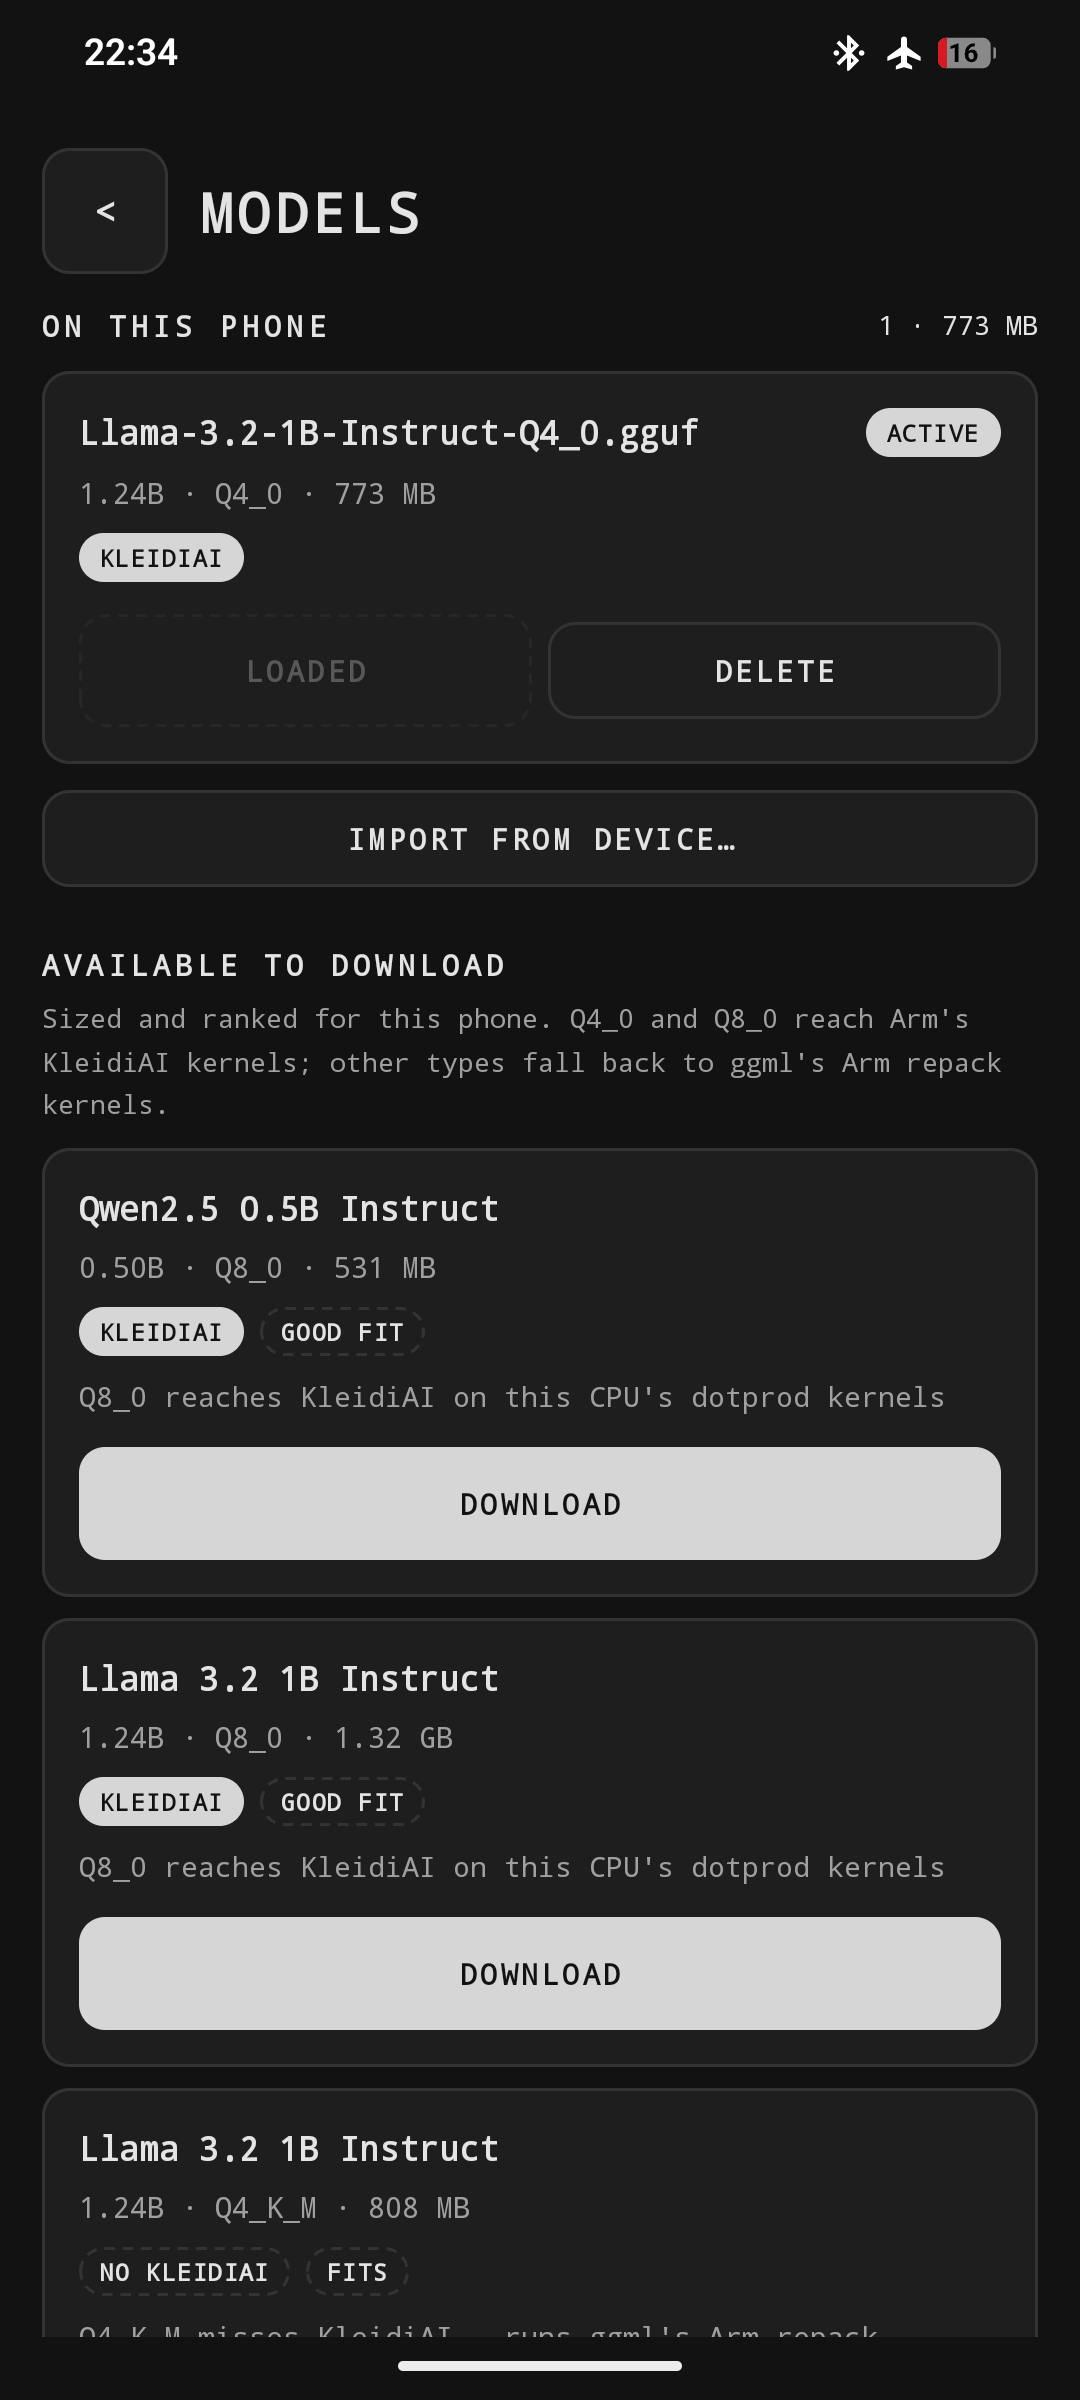
- a 19 entry catalog across seven vendors, 0.36B to 7B, each judged against free memory
- a device probe predicting decode and prefill in about 60 ms with nothing downloaded
- a Core placement setting (Auto, performance cores, scheduler) that runs the comparison on your phone and reports which won, rather than asserting either
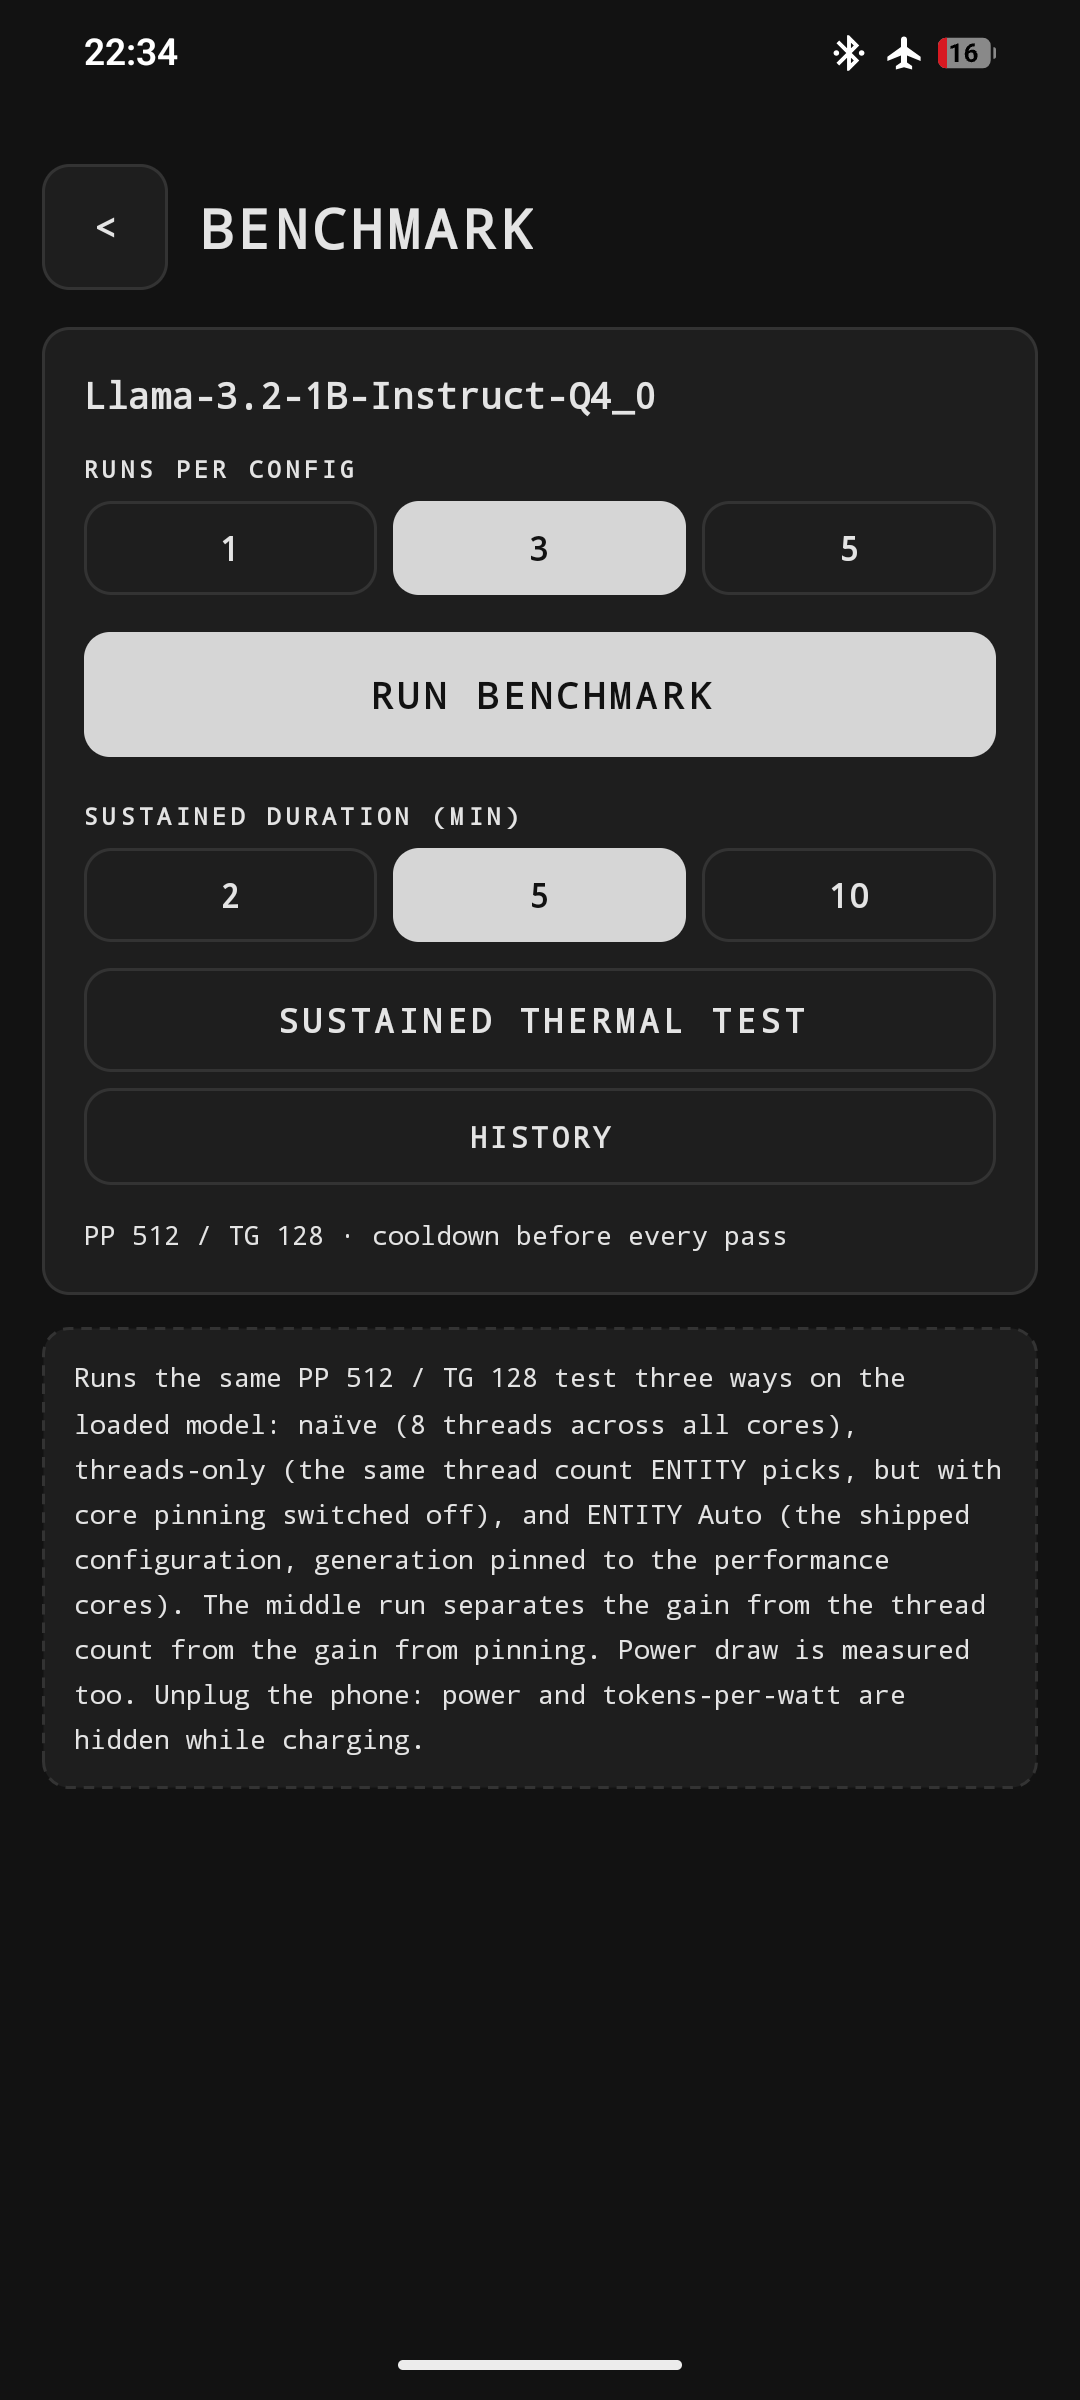
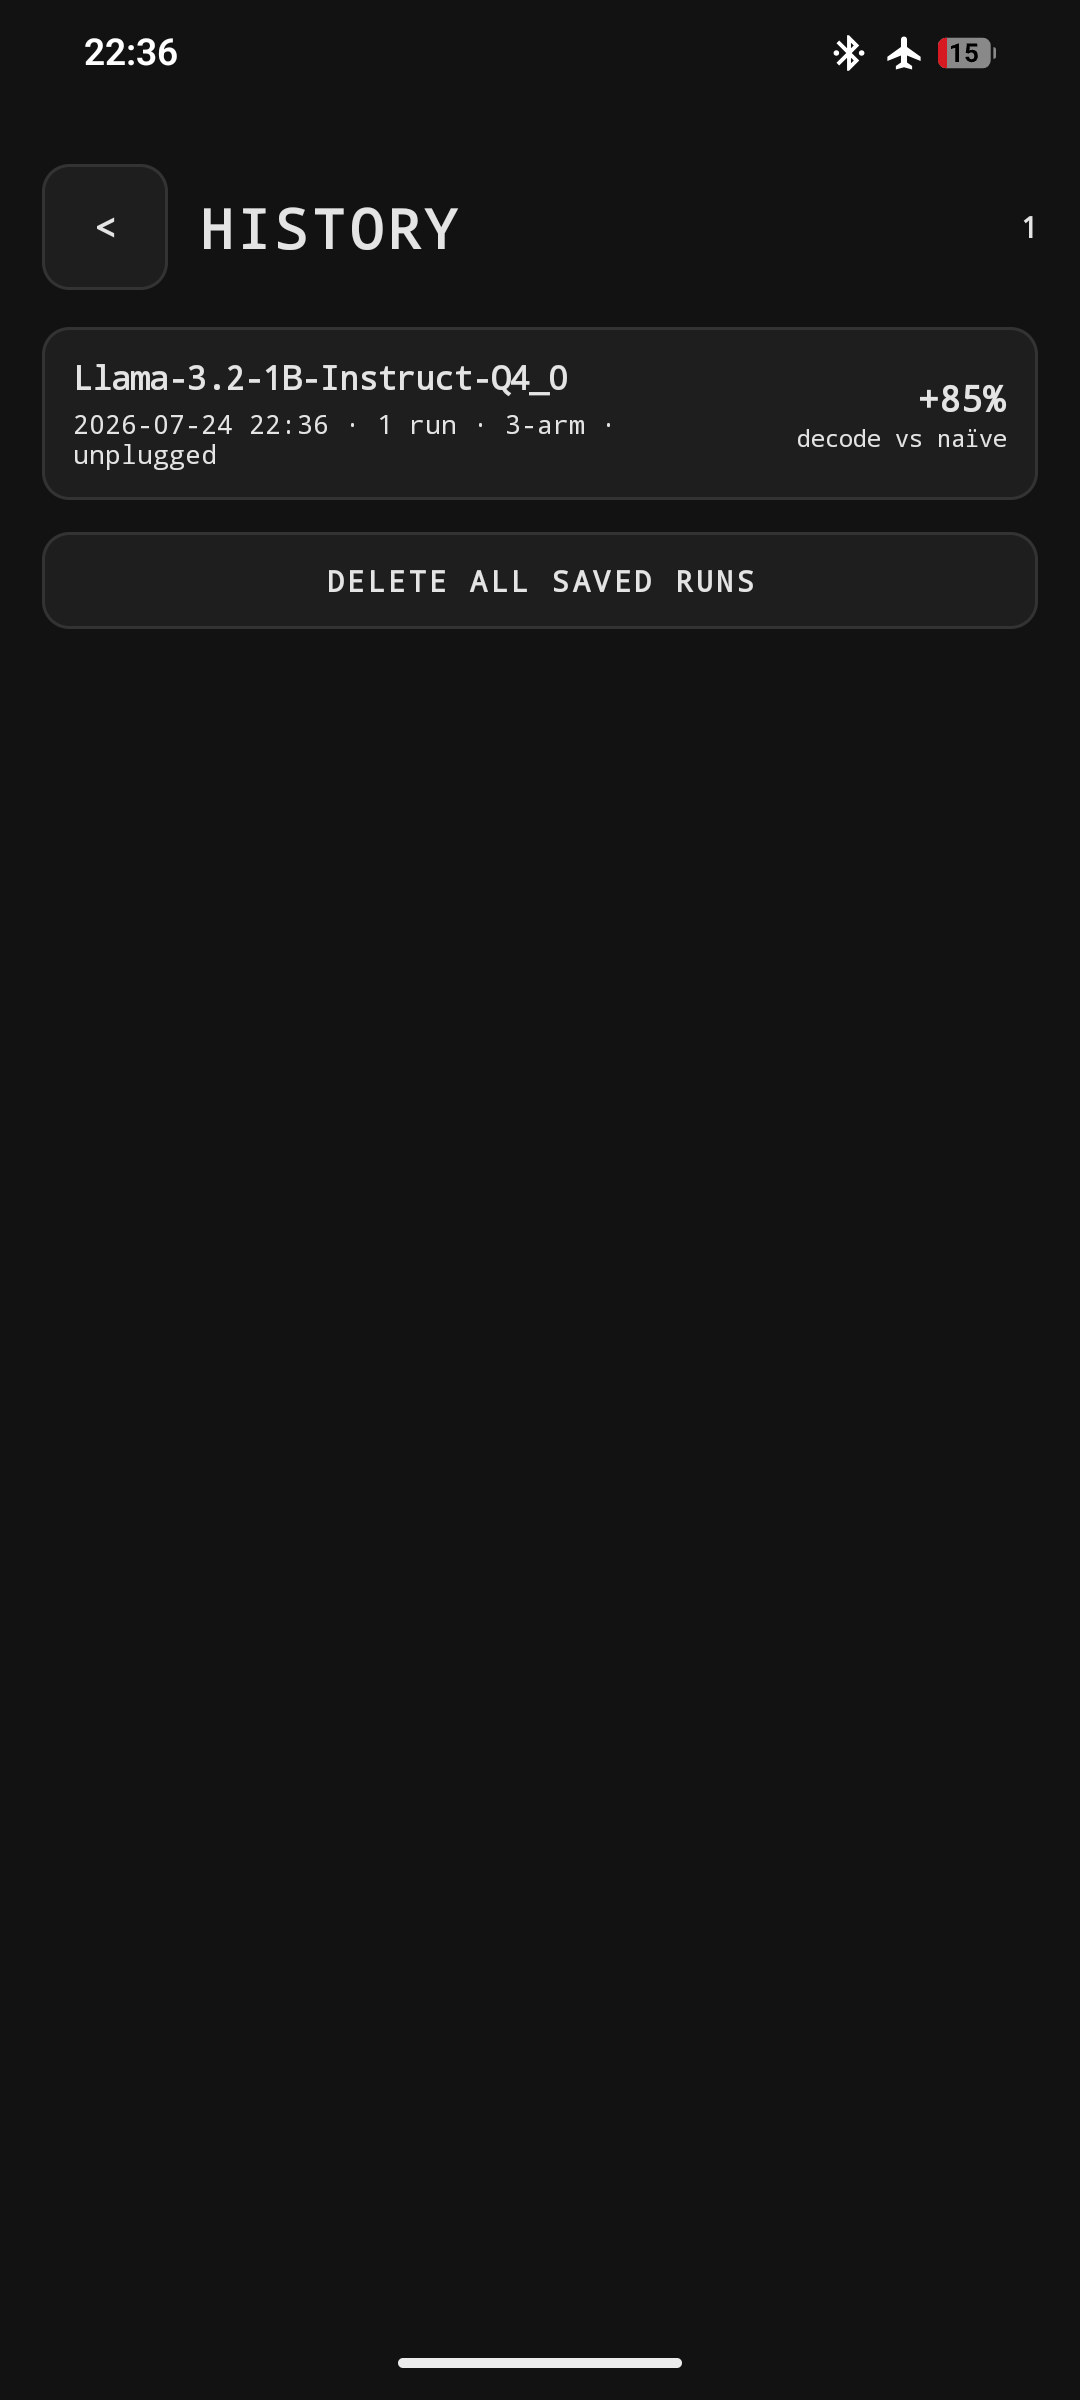
- an in app three arm ablation with median ± stddev, thermal cooldown, TTFT and CSV export, and ENTITY Bench as a second standalone app over the same measurement core — plus a fourth efficiency arm on the LITTLE cluster and a sustained thermal mode
- an output equivalence lab: four scheduling arms, greedy decoding at a fixed seed and per-chunk perplexity, with three controls — proving the speedups change the wait and not the answer
- an Apple silicon control: the same intent ported to iOS, where six of the ten optimizations are removed or crippled, measured on two iPhones to bound how much of the thesis is Arm-the-platform rather than Arm-the-architecture
- streaming chat with Stop, Markdown, Canvas drawn LaTeX, persistent conversations re primed from saved history, adaptive context, Efficiency mode and live metrics
How we built it
Merged into llama.cpp, reviewed by Arm
PR #25701 —
kleidiai : warn once when a weight type has no KleidiAI kernelMerged 2026-07-21 as
fb0e6b6. Approved bychaxu01, Arm's KleidiAI backend maintainer, plustaronaeoandam17an.
The finding below is not only in my app. It is in yours, if you use llama.cpp on Arm.
The interesting part is where the warning had to go. The obvious hook is supports_op(), which
ggml calls to ask whether a backend can handle a node. But the scheduler calls it speculatively
while planning a graph, on nodes that may never execute. A one shot flag consumed there fires on
work that never runs and stays silent on work that does.
So the warning lives in get_tensor_traits(), which is only reached when a tensor is actually about
to be dispatched:
// fires on real dispatch, not on a scheduler probe
static ggml_kleidiai_kernels * get_tensor_traits(const ggml_tensor * op) {
    if (!kernel_found_for(op->type)) {
        static std::once_flag warned;
        std::call_once(warned, [&] {
            GGML_LOG_WARN("kleidiai: no kernel for %s, falling back\n",
                          ggml_type_name(op->type));
        });
    }
    ...
}
One flag, one line of output, fired exactly once per process on the first genuine fallback. The patch shipped with the measurement that motivated it: 121 tok/s on Q4_0 against 43 tok/s on Q3_K_L, same phone, same config.
Architecture: how the thing is actually built
ENTITY (chat)  ─┐                    ┌─ ENTITY Bench (instrument)
 Kotlin UI,     │                    │   BenchRunner, CSV export,
 SQLite chats   └────────┬───────────┘   uploader — no chat surface
                :lib  com.arm.aichat   ← byte identical in both apps
     InferenceEngine · StateFlow<State> · Flow<String> · gguf/TensorCensus
                         │ JNI
              ai_chat.cpp  build_fast_cpu_set · pin_to_fast_cores
              prompt_thread_count · decode_tokens_in_batches · shift_context
                         │
     llama.cpp / ggml (upstream, unvendored)
       GGML_CPU_ALL_VARIANTS=ON → 7 backends, armv8.0 … armv9.2
       GGML_CPU_KLEIDIAI=ON     → Arm matmul kernels for Q4_0 / Q8_0
The :lib boundary is the design decision that matters. Everything Arm specific sits below a
Kotlin interface exposing only coroutine primitives — a StateFlow<State> and a Flow<String> of
tokens. The UI cannot reach a thread mask or a CPU set. That is why ENTITY Bench exists at all: a
different app with a different UI over a byte identical measurement core, which is the only
reason its numbers are comparable to the chat app's. A benchmark that measures a different binary
than it ships measures nothing.
Two Arm decisions live below that boundary and are worth naming here because everything else
follows from them. Build: GGML_CPU_ALL_VARIANTS=ON compiles seven CPU backends and ggml
scores them against the physical CPU at load, so an armv8.0 phone with no dotprod gets a working
baseline instead of SIGILL — a build decision, not hand-written kernels, and the reason a Helio
G37 could contribute a run at all. Placement: build_fast_cpu_set() ranks online cores by live
cpuinfo_max_freq with no vendor table, and pin_to_fast_cores() re-applies
sched_setaffinity at every decode entry point, because ggml's pool spawns workers lazily and they
inherit the calling thread's mask — a pin applied once at startup silently does nothing.
And the layer that nearly ruined it: the UI. Three binder calls and a graph redraw per token, on the main thread, against four decode threads pinned to the same big cores.
The physics: why the two phases want opposite things
Everything else follows from one ratio, so it is worth deriving first. A decoder layer's cost is
dominated by weight matmuls; for P parameters and N tokens pushed through together, counting a
multiply-accumulate as 2 FLOP:
$$ F_{\text{prefill}} = 2PN, \qquad F_{\text{decode}} = 2P \ \text{per token} $$
Both phases read every weight once per step, so both move the same B bytes. Arithmetic
intensity — FLOPs per byte fetched — is therefore:
$$ I_{\text{prefill}} = \frac{2PN}{B}, \qquad I_{\text{decode}} = \frac{2P}{B}, \qquad \boxed{\ \frac{I_{\text{prefill}}}{I_{\text{decode}}} = N\ } $$
The two phases differ in arithmetic intensity by exactly the prompt length — not by a constant
factor or an implementation detail. Prefill amortises one weight fetch over N tokens, decode over
one.
Now put real numbers on it. Llama-3.2-1B Q4_0, P = 1.24e9, B = 773.0 MB, N = 512, measured on
the Dimensity 7300 at 128.2 tok/s prefill and 18.2 tok/s decode:
$$ \text{achieved compute} = \frac{2PN}{N/r_{\text{pre}}} = 2P\,r_{\text{pre}} = 318\ \text{GFLOP/s} $$ $$ \text{achieved bandwidth} = B\,r_{\text{dec}} = 0.773\ \text{GB} \times 18.2 = 14.07\ \text{GB/s} $$
The machine balance, the intensity at which this phone stops being bandwidth limited and starts being compute limited, is the ratio of those two:
$$ \beta = \frac{318\ \text{GFLOP/s}}{14.07\ \text{GB/s}} = 22.6\ \text{FLOP/byte} $$
$$ I_{\text{prefill}} = \frac{2(1.24{\times}10^9)(512)}{7.73{\times}10^8} = 1643 \gg \beta \qquad I_{\text{decode}} = \frac{2(1.24{\times}10^9)}{7.73{\times}10^8} = 3.21 \ll \beta $$
Prefill sits 73x above the balance point and decode sits 7x below it. Prefill is compute bound and answers to kernels. Decode is bandwidth bound and answers to bytes per weight. Every result below is a consequence, and any optimization that helps one usually hurts the other.
Finding 1: an acceleration library that loads, advertises itself and never runs
Arm's KleidiAI ships hand tuned matmul kernels for exactly two GGUF quantizations, Q4_0 and Q8_0. Load anything else and ggml silently falls back to generic kernels. Nothing in any log, any API or any app tells you. Every benchmark I published before v2.1.0 used Q3_K_L, so Arm's kernels had never run once.
| Q3_K_L (no Arm fast path) | Q4_0 (Arm fast path) | Change | |
|---|---|---|---|
| Prompt throughput | 42.7 tok/s | 121 tok/s | +183% |
| Derived TTFT | 12,050 ms | 4,299 ms | -64% |
| Decode throughput | 16.9 tok/s | 14.7 tok/s | -13% |
The roofline predicts that asymmetry exactly. Prefill is compute bound, so a faster kernel raises it. Decode is bandwidth bound and Q3_K_L is the smaller file, so decode moves the other way. Time to first token on the 1B model dropped from 13,440 ms to 3,918 ms, a 3.4x improvement, larger than every scheduling decision in this project combined.
One caveat I put in myself: that is a quantization-level result, not an attribution to KleidiAI alone — Q4_0 switches on KleidiAI's kernels and ggml's Arm repack path together, and I have not run the build that isolates them. The structural finding stands: a K-quant reaches neither, silently.
Shipped three ways so it is worth something to people who never install ENTITY: an in-app advisor, a
standalone guide (docs/KLEIDIAI-QUANTS.md), and an upstream fix merged into llama.cpp
(PR #25701, merged 2026-07-21 as fb0e6b6,
reviewed by Arm's KleidiAI backend maintainer) — so the silent fallback now warns every llama.cpp
user rather than only mine.
Finding 2: a file named Q4_0 is only 76% Q4_0
The advisor above reads one metadata key, general.file_type, which says what a model was broadly
quantized to and not what is in the file. So I parsed the tensor table.
GGUF block quantizations carry a scale per 32-weight block, so effective widths are
Q4_0 = 4.5, Q4_1 = 5.0, Q6_K = 6.5625 and Q8_0 = 8.5 bits per weight.
| Tensor | Type | Parameters | Bytes |
|---|---|---|---|
| 110 block weights | Q4_0 | 939.5M | 528.5 MB |
token_embd.weight |
Q6_K | 262.7M | 215.5 MB |
two ffn_down |
Q4_1 | 33.6M | 21.0 MB |
Summing n_i b_i / 8 gives 765.0 MB against 773.0 MB actual — a 1% gap that is metadata, so
the census is right. 24% of the weights never reach KleidiAI
whatever the filename says — and Llama 3.2 ties its embeddings, so that Q6_K tensor is also the
output projection, the single largest matmul in the model.
Obviously worth fixing. I wrote the prediction down first: promote it to Q8_0, coverage goes to 97%,
prefill gets faster, decode gets slower because the tensor grows by
262.7e6 × (8.5-6.5625)/8 = +63.6 MB (+8.2%), to 836.6 MB.
| Q4_0 (76% eligible) | Q4_0-kopt (97% eligible) | change | |
|---|---|---|---|
| Prefill, pp512 | 125.69 ± 1.43 tok/s | 121.84 ± 3.00 tok/s | -3.1% |
| Decode, tg128 | 17.99 ± 0.15 tok/s | 15.94 ± 0.77 tok/s | -11.4% |
Slower on both. The prediction was wrong in the half I was confident about, and the arithmetic
says why. llama.cpp computes logits only for the last prompt position, so the output projection
runs once per prefill rather than N times — its share of prefill work is
262.7e6 / (1.24e9 × 512) = 0.041%. Promoting it can move prefill by at most four hundredths of a
percent, while the extra bytes cost every other tensor. In decode it runs every token, so the
bandwidth model predicts 14.07 / 0.8366 = 16.8 tok/s — -6.5% predicted against -11.4% measured.
Right sign, right order, short by a factor the simple model omits. Coverage is not
throughput. The 24% figure is true and it is not costing this model any speed. The rebuilt file is
published as a negative result and kept out of the catalog. What shipped is narrower: the app now
reports the measured fraction from the tensor table instead of a boolean from a filename.
The bandwidth model also predicts across quantizations, which is the test that it is a model and not
a fit: the same weights at Q8_0 give B = 1.318 GB and 14.07 / 1.318 = 10.7 tok/s predicted
against 11.5 measured, +8%.
The quality column this project owed
Perplexity on wikitext-2, six same source quants, so the speed story is not the only story:
| Quant | Perplexity | vs F16 | Bytes | KleidiAI coverage |
|---|---|---|---|---|
| F16 (reference) | 14.2580 | — | 2,479,595,360 | n/a |
| Q8_0 | 14.2705 | +0.09% | 1,321,082,720 | 100% |
| Q4_K_M | 14.7346 | +3.34% | 807,694,176 | 0% |
| Q4_0 imatrix (catalog) | 15.6159 | +9.52% | 773,025,856 | 76% |
| Q3_K_L | 16.0927 | +12.87% | 732,524,384 | 0% |
| Q4_0 no imatrix | 16.5272 | +15.92% | 770,928,480 | 79% |
Q4_0 costs 5.6% perplexity against Q4_K_M for 4.5% fewer bytes. That is the price of the prompt win above, now a figure rather than a hedge. Q8_0 is nearly lossless at +0.09% and reaches 100% coverage, and the roofline says exactly why it is still the wrong default: 71% more bytes on the bandwidth bound phase. The app surfaces the trade on the model card instead of spending it for you.
Finding 3: the GPU is right there, and it loses by 30x
Everything above optimizes the CPU. That was a design decision, and a design decision is not a result — "we chose the CPU" and "the CPU is the right choice here" are different claims and only the second one is evidence. The phone has a Mali GPU advertising Vulkan compute, so the alternative was testable rather than hypothetical. I built llama.cpp's Vulkan backend for arm64 and ran both arms from the same binary, same model, same PP512/TG128, three reps, cooldown before each:
| Backend | Prompt | Decode |
|---|---|---|
| CPU, 4 threads pinned | 142.42 ± 0.80 | 14.91 ± 1.19 |
| Vulkan, all layers on GPU | 4.70 ± 0.03 | 7.97 ± 0.09 |
30.3x slower on prompt, 1.9x on decode. And the GPU explains itself in the line it prints at
startup: Mali-G615 MC2 | int dot: 0 | matrix cores: none. Q4_0 inference is integer matmul, and
that is exactly the instruction class the ISA ladder prices at 4.79x on this CPU — so the same
workload has a hardware path on the CPU and none on the GPU, and falls back to generic shader
arithmetic. The asymmetry is the mechanism: prompt is compute bound and collapses, decode is
bandwidth bound and both processors wait on the same memory.
There is no NPU arm, for a structural reason worth stating rather than omitting: llama.cpp has
no NNAPI backend at all. ggml/src ships cpu, vulkan, opencl, cuda, metal and others, and nothing
for Android's neural network API — so for this stack the question has an answer before any
measurement.
The first run of this measured the CPU arm at 4.69 tok/s prompt, 32x below what the same silicon
does in the shipped build, which would have made the GPU look competitive. The control was the
fault: with a Vulkan device registered, -ngl 0 still routes work to it. -dev none removes the
device from the registry and the CPU arm returns to 142–158. It was caught because the number
disagreed with a measurement already published — which is the entire reason for keeping the earlier
one.
The algorithms
1. Frequency ranked core selection, and the straggler bound
For every online core i ENTITY reads cpuinfo_max_freq, sorts descending, and takes the fastest:
$$ T_{\mathrm{gen}}=\min!\left(4,\max!\left(2,N_{\mathrm{online}}-2\right)\right),\qquad S_{\mathrm{gen}}={\pi_0,\ldots,\pi_{T_{\mathrm{gen}}-1}} $$
Sgen becomes the affinity mask for sched_setaffinity. Why fewer threads win: ggml splits each
parallel region into T equal shares and cannot retire it until the last thread finishes. With core
throughput c[i] and work W, the step is set by the slowest core admitted:
$$ t(T)=\frac{W}{T}\max_{i<T}\frac{1}{c_{\pi_i}}=\frac{W}{T\,c_{\pi_{T-1}}} \qquad\Longrightarrow\qquad r(T)=\frac{T\,c_{\pi_{T-1}}}{W} $$
Throughput is proportional to thread count times the capacity of the weakest core you let in.
Admitting core T therefore pays only when:
$$ \frac{r(T{+}1)}{r(T)}=\frac{T{+}1}{T}\cdot\frac{c_{\pi_T}}{c_{\pi_{T-1}}}>1 \qquad\Longleftrightarrow\qquad c_{\pi_T}>\frac{T}{T+1}c_{\pi_{T-1}} $$
On a 4+4 phone, going from 4 big cores to 4 big plus 4 little:
$$ \frac{r(4)}{r(8)}=\frac{4c_b}{8c_l}=\frac{c_b}{2c_l} $$
For A78 against A55, c_b/c_l ≈ 3, predicting 1.5x from halving the thread count. Measured on
the Dimensity 7300: 1.39x. Close enough to be the mechanism, not close enough to be a fit. The
gap is synchronization and memory contention the model omits.
Where the model breaks, stated because it matters. On the contributed Helio G37 every core is a
Cortex-A53, so c_b/c_l is a clock ratio of 2301/1800 = 1.28 and the bound predicts eight threads
should win. Four threads measured 1.34x faster. Capacity is not proportional to clock even
within one microarchitecture, and equal division fails once bandwidth rather than compute binds. I
keep the model for intuition and do not promote it to a predictor.
The same bound applies to prefill, which is why Auto no longer widens it to all cores: 135 tok/s on the 4 fast cores against 86 across all 8.
2. Memory aware context admission
The KV cache is the one runtime allocation that scales with a user setting: S_kv = 2·L·H_kv·d_h·C·p.
For Llama-3.2-1B (L=16, H_kv=8, d_h=64, p=2) that is 32 KB per token, so C=8192 costs
268 MB and C=2048 costs 67 MB. Weights are mmap-backed and evictable; the KV cache is not. Hence
an explicit, inspectable admission rule over file size M (GB) and free RAM F (GiB): 8192 when
M<1.6 and F>3.0; 2048 when M≥1.6 and F≤2.2; 4096 between.
3. Thermal back off
Android thermal status as a cooperative signal, checked every eighth token from a cache refreshed at most once per second so binder work stays out of the token loop: 0 ms at NONE/LIGHT, 6 ms at MODERATE, 12 ms at SEVERE and above, doubled in efficiency mode. It does not change the model, fabricate a reading or request privileged scheduling.
4. Power, efficiency, and rejecting bad data
Both common OEM interpretations of BATTERY_PROPERTY_CURRENT_NOW are evaluated and the physically
plausible one kept — µA and mA both computed, and whichever lands in 0.05–15 W wins. Rows are then
rejected by stated predicates, not judgement: exclude if RSD > 0.25, or max(P̄)/min(P̄) > 4
across arms, or P̄_decode < 0.8 W. One contributed arm reads 6.72 ± 5.95 tok/s, an 88.5% RSD, so
any ratio built on it is fiction. Charging runs never contribute power, and excluded rows stay
visible with the reason printed.
5. The ablation identity
Results are median ± population standard deviation over three to five runs. The whole methodology is one identity: the headline multiplier factors into a thread-count term and a pinning term, and a two-arm experiment measures only their product.
$$ rac{r_{mathrm{opt}}}{r_{mathrm{naive}}} = rac{r_{mathrm{thr}}}{r_{mathrm{naive}}} imes rac{r_{mathrm{opt}}}{r_{mathrm{thr}}} qquadLongrightarrowqquad 1.68 = 1.39 imes 1.21 $$
Left to right: total gain, the share the thread count earned, the share pinning added. My v2.0.0
submission reported the total and attributed all of it to pinning. No two-arm design can license
that step, whatever the error bars. Across the contributed dataset the factors separate cleanly:
M_threads ∈ [1.34, 4.25], M_pin ∈ [0.915, 1.293] with median 1.007. The first is the
optimization; the second is a per-device correction.
6. Energy, and why tok/W alone says nothing
Energy integrates the measured power curve rather than being inferred from a rate, which makes
E_naive / E_opt the product of a power ratio and a speed ratio. Every arm draws roughly the same
watts, so the first factor is near 1 and the energy win is the speed win: 128 tokens cost 86 J
naive against 50 J optimized, down 42%, by finishing in 11.8 s instead of 19.9 s rather than by
sipping less current. It also means any app quoting tok/W without quoting duration has said nothing.
7. Predicting a model before downloading it
The catalog used to rank on RAM and ISA flags, which answers "will it fit" and not "will it be usable". A 4 GB phone could be told a 3B model fits and still find it decodes at 3 tok/s, after a 2 GB download. The roofline makes both phases predictable from two microbenchmarks and one calibrated anchor:
$$ r_{\mathrm{dec}} = R_{\mathrm{dec}}\cdot\frac{W}{W_a}\cdot\frac{B_a}{B} \qquad r_{\mathrm{pre}} = R_{\mathrm{pre}}\cdot\frac{K}{K_a}\cdot\frac{P_a}{P}\cdot g $$
Capitals are the anchor device's measured values and a marks its readings, so every factor is a
ratio of like against like. W is bandwidth from a 32 MB arraycopy — large enough that no
last-level cache holds it, so it reads DRAM. K is a dependency-chained integer MAC rate, integer
on purpose because a float benchmark would rank a phone with strong FP and weak integer units far
too highly. B is model bytes, P parameters, g the measured quantization gain (1.62 for Q8_0,
0.87 for K-quants). Runtime is about 60 ms with no model present, and fit is judged against memory
the system reports free rather than installed.
Two anchor constants were originally derived rather than measured and were wrong by 4.1x and 2.5x. Nothing shipped in that state, but the feature was complete and passing its full test suite while being wrong, because the tests assert internal consistency and both wrong constants were consistent with themselves.
The contributed dataset then tested the roofline against itself. Decode reads essentially every
weight once per token, so decode tok/s × model bytes is a property of the silicon and should not
care which model produced it. That is a claim with a sharp edge: measure two different models on
one chip and the two products must agree, or the reasoning is wrong. Two chips in the dataset were
measured on more than one model, and the test is to fit the constant on one and predict the other —
fitting and predicting the same model would be circular.
| SoC | fitted on | predicted | measured | error |
|---|---|---|---|---|
| Dimensity 7300 | Qwen2.5 0.5B Q8_0 | 18.4 tok/s | 17.8 | +3.2% |
| Dimensity 8300 | Qwen2.5 0.5B Q8_0 | 35.9 tok/s | 30.5 | +17.8% |
A 531 MB Q8_0 file predicts a 773 MB Q4_0 file's generation rate to within a few percent — different model, different family, different quantization, one constant. The Dimensity 8300 misses, and the same dataset says why: its four contributed passes disagree with each other by 54% end to end, so there is no stable constant there to find. The method reports the spread rather than the average.
A second check, against the lab. Rebuilding both anchor constants from nothing but unsupervised field submissions of the reference chip lands at 25.8 GB/s against the lab's 26.2 — a −1.7% difference — and a compute score of 1.07 against 1.00. Nobody who submitted those runs was following the benchmark protocol.
This is also why the predictor is on the web now rather than only in the APK: src/lib/probe.ts is
a transcription of DeviceProbe.kt, and a fixture of nine device profiles × 19 models — every
estimate, fit verdict, reason string and recommendation — is generated from the web code and
asserted against the Kotlin original inside the app's own unit test suite. The two cannot drift
apart quietly, and a reader can get the answer for a phone they own without installing anything.
8. The one change that alters the shape, not the constant
Every number above is a constant factor — the same work, done faster. Multi-turn is different. Answering turn k normally means re-decoding everything said so far, so TTFT grows with the history: O(history). ENTITY saves the conversation's KV cache and restores it, which is O(1) in compute plus a file read. A single number cannot show a shape, so I swept the history:
| History | Re-prime | Restore | State file |
|---|---|---|---|
| 171 tok | 1,696.6 ms | 0.00 ms | 5.6 MB |
| 348 tok | 3,368.3 ms | 0.00 ms | 11.4 MB |
| 704 tok | 5,608.7 ms | 0.00 ms | 23.1 MB |
| 1,406 tok | 12,915.9 ms | 0.00 ms | 46.1 MB |
8.2x the history costs 7.6x the prefill, and 0.00 ms either way to restore it. One column has
slope and the other does not. The instrument is llama.cpp's own --prompt-cache, driving the same
llama_state_* family the app wraps, so the result does not depend on my UI. It costs 32.8 KB of
state per token, near-identical at every length — trading disk for time is the actual bargain.
How far down can an app actually go?
An unprivileged Android app cannot do kernel optimization and should not pretend to. No cpufreq
governor, no scheduler policy, no realtime class — all of it needs root, and a rooted app would be
unshippable and its benchmarks would stop representing a normal phone. Two sanctioned routes
exist and ENTITY takes both: sched_setaffinity says where work runs, and an ADPF hint
session says when it must finish, letting the vendor scheduler decide per device. I claim no
speedup for ADPF — Bench ships an adpf arm so it is measured rather than asserted, and it has
not run on enough phones to say anything. A hint session also boosts only registered threads, and
ggml workers spawn in its own pool with no enumerable thread ID, so only the llama_decode thread
is registered.
What thirteen SoCs I mostly do not own changed
The highest-leverage thing I built is not an optimization. It is the path that lets someone else's phone tell me I am wrong: 26 runs across 13 SoCs, and it has cost me three published claims.
Four rows earned their place by breaking something. A Galaxy S23 exposed the prime-core thread width collapse. A Dimensity 8300 exposed a power measurement bug, twice. A Nothing A015, my own reference device contributed independently by someone else, falsified my retraction. And a TECNO Spark 10 — eight A53s reporting no Arm ISA extensions at all — was the first evidence that the armv8.0 baseline path had ever been exercised by anyone but me. It still gains 1.34x.
The Snapdragon 865 gives the biggest thread-count multiplier of all and has no i8mm, so the dominant lever is scheduling the hardware correctly, not reaching a faster kernel. Two Exynos parts sit at 46 and 90 tok/s prompt on the same ISA tier, which is how wide a tier can be. And a second no-extension device, a Galaxy A23, is what turns that bottom tier from an anecdote into a median.
A bug in my own code invalidated six rows and I said so. The Dimensity 8300 reported 2.7
microwatts of decode and 11 million tokens per watt. The cause was the voltage, not the current
I had already hardened: that device reports whole volts where Android documents millivolts. Two
independent 1000x errors compounding. And the fix did not fully work — the same phone re-uploaded,
unit confusion gone, marking itself valid, still reporting 0.66 W while decoding 33 tok/s, which
is not physical. Its power stays excluded for a different and stated reason while its throughput
stands. power_valid was a unit heuristic wearing the name of a sanity check.
And one device settles it with no confound at all. The crowd comparison still carries every
difference between chips. So: force each of the seven backends in turn on one phone — same model,
same four threads, same pinned cores, same cooldown, only the instruction set changes. llama.cpp
scores backends in whatever directory it scans, so each variant is isolated in a folder holding
exactly one libggml-cpu-*.so, and the backend that loaded is read back from llama.cpp's own log
rather than assumed.
| backend | adds | prompt | decode |
|---|---|---|---|
armv8.0_1 |
NEON only | 31.63 ± 0.03 | 18.29 ± 0.04 |
armv8.2_1 |
+ dotprod | 151.62 ± 0.19 | 18.50 ± 0.16 |
armv8.2_2 |
+ fp16 vector | 151.76 ± 0.01 | 18.64 ± 0.09 |
armv8.6_1 and above |
+ i8mm, SVE2, SME | not loaded — Cortex-A78 has none of them |
dotprod is +379.4% on prompt and +1.1% on decode. One instruction family quintuples one phase and leaves the other inside its own noise, on one device with everything else held still — which no cross-device chart can show, because it cannot separate "this chip has dotprod" from "this chip is newer". fp16 vector arithmetic on top adds +0.1%: the ladder is not a ramp, it is one step.
An earlier run reported all seven rungs as unsupported. The cause was a missing libomp.so stopping
every binary at the linker, which reads identically to an ISA rejection unless the stderr is read.
The harness now distinguishes the two and says which it saw.
The dataset also prices the seven backend variants, which no single device could. I ship one APK carrying seven CPU backends and pick one at startup by scoring each against the chip's ISA. That is a claim about a decision, and until there were enough contributed rows it had never been priced. Grouping the 19 contributed Llama-3.2-1B Q4_0 runs by what each CPU reports:
| reported ISA | n | median prompt | median decode |
|---|---|---|---|
| no extensions | 2 | 9.9 | 6.2 |
| dotprod | 9 | 90 | 16.6 |
| dotprod + i8mm | 8 | 106 | 21.3 |
Same binary, same file, 4.58 to 33.3 tok/s end to end — 7.3x, no recompile. Crossing the dotprod line is worth 9.1x on prompt against 2.7x on decode — the same asymmetry the one-device ladder isolates, arriving independently from hardware I do not own. Boundary: n=2 in the no-extension tier, so the absolute multiplier carries every other difference between those chips; only the asymmetry survives that, and only the asymmetry is claimed.
Device trees defining per core capacity are public, so a script evaluates ENTITY's thread width rules against any upstream SoC without owning it. For the Snapdragon 8 Gen 2 it predicts exactly the thread count and performance core count the contributed phone reported.
Benchmark of record: four arms, two vendors, five runs each
Llama-3.2-1B Q4_0, PP 512 / TG 128, unplugged and cool, raw CSVs retained. Each arm logs the CPU mask the kernel actually applied, so a silently failed pin cannot pass as "pinning earns nothing".
CMF Phone 1, Dimensity 7300 (4x A78 + 4x A55), start 31 C:
| Arm | Decode (tok/s) | Prompt (tok/s) | TTFT (ms) | Power (W) | tok/W |
|---|---|---|---|---|---|
| Naive (8 thr, all cores) | 10.8 ± 1.3 | 111 ± 13.6 | 4,720 | 4.25 ± 0.12 | 2.61 ± 0.33 |
| Threads only (4 thr, no pin) | 15.0 ± 0.5 | 137 ± 1.4 | 3,803 | 4.09 ± 0.17 | 3.66 ± 0.24 |
| Auto (4 thr, perf pinned) | 18.1 ± 0.4 | 139 ± 0.8 | 3,739 | 3.96 ± 0.07 | 4.59 ± 0.17 |
| Efficiency (4 thr, LITTLE) | 15.0 ± 0.3 | 82.5 ± 0.2 | 6,272 | 3.51 ± 0.02 | 4.28 ± 0.09 |
OPPO CPH2729, Snapdragon 6 Gen 4, start 35.3 C:
| Arm | Decode (tok/s) | Prompt (tok/s) | TTFT (ms) | Power (W) | tok/W |
|---|---|---|---|---|---|
| Naive (8 thr, all cores) | 9.7 ± 0.5 | 152 ± 4.5 | 3,473 | 2.87 ± 1.04 | 3.37 ± 1.05 |
| Threads only (4 thr, no pin) | 17.4 ± 0.3 | 129 ± 22.4 | 4,026 | 2.52 ± 0.90 | 6.80 ± 1.82 |
| Auto (4 thr, perf pinned) | 17.5 ± 0.2 | 129 ± 23.1 | 4,026 | 1.78 ± 0.71 | 9.85 ± 2.54 |
| Efficiency (4 thr, LITTLE) | 14.3 ± 0.1 | 127 ± 1.9 | 4,101 | 3.06 ± 0.96 | 4.74 ± 1.57 |
- Thread count dominates everywhere. +39% on MediaTek, +80% on Qualcomm — eight threads on a 4+4 phone let the A55s gate every decode step, exactly as the straggler bound predicts.
- The pin is device dependent and not nothing. +21% decode on the Dimensity with the two arms' distributions not overlapping at all (Auto's slowest run, 17.5, beats threads-only's fastest, 15.9). +1% on the Snapdragon, but median power falls 2.52 W to 1.78 W — the same policy showing up on the other axis.
- Efficiency cores are not efficient for this workload. LITTLE pinning loses on speed and
tok/W on both phones and collapses prompt throughput 139 to 82.5 tok/s, because prefill is the
compute bound GEMM an A55 is worst at:
I_prefill = 1643needs FLOPs it does not have. Measured, then not shipped as the default.
Reproducing any number takes about ten minutes on any arm64 phone. Install
ENTITY-Bench-v2.2.1-release.apk, import a Q4_0 GGUF, unplug and cool, choose five runs and all
four arms, export the CSV — the app cools between passes and discards a warm-up, so arm ordering
cannot favour the last. The live dataset is at
https://kkjjkamal123.github.io/ENTITY-WEB/leaderboard/, where every handling rule above is
enforced in the page rather than asserted, including the rows that embarrass me.
Head to head: ENTITY against Arm AI Chat and PocketPal AI
The ablation proves ENTITY beats itself untuned. Whether that translates against the two most
credible on-device LLM chat apps on Android — one of them Arm's own — is the next question. Same
phone, same Llama-3.2-1B-Instruct-Q4_0, same PP 512 / TG 128, each app driven through its own
benchmark screen, five runs each, 30 minute cooldown between apps. One session, 2026-07-20.
| App | Prompt (tok/s) | Decode (tok/s) | Threads |
|---|---|---|---|
| PocketPal AI | 88.32 | 13.9 | 6 |
| Arm AI Chat (Arm's own app) | 121 ± 2.99 | 12.4 ± 0.08 | not reported |
| ENTITY | 128 | 18.2 | 4, pinned |
Against Arm's own reference app, on Arm's own silicon: +6% prompt, +47% token generation. Against PocketPal: +45% and +31%.
The shape of that result is the whole thesis. The prompt column is nearly tied because all three ship Q4_0 and reach the same KleidiAI kernels — that column mostly measures whether an app got the quantization right, and here everyone did. Decode is where ENTITY pulls away, because decode is the phase the thread count policy acts on, and the mechanism is named rather than mysterious: PocketPal runs 6 threads on a 4+4 chip, so two land on Cortex-A55s at roughly a third of an A78's throughput and every decode step waits on them, exactly as the straggler bound predicts. The same failure as the naive eight thread arm, less severe. Arm AI Chat does not report its thread count, so for Arm's app the mechanism is inferred rather than measured, and I say so.
Both sessions are published because they disagree. The same three apps were measured on 2026-07-14:
| App | 2026-07-14 prompt / decode | 2026-07-20 prompt / decode |
|---|---|---|
| PocketPal AI | 86.4 / 10.9 | 88.32 / 13.9 |
| Arm AI Chat | 120 ± 3.8 / 12.9 ± 0.08 | 121 ± 2.99 / 12.4 ± 0.08 |
| ENTITY | 133 / 15.6 | 128 / 18.2 |
Two of those movements are inconvenient and are kept anyway. PocketPal and Arm swapped places on decode, so the July claim that PocketPal came last was removed rather than left standing, and ENTITY's prompt margin over Arm narrowed from +11% to +6%. PocketPal's decode swung about 27% between sessions on identical hardware while Arm's held within 4%, and that swing is what flipped the ranking — which is precisely the argument for a matched session rather than a flattering one. The most inflated pairing in my own data is today's ENTITY 18.2 against July's PocketPal 10.9, reading +67% where the matched figure is +31%. The number I quote is the smaller one.
Caveats a reader is entitled to: competitor figures are read off each app's own results screen, so
they can be reproduced but not re-analysed, where ENTITY's comes from Bench's per-run CSV.
PocketPal's config reports GPU Layers: 99 while producing a CPU result, and its model file is 765
MB against the 773 MB the other two use. Single device. Full setup and screenshots:
benchmarks/competitor-comparison/README.md.
Challenges we ran into
- My benchmark disproved my flagship claim, then twice disproved the correction. Being wrong once is an accident. Three times in alternating directions taught the real lesson: three runs per arm was never enough resolution for any of those claims.
- Arm's fastest kernels were never running, and nothing in any log said so.
- The file was not what its name said either — having fixed the quantization I assumed the file was uniformly that quantization. It was 76%.
- The app was initially slower than the command line — thread placement and per-token UI overhead on Android, not the model.
- My optimization was silently broken on hardware I could not test. Fixed by deriving the two
phases' widths from different signals:
cpu_capacityfor prefill, the clock rule for decode. - A power reading absurd rather than missing. When a derived value is impossible, check every input's unit and not the one you already suspect.
- Fitting 3B into 1.5–2 GB of actually free RAM via mmap weights and context admission.
Accomplishments that we're proud of
- ENTITY beats Arm's own reference app on Arm's own silicon: +47% token generation and +6% prompt against Arm AI Chat, +31% and +45% against PocketPal, all three re-measured in one matched session, with the earlier session published alongside it because the repeat disagreed.
- A fix merged into llama.cpp (PR #25701), reviewed by Arm's KleidiAI backend maintainer, so the silent fallback now warns every user.
- The quality column nobody publishes: perplexity for six same-source quants, so the prompt win has a stated price of 5.6% perplexity rather than a hedge.
- A benchmark honest enough to disprove its own headline three times, logging the kernel-applied CPU mask so a failed pin cannot hide.
- A public dataset checkable without installing anything: 26 runs, 13 SoCs, every exclusion rule enforced in the page — and now enough rows to price the backend dispatch itself.
- Two "obvious" accelerations measured and rejected: LITTLE cores lose on speed and tok/W for LLM inference on both phones, and the Mali GPU loses by 30.3x on prompt because it has no integer dot product at all.
- A full-repo review, fixed and shipped. A pass over the whole ~131k-line tree produced fifteen findings - a heap overflow reachable from a public JNI entry point, a null dereference on the one path that fails under memory pressure, token positions written past the end of the KV cache when a context shift frees nothing, and a GGUF header narrowing where 2^32 truncates to 0 and every subsequent byte parses from the wrong offset in silence. All fifteen fixed, fifteen tests added, shipped as chat 3.7.1 and Bench 2.2.1 with the same signing certificate so the upgrade is in-place. The one that mattered most to other people: Bench refused to send from its own Contribute screen unless an unrelated Settings toggle was on, which had been quietly suppressing contributions to the public dataset above.
- Release signed, with unit tests over thermal logic, efficiency mode, device detection, power unit resolution, tensor census parsing and the probe's prediction model.
What we learned
- Never credit an optimization a two variable comparison cannot attribute.
M_totalfactors and only a third arm says which factor paid. - A null result is a claim too. Three runs per arm sufficed to disprove "+121% from affinity" and not to support "affinity earns nothing".
- A retraction is a claim too, and mine needed retracting. Being wrong in the humble direction feels like rigour, which makes it harder to catch than the original error.
- A ratio is only dimensionless if both sides were measured the same way, and a control that
silently fails to control is worse than none — a
-ngl 0"CPU" arm that still used the GPU read 32x slow and would have made the GPU look competitive. - Name a flag for what it checks, not what you wish it checked.
power_validresolved a unit ambiguity and got named as though it validated physics. - Coverage is not throughput, and I had to build the wrong model to find that out.
- The biggest lever was the thread count matched to the performance cluster. One flag,
-t 4. - Arithmetic intensity, not intuition, tells you which phase an optimization will help. The two phases differ by exactly the prompt length.
What's next for Project Entity
- publish sustained thermal results, tok/s over 10 minutes per arm, with the naive comparison under heat
grow the device matrixdone, and it cost me three published claims — 13 SoCs now, including the two Exynos rows this list used to complain about missing. It needs to keep growing- measure the i8mm rung. The catalog and probe both model it and the ISA ladder shows the rung exists, but a Cortex-A78 cannot load it. This needs silicon with i8mm under my own hands
- chase the only prompt regression on record: the Helio G37 prefills slower tuned than naive, 9.3 to 7.8 tok/s. All eight cores are A53s, so capacity-ranked selection is probably picking the wrong four. Single pass, so a lead rather than a result
- sweep 2, 4 and 6 decode threads on prime-core flagships, where the count currently lands on a floor clamp rather than a derivation. Bench's sweep mode already exists to answer it
- give
power_valida plausibility floor in the app, not only in the analysis
Long term: ENTITY exists to show that private, offline, Arm-optimized AI on everyday phones is practical and worth building seriously.
Built With
- android
- android-studio
- androidjetpack
- arm
- big-little
- c
- c++
- cmake
- dotprod
- espresso
- gguf
- gradle
- java
- jdk17
- jni
- junit
- kleidiai
- kotlin
- kotlincoroutines
- llama.cpp
- natural-language-processing
- ndk
- quantization


Log in or sign up for Devpost to join the conversation.