-

Title
-
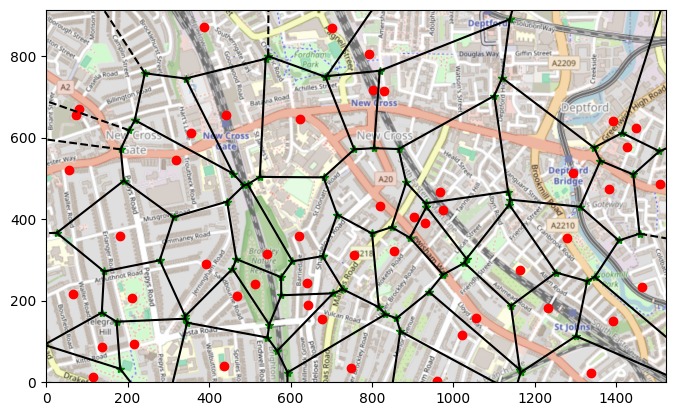
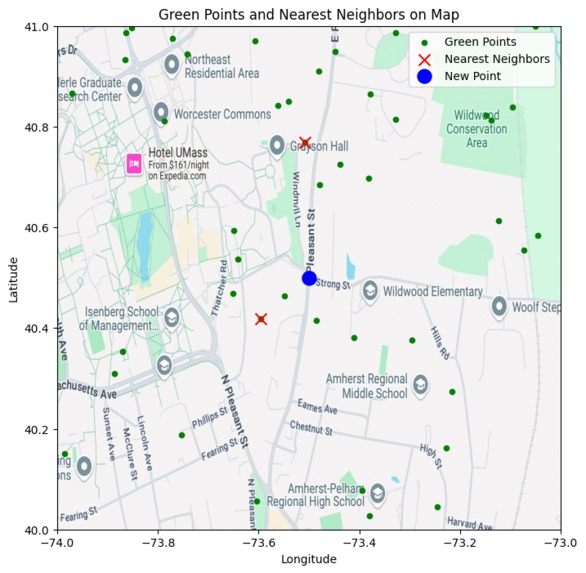
Map Point Recommendations
-

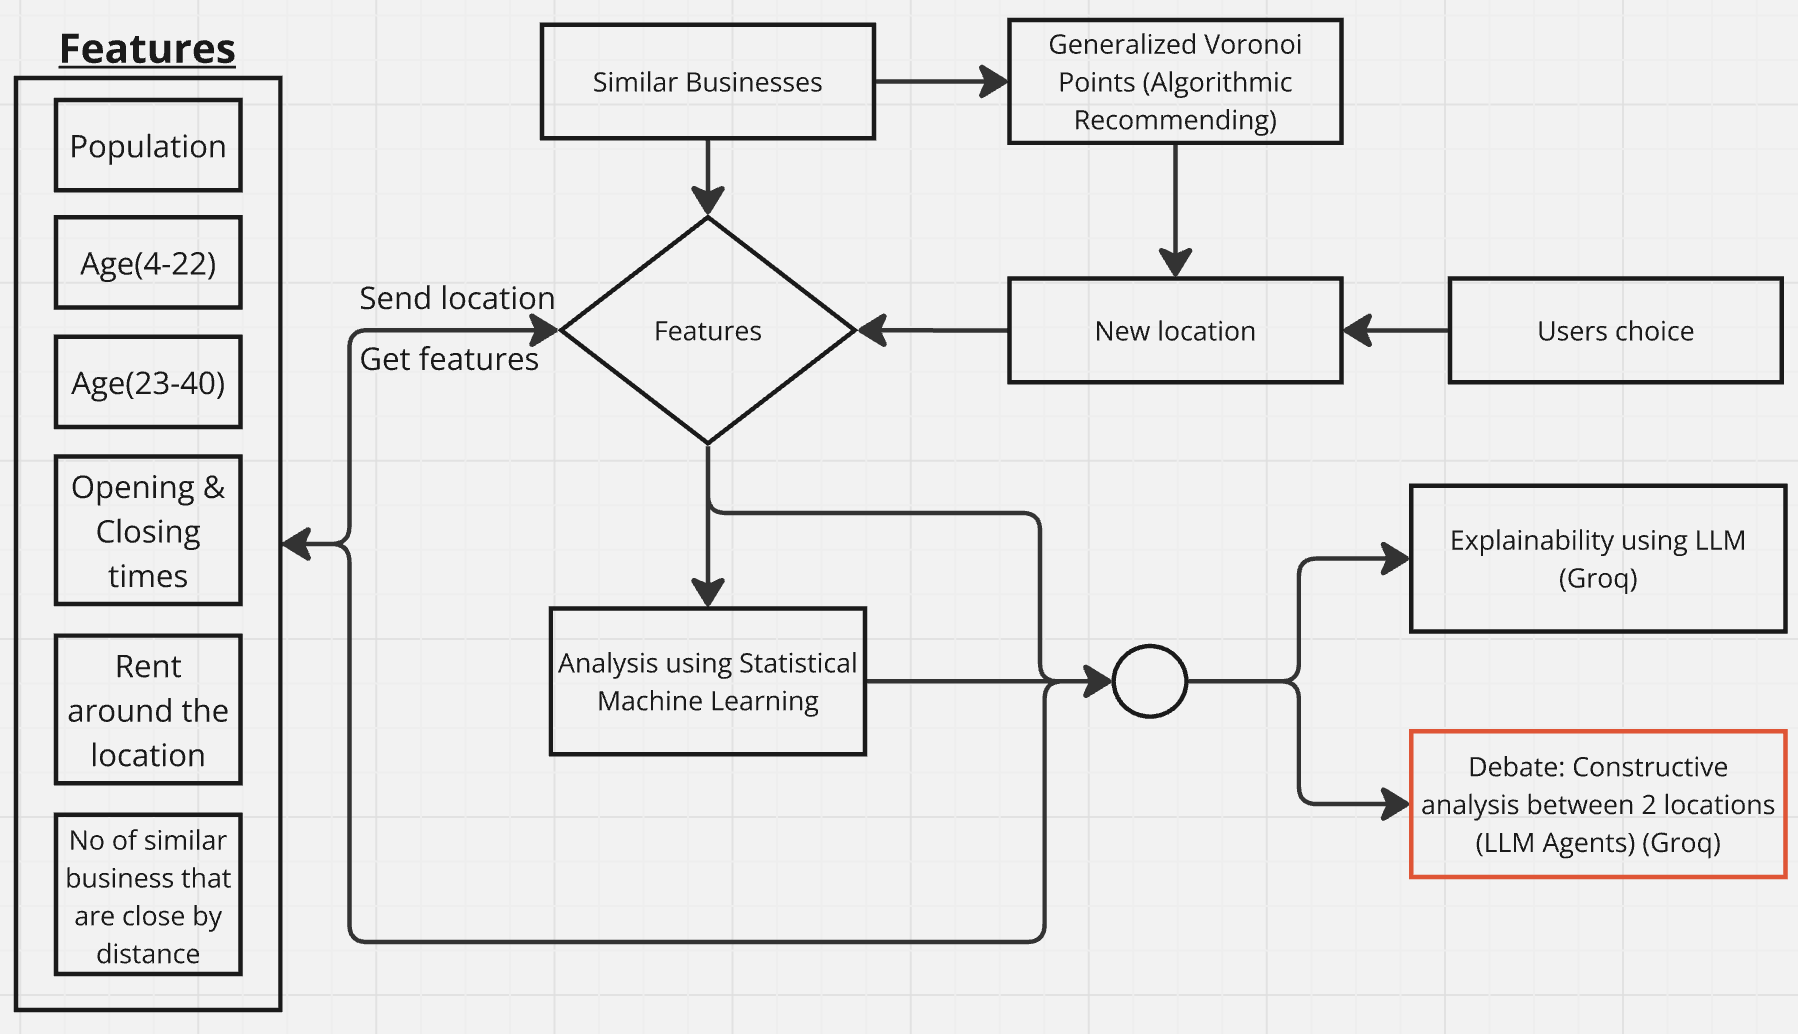
Software Architecture
-
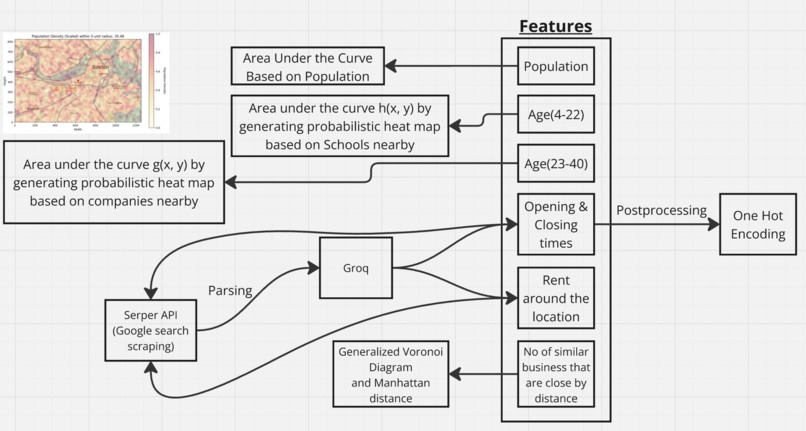
Feature Engineering
-

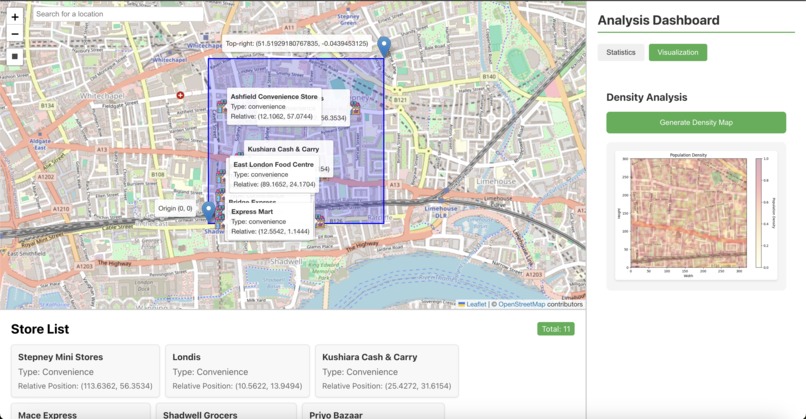
UI-1
-
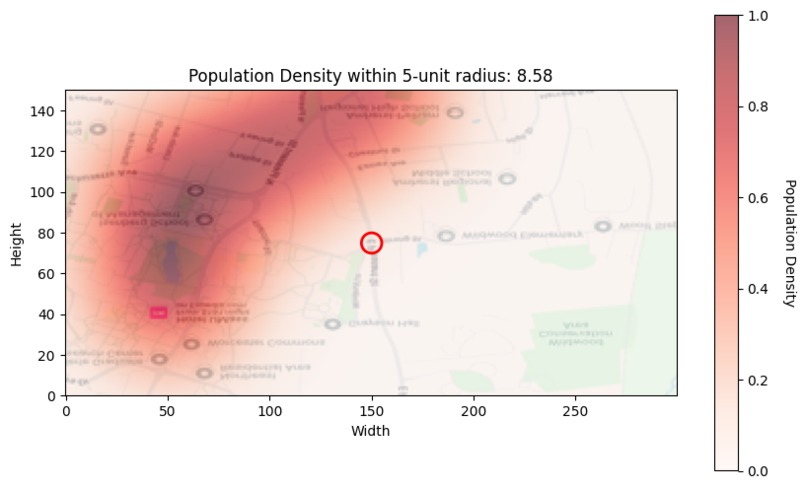
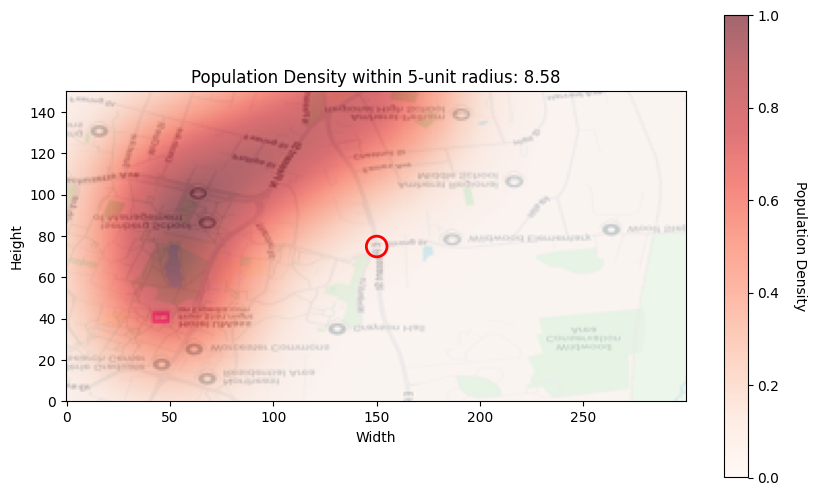
Population Density
-
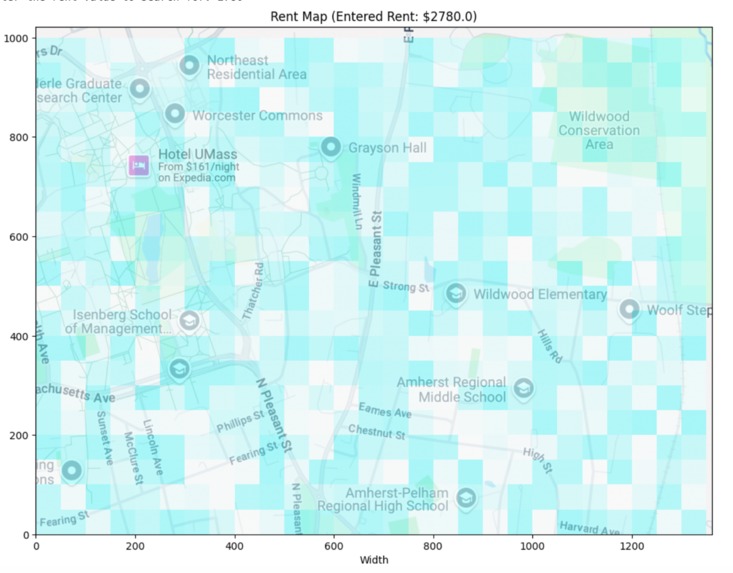
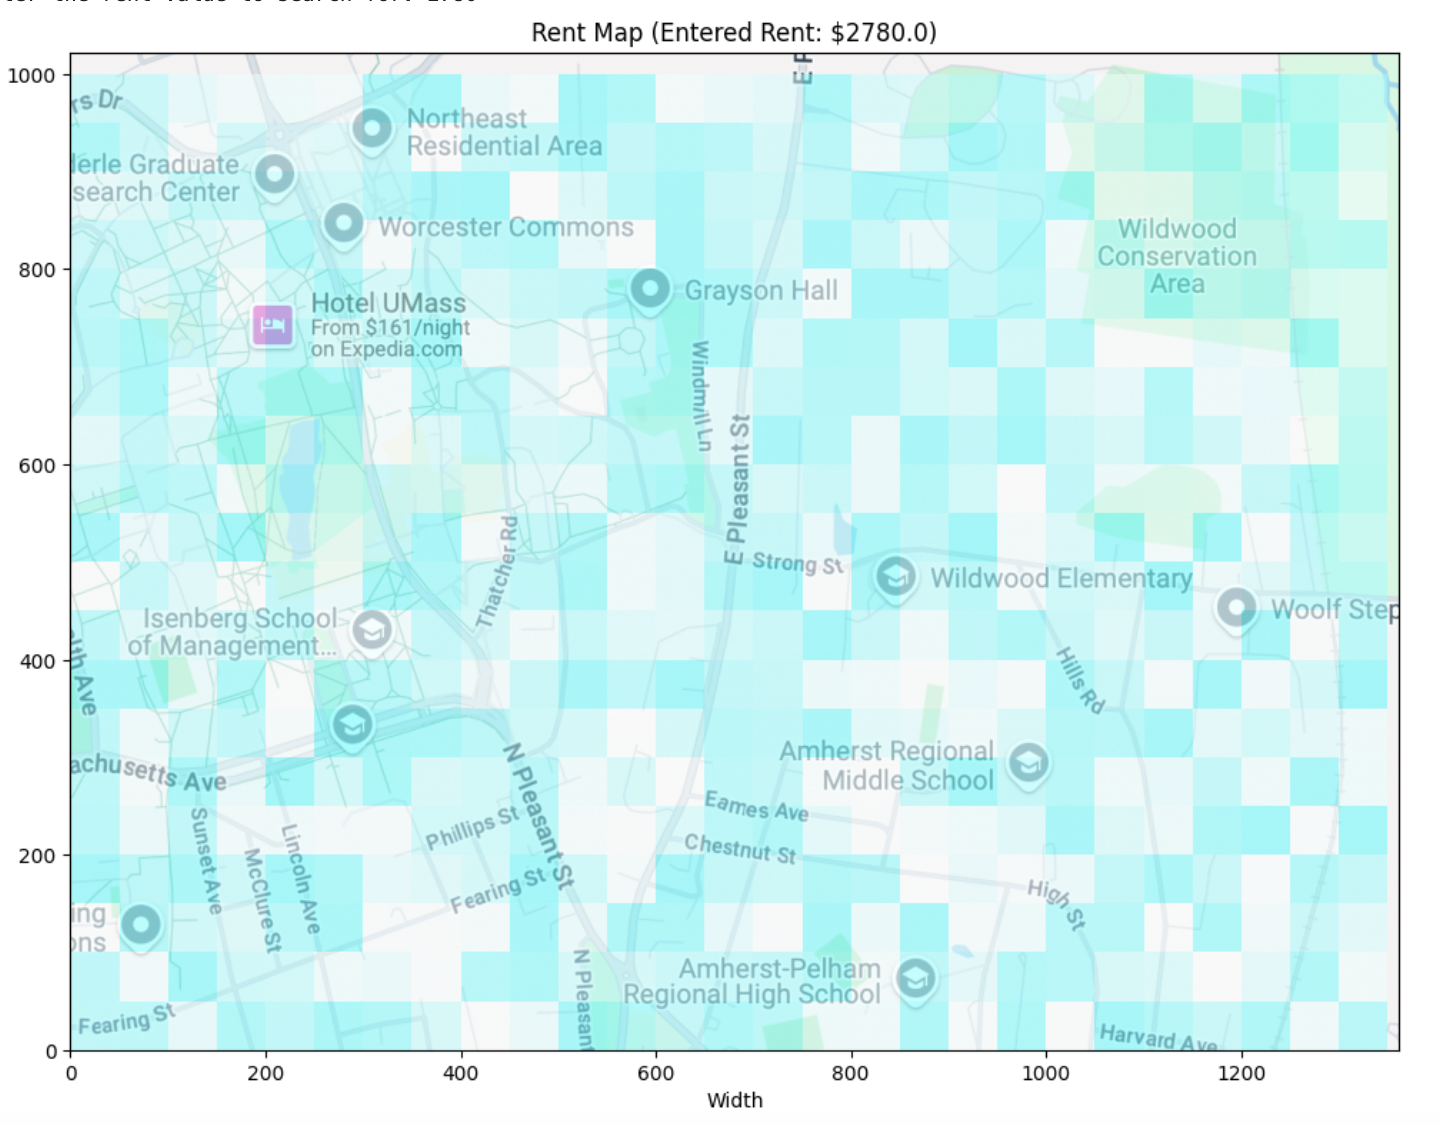
Rent Feature For Each Area
-
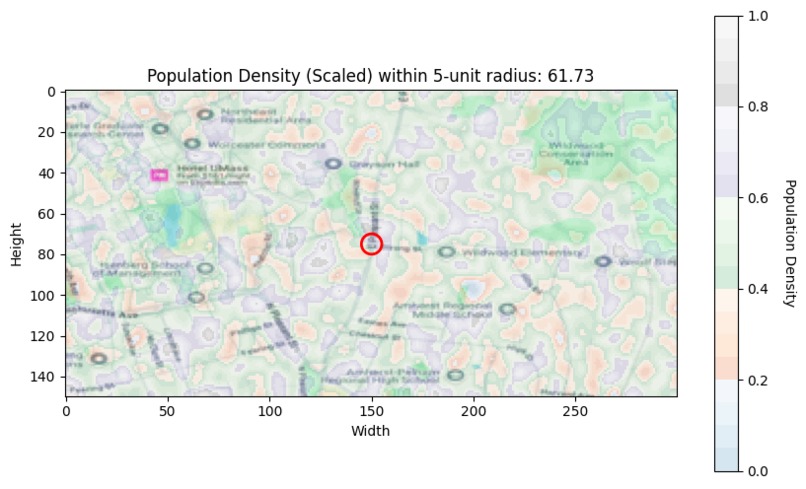
Children Population Heatmap Based on Schools
-
Population Density
-
Recommendation Analysis


Prime Plot: Finding the Perfect Spot for Your Business, Backed by Data
1. Inspiration
Business location can be the difference between success and struggle, but most entrepreneurs rely on intuition rather than science to pick the perfect spot. At Prime Plot, we’re driven to take the guesswork out of this process. Inspired by the hurdles of location scouting, we built Prime Plot to turn big data into actionable insights, helping entrepreneurs find their ideal spot for business success, while also streamlining growth in local communities.
2. What It Does
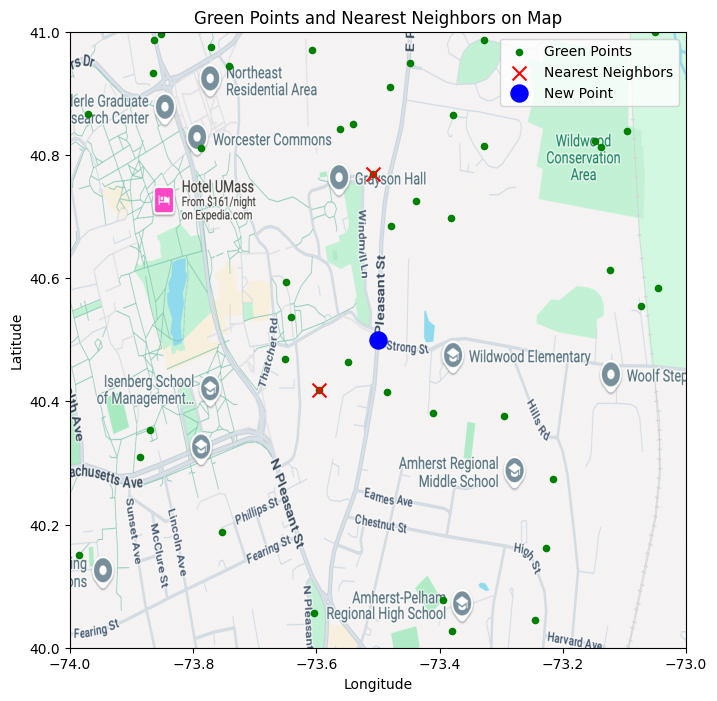
Prime Plot is a powerful, interactive tool that analyzes factors such as demographics, rent trends, nearby businesses, and operating hours to identify high-potential business locations. Using Generalized Voronoi Diagrams, we model key hotspots across cities, pinpointing areas with prime customer reach and minimal competition. Entrepreneurs input their preferences, and we return data-backed location options with predicted success scores based on our K-Nearest Neighbors analysis, drawing insights from existing successful businesses nearby.
3. How We Built It
Building Prime Plot required a tech stack capable of managing complex data workflows, spatial analysis, and real-time insights:
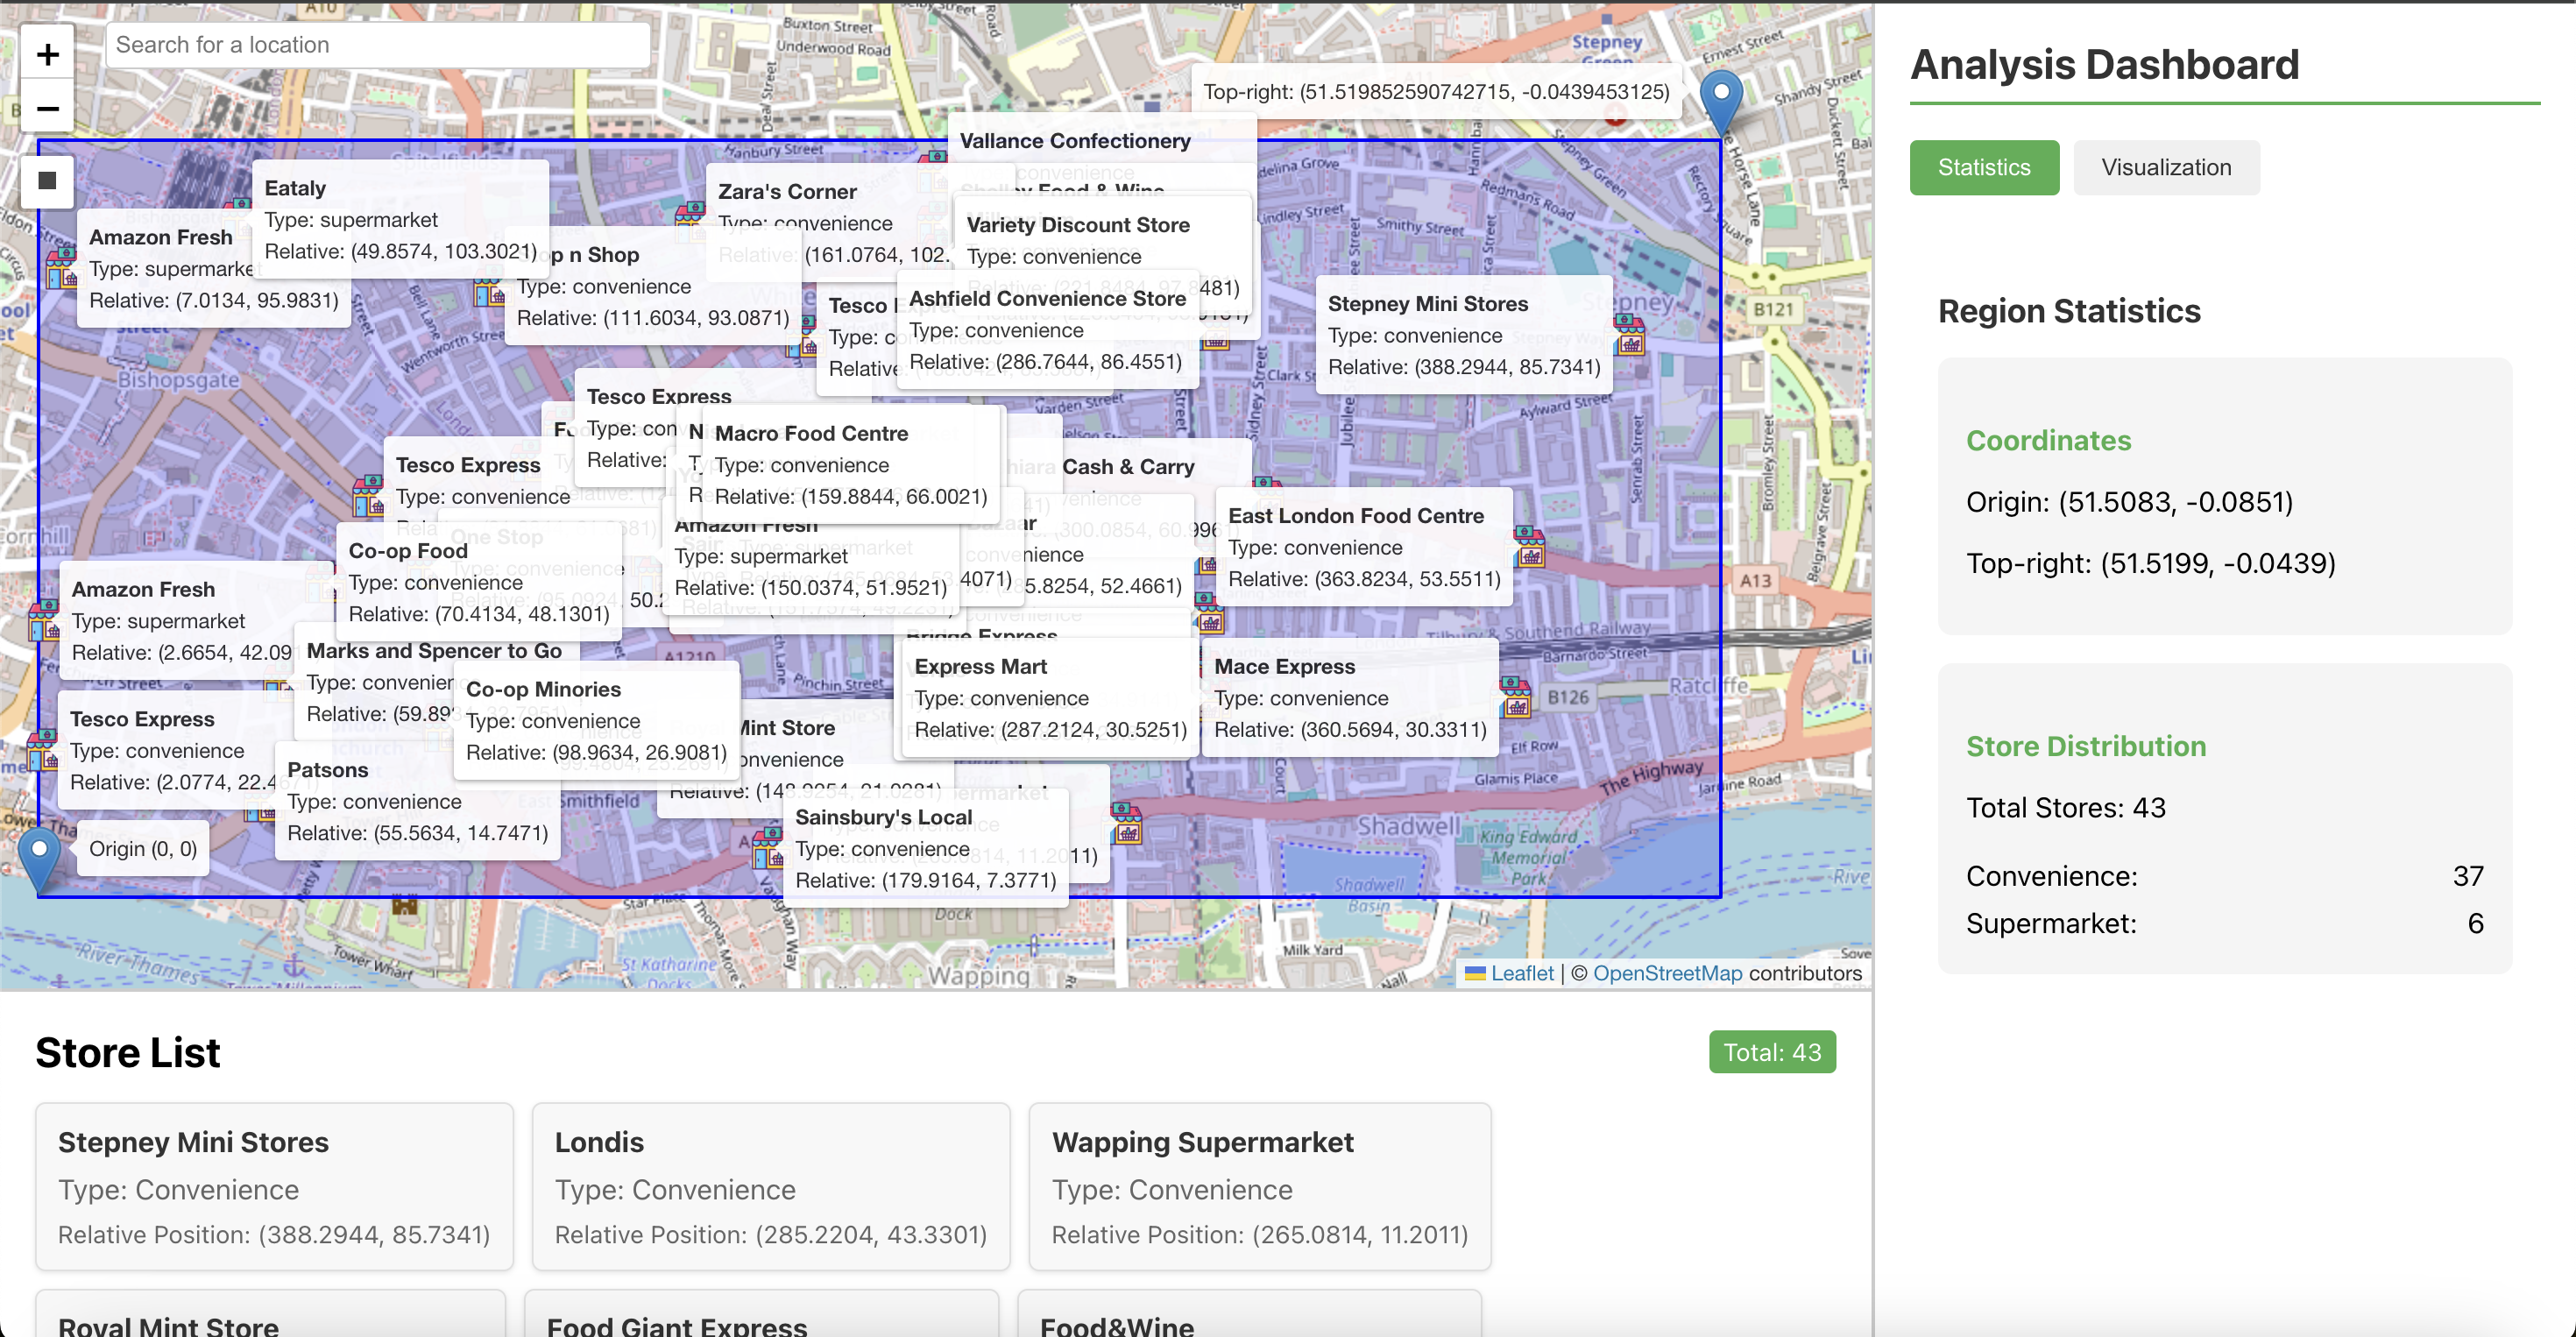
- Frontend: We built the interface with React to ensure a smooth, interactive experience for users. The interface is designed to allow easy input of location preferences, display Voronoi diagrams, and offer detailed insights into each recommended location. The frontend also includes an interactive map where users can select a specific location and drag a rectangle over the map. This rectangle allows them to view all available businesses, schools, stores, companies, etc., within the selected area. Additionally, the heatmap feature is integrated into the frontend, allowing users to view data visualizations of factors like population density or business clusters, all tailored to the selected region.
- APIs: We used the Serper API and Groq API to gather and process data on local demographics, business clusters, and property rentals. These APIs provided real-time insights into the data and helped deliver the dynamic content seen in the app.
- Backend: The backend, built with Python and FastAPI, handles requests between the frontend, APIs, and data-processing layers. FastAPI’s asynchronous nature allowed us to process large datasets efficiently, keeping the application responsive even with significant user input and data queries.
- Geospatial Data: To source accurate and relevant location data, we used OpenStreetMap (OSM), pulling in details like school and office zones, existing business clusters, and other critical markers. For spatial modeling, we implemented Generalized Voronoi Diagrams to pinpoint the best possible locations with an intelligent, distance-based algorithm, ensuring that each recommendation was informed by geographic proximity.
- Data Analysis: Python’s data science libraries (Pandas, NumPy, and SciPy) played a key role in analyzing the demographic and business datasets. We use statistical machine learning models to improve the predictive modeling of our software. Each of these analysis, algorithmic approach and models was used to draw comparisons between new locations and established businesses, providing a robust analysis and making more accurate predictions about the best locations for various businesses. In addition to predictive models, we also used an interactive Python library in combination with Matplotlib to visualize the data. The heat map displayed population density across different age groups, with a radius of proximity assumed to be normally distributed, allowing users to better understand the population spread and make more informed decisions.
4. Challenges We Ran Into
Creating Prime Plot wasn’t without hurdles. We faced significant challenges in:
- Data Integration: Aggregating population, rental, and business data from diverse APIs and formats took extensive data cleaning and wrangling. Ensuring the consistency and accuracy of data, especially across geospatial sources, was an ongoing challenge.
- Building an Intuitive UI: It was crucial that Prime Plot's interface feel both informative and approachable. Integrating visualizations, especially for Voronoi diagrams and K-Nearest Neighbors insights, required careful design to ensure users could intuitively navigate the data.
5. Accomplishments That We're Proud Of
Despite the challenges, we’re proud to have created a fully functional tool that can genuinely support entrepreneurs. Our biggest wins include:
- Data Engineering: This was the major challenge we ran into as there are exhaustive list of features while considering to analyze demographics and due to limited time we cannot boil the entire ocean at once, so we focused on limited set of features that was readily accessible and can be used to represent our problem to solution correlation effectively.
- Transforming Data into Actionable Insights: Prime Plot doesn’t just show data; it interprets it, making the complexities of demographic analysis and spatial modeling accessible to any user.
- User-Centric Design: We designed our UI with the user’s decision-making process in mind, allowing for an effortless exploration of location options.
6. What We Learned
Prime Plot taught us a lot about integrating spatial analytics with real-world applications. We gained hands-on experience with geospatial modeling, feature engineering data, and leveraging APIs effectively to collect data effectively. This project also reinforced the importance of user experience and design in data-driven applications—insights are only valuable if users can easily understand and act on them.
7. What's Next
Prime Plot has exciting growth potential! Here’s what’s in store for the future:
- Expanding Data Sources: We plan to integrate more comprehensive data on demographics, housing, and business clusters to enhance the accuracy of our recommendations.
- Monetization: We envision Prime Plot as a subscription-based tool with premium features, such as industry-specific insights and detailed competitive analysis reports.
- Robust Prediction Models: By refining our K-Nearest Neighbors and adding machine learning algorithms, we aim to provide even more tailored predictions for business success based on location.
Prime Plot is not just a tool; it’s a strategy for entrepreneurs to make data-driven decisions with confidence, helping them plant their business in the best possible spot for success.
Built With
- agents
- algorithms
- data-analysis
- decision-tree
- fastapi
- groq
- knn
- machine-learning
- openstreetmap
- python
- random-forest
- react
- serperapi
- xgboost-classification


Log in or sign up for Devpost to join the conversation.