Inspiration
Every monsoon, the roads around us break down. A small crack fills with water, traffic pounds it, and within days it becomes a crater that damages vehicles and injures riders. We noticed that citizens do report potholes, but reports are just unverified complaints. Nobody can tell a dangerous crater from a shallow dent, and repairs go to whoever complains loudest, not where the risk is highest. We wanted to turn pothole reporting from a complaint box into a decision system.
What it does
PotholeIQ helps citizens report road damage and helps authorities fix the right roads first.
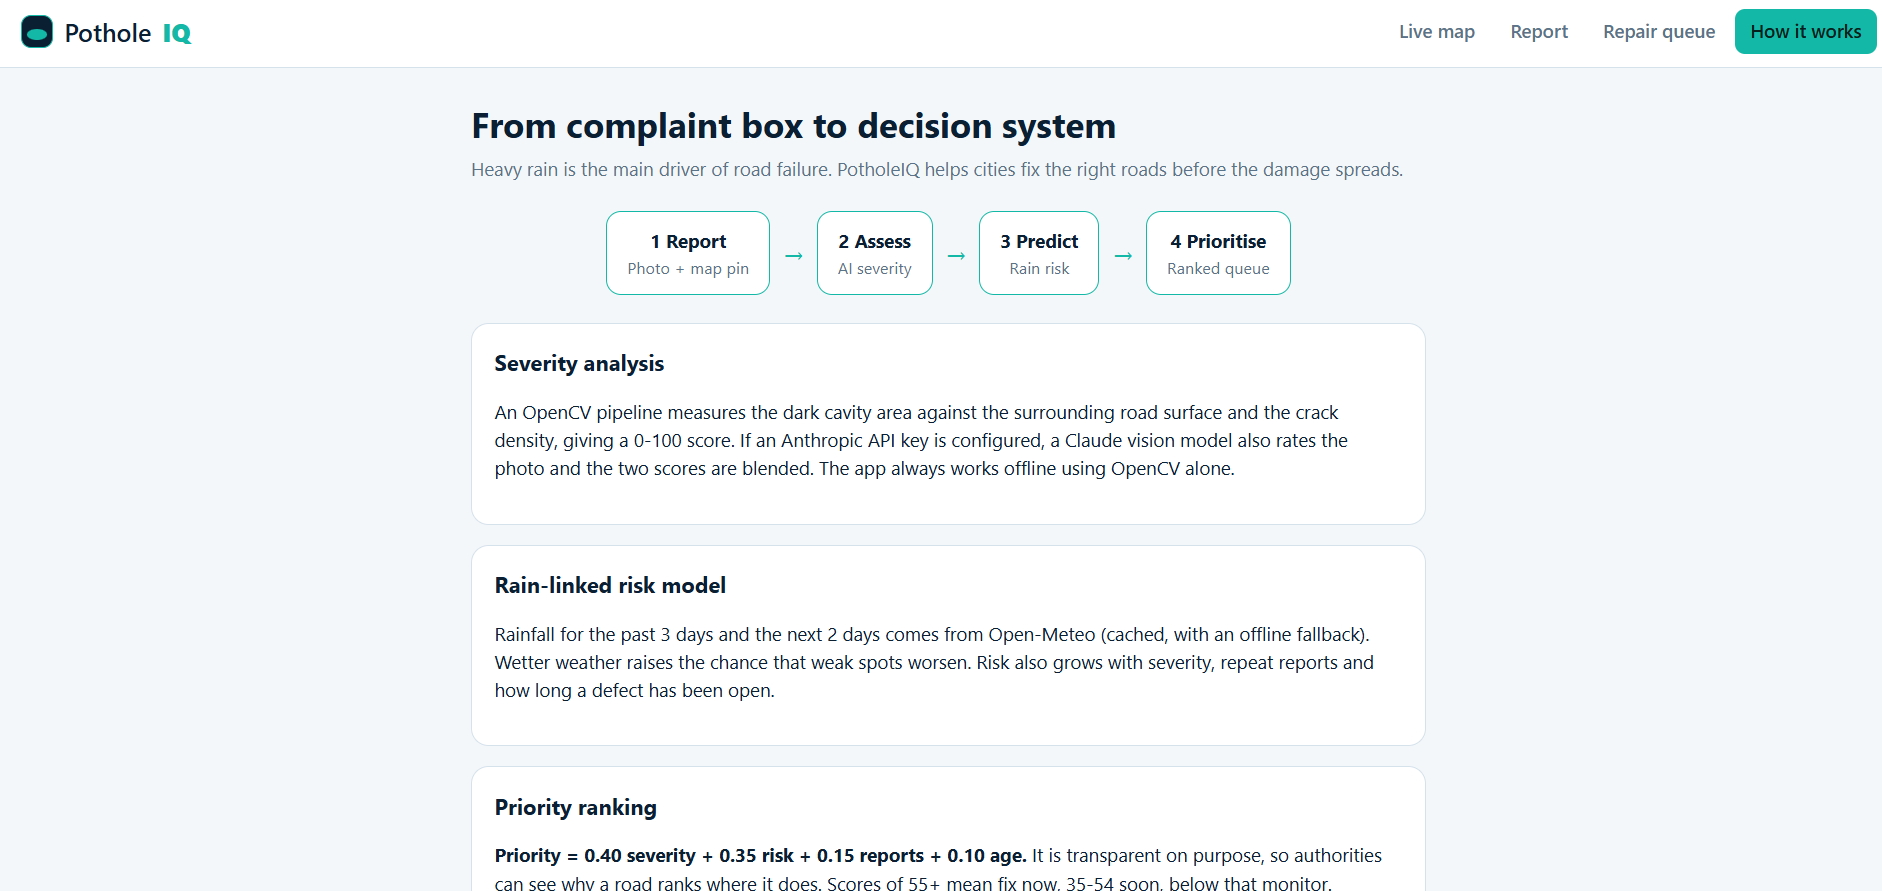
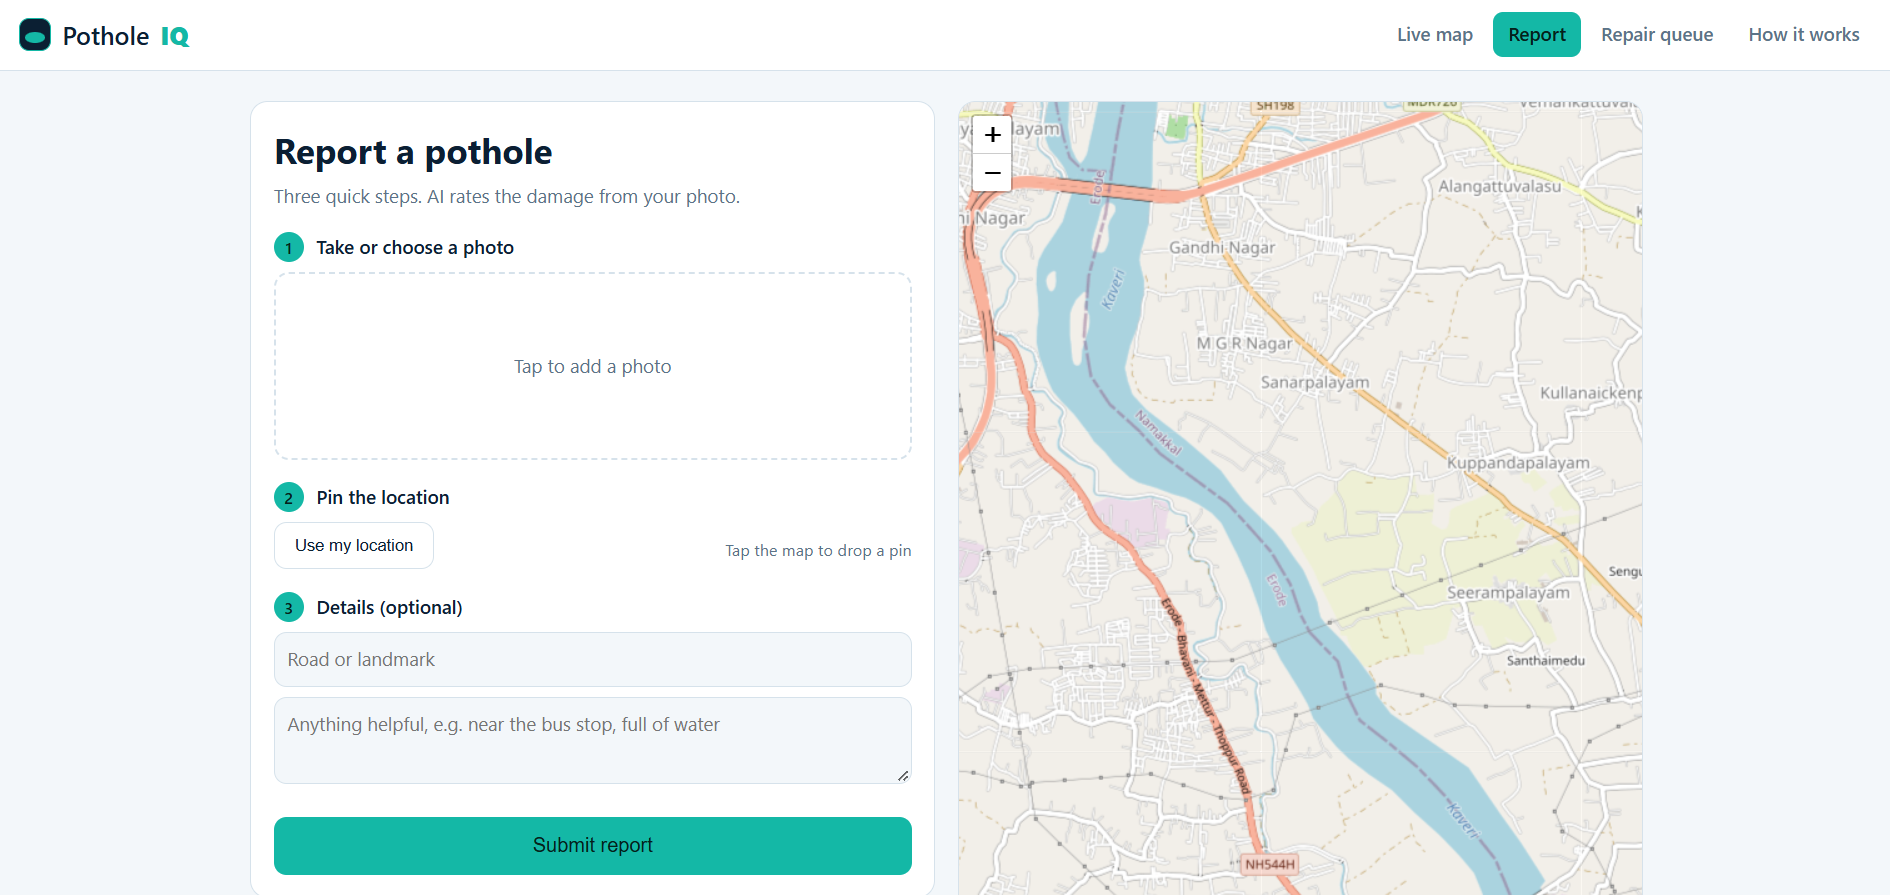
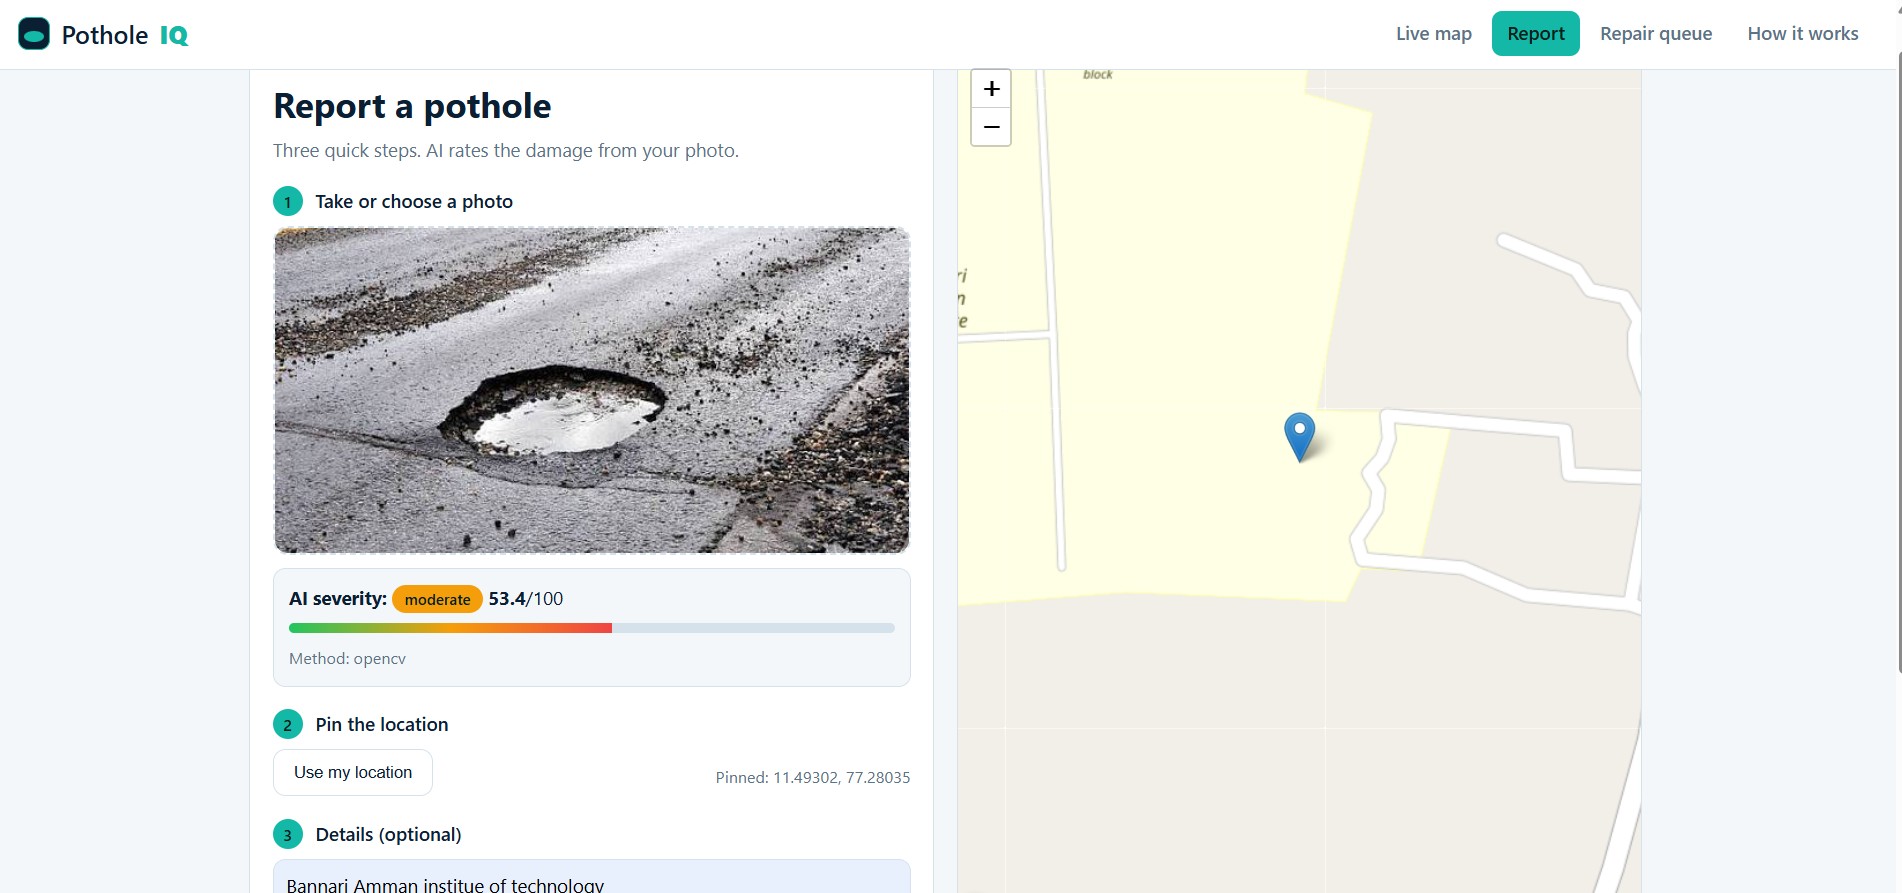
- Report: A user uploads a photo and pins the location on a map.
- Assess: An AI vision model rates the severity (minor, moderate, severe) and fills in the report automatically.
- Predict: A rain-aware risk model uses report history and rainfall data to flag road segments likely to deteriorate next.
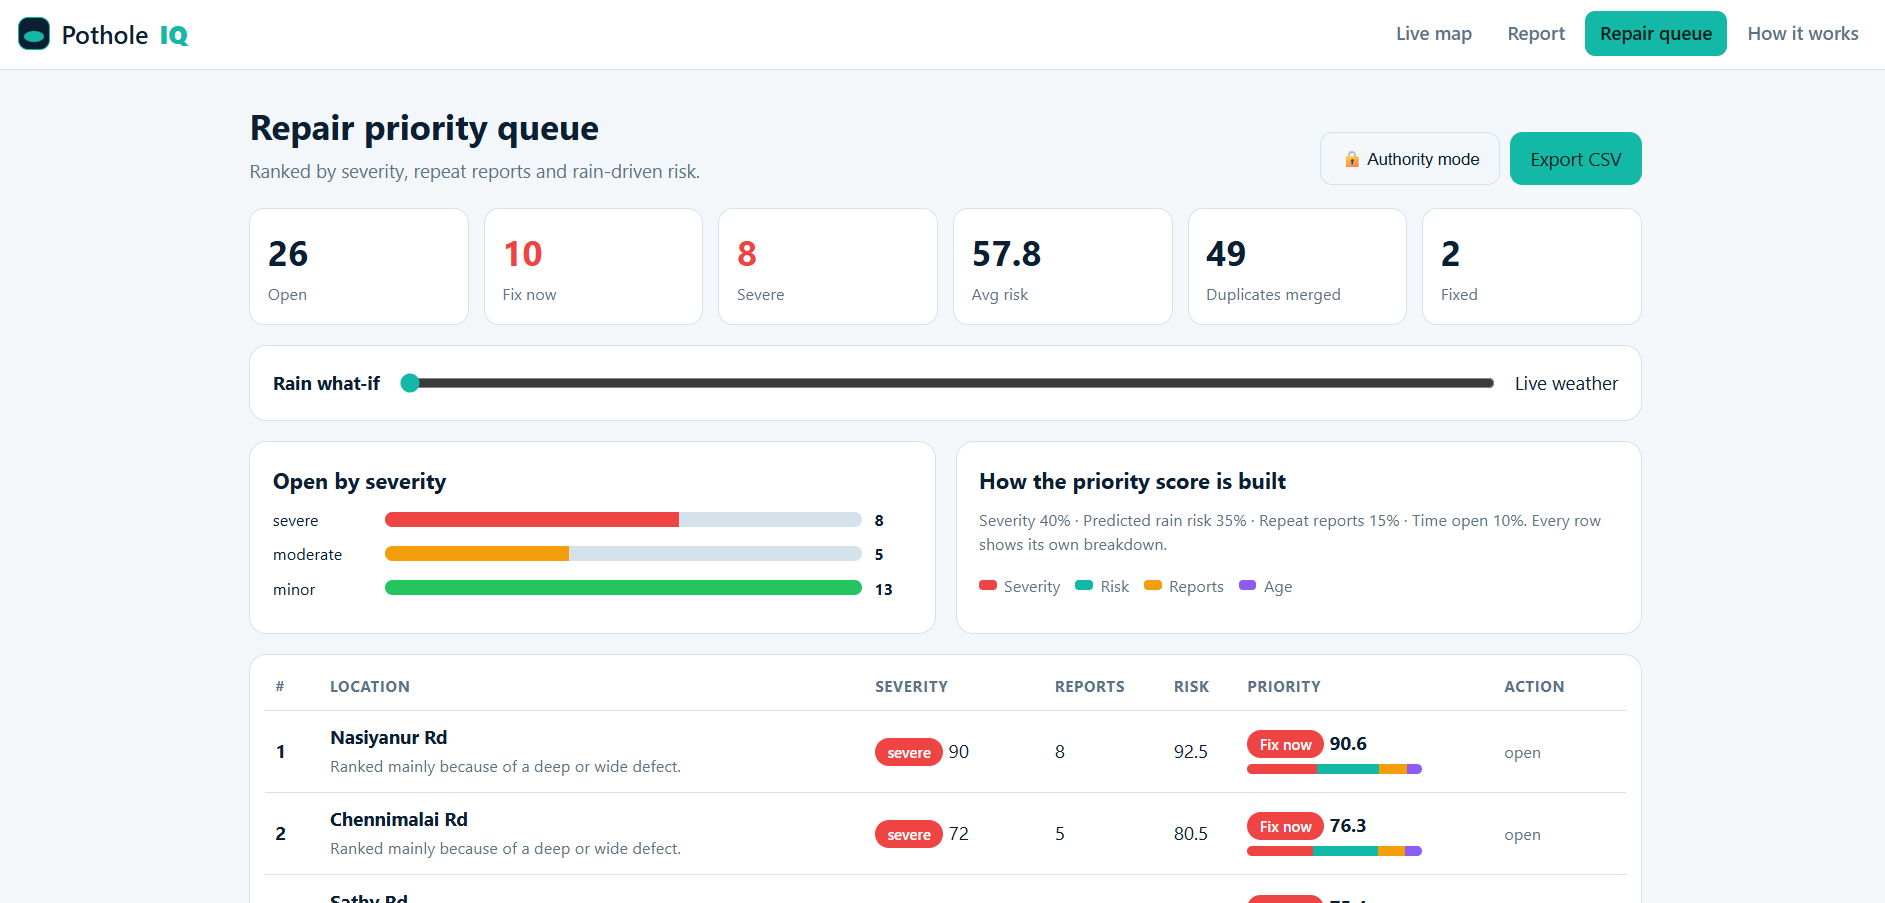
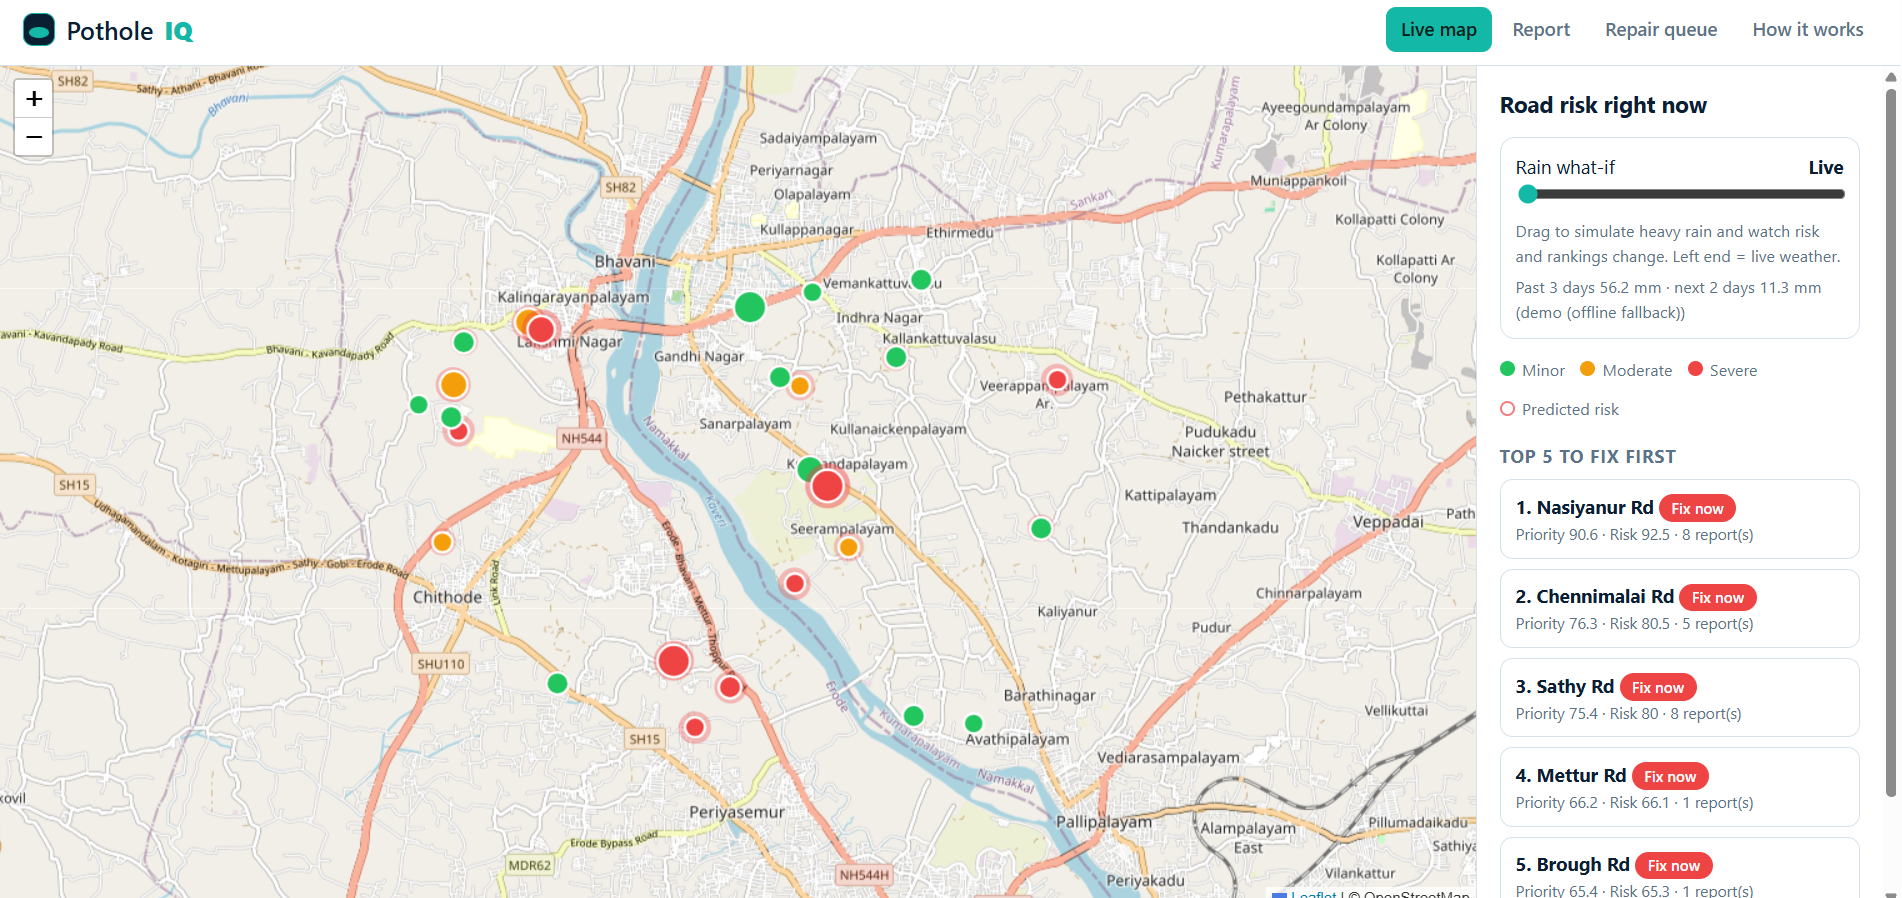
- Prioritise: A ranked repair queue scores each location by severity, repeat reports, and predicted risk, shown on a live map dashboard.
How we built it
- Backend: Flask and SQLAlchemy handle reports, nearby-duplicate merging, and the ranking API.
- Severity classification: [model name / API] evaluated on [dataset, size]. Test accuracy: [X%].
- Risk prediction: [model type] using recent rainfall, past report counts and severity per road segment, and report recurrence. Rainfall data from [source].
- Priority score: A transparent weighted combination of severity, report count, and predicted risk, so authorities can see why a road is ranked where it is.
- Frontend: Leaflet.js map with severity-coloured markers, a risk heat layer, and an authority dashboard.
The base reporting app (map, reports, database) existed before ForgeHacks. During the hackathon we built the severity classifier, the risk model, the priority ranking, and the dashboard.
Challenges we ran into
- Limited labelled pothole images: We had no large labelled dataset to train a custom model on, so we did not pretend to. We built a transparent OpenCV pipeline that measures the dark cavity area against the surrounding road surface and the crack density, which gives a 0-100 severity score. When an API key is available, a Claude vision rating is blended in (70% Claude, 30% OpenCV), and the app falls back to OpenCV alone if that call fails. The README states plainly that this is a heuristic, not a trained model.
- Blurry or badly lit citizen photos: Citizen photos vary a lot in lighting and sharpness. Instead of using absolute brightness, we compare each pixel to its local surroundings, so shadows and dim light affect the score less. We also resize and blur images before analysis, and each report records which method produced its score. Because the score is only an estimate, the repair queue is designed to support human inspection, not replace it.
- Sparse report history for validating the risk model: A new city has no history to train a rain-damage predictor on. We used an explainable weighted model instead: recent and forecast rainfall from Open-Meteo, combined with severity, repeat reports and how long a defect has been open. Every ranking shows its own breakdown, and a rain what-if slider lets authorities see how priorities shift in heavy rain. We describe the risk score as a decision aid, not a validated forecast.
- Duplicate complaints and flaky weather data: Many people report the same pothole, so reports within 25 m merge into one and raise its report count, which keeps the queue clean while repeated complaints still count as a signal. If the weather service is unreachable, the app falls back to demo rainfall values so it never breaks.
Accomplishments that we're proud of
- A full flow from photo to ranked repair queue, working end to end
- [Real number, e.g. "Classifier correct on 41 of 50 held-out photos"]
- An explainable ranking that authorities can actually trust and act on
What we learned
- AI is only useful when its output drives a decision. Severity scores mean little until they feed a ranking.
- Real-world data is messy, so evaluating on real photos matters more than a clean demo.
- [Your own learning, e.g. integrating a vision model into a Flask backend]
Real-world impact
PotholeIQ moves road maintenance from "fix after complaint" to "fix before failure." It shortens the time between a hazard appearing and a crew arriving, gives authorities a defensible repair order, and builds a lasting record of which roads fail repeatedly, which supports better infrastructure decisions as rainfall becomes more intense.
What's next
- Pilot with a local municipal body
- Image-similarity duplicate detection
- Live weather alerts that trigger pre-monsoon inspection lists

Log in or sign up for Devpost to join the conversation.