-
-
Turkey GIS Emissions Study https://dergipark.org.tr/en/download/article-file/3278591
-
GHG Protocol: https://ghgprotocol.org/scope-3-calculation-guidance-2
-
Lend Lease Scope 3 Subcategories Infograph: Ref Lend Lease Scope 3 Emissions Protocol
-
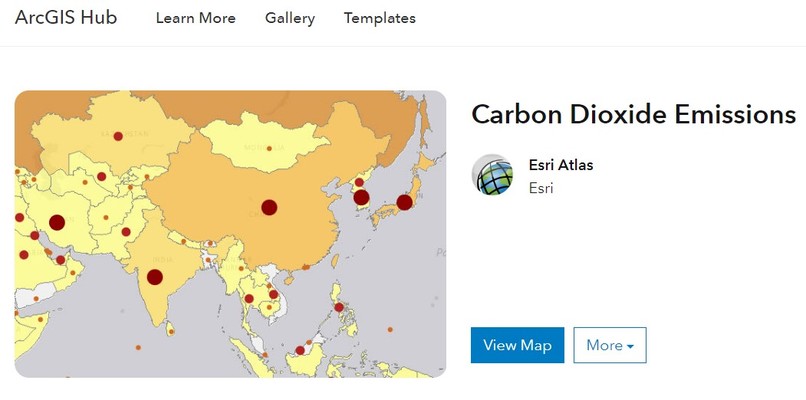
ARC GIS Emmissions Hub https://hub.arcgis.com/maps/esri::carbon-dioxide-emissions/about
-

The Built Environment contribution to global emissions 30 to 40%
-

Circular eco-system building blocks
-

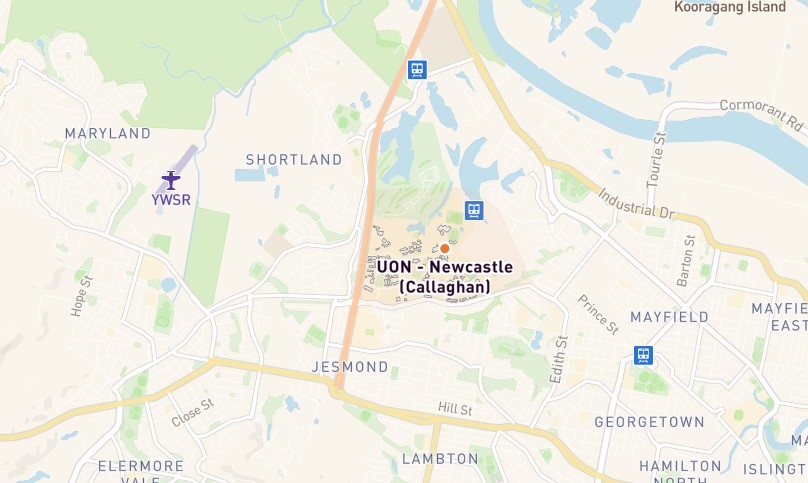
UON Callaghan Campus and connections: Focal point


Project Name: Scope 3 Footprints
Place based mapping of scope 3 emissions in the 24/7 built environment
Elevator Pitch
Clarifying and measuring scope 3 emission through infographic and place based mapping and systems analysis.
About the Project (no more than 1,000 words in total):
Scope 3 Footprints brings together the GHG Protocol and other established place methodologies in the 24/7 built environment using infographic analysis, GIS an python.
The built environment contributes to between 35 and 40% of global emissions.
The GHG Scope 3 definitions are related to organisational concepts and are not spatially defined with the built environment within which they operate.
Scope 3 Footprints focuses on clarifying scope 3 emissions in a place based eco-system approach.
People, community and organisations and their eco systems have a spatial connection with their activities.
Scope 3 Footprints places scope three in context with the built environment and place making.
1. Description of multidisciplinary team members (biographies)
Team:
Dr Jonathan Drane: a veteran of research into the growth of cities and their malaise. Editor of The City Whisperer and founder of Optimum Search est 1993 which focuses on city growth and development. See https://www.jondrane.net/
Melina Da Prato: A project and development manager in the commercial and government development sector currently working for Landcom, the NSW State public development group. Melina has worked with Dr Jon Drane as intern and project assistant through project bids and research.
Inshalla Talipuan: A graduate of economics at the University of Newcastle. Shalla helped Dr Jon Drane as a data collector for the City of Newcastle’s night economy study run by his city research centre Optimum Search and led by Dr Jon.
2. Describe and illustrate the proposed solution including:
- Graphical depictions of the emissions reduction solution
Scope 3 Footprints combines the graphical concept of ‘carbon footprint’ with ‘Scope 3 emissions’ methodology.
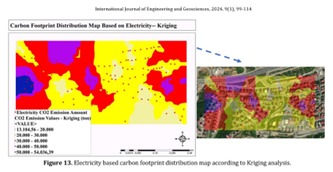
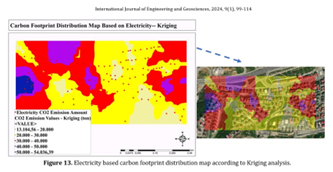
An example of a spatial analysis in a precinct in Turkey is an example (this is based on scope 1 and 2 but provides an example of the principles involved).
Ref: Production of fuel-based carbon footprint distribution map using spatial interpolation methods based on GIS Ebru Çolak 1 , Tuğba Memişoğlu Baykal*2 , Nihal Genç 3, 2024. https://dergipark.org.tr/en/download/article-file/3278591
- Outline of how the proposed solution works:
Scope 3 Footprints uses the GHG protocol together with infographic analysis and ARCGIS as a graphical mapping interface and python to collect facility based data on an organisation’s ecosystem related to emissions.
- Outline of how the proposed solution improves on what is currently available:
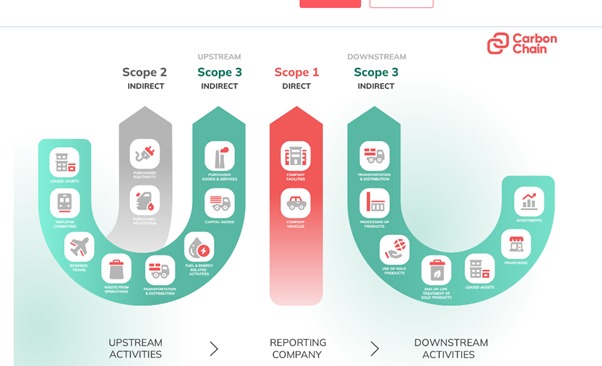
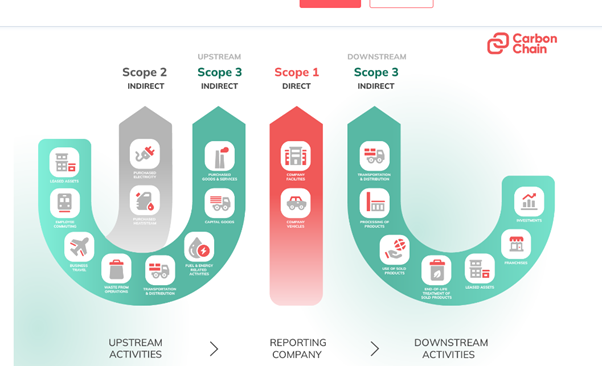
The GHG protocol (see chart below) combines upstream and downstream business flow but has little spatial definition of related categories which would enhance understanding of the overall impact of scope 1, 2 and 3.
An example of this is that the GHG protocol only refers to the built environment as ‘leased assets’ when the built environment actually ( by general research) has a 35 to 40% impact on global emissions.
Scope 3 Footprints places organisational flow with spatial definition to improve the understanding of overall scope 3 impact.
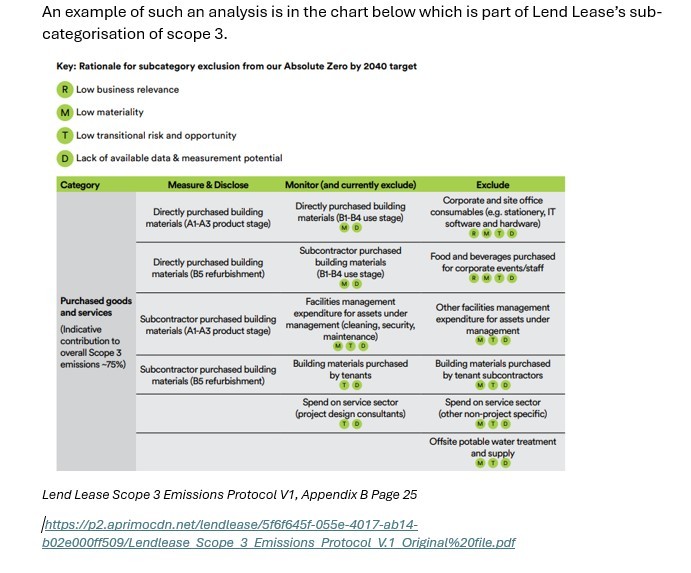
An example of such an analysis is in the chart below which is part of Lend Lease’s sub-categorisation of scope 3.
Lend Lease Scope 3 Emissions Protocol V1, Appendix B Page 25 https://p2.aprimocdn.net/lendlease/5f6f645f-055e-4017-ab14-b02e000ff509/Lendlease_Scope_3_Emissions_Protocol_V.1_Original%20file.pdf
- Outline of what is novel and creative about the solution design:
The bringing together of two protocols- the GHG (organisational flow eco-system) and the built environment place based eco-system.
Infographic and matrix analysis would filter the scope 3 emissions into sub-categories to determine those that can be defined spatially and others which are not easily or practically defined spatially.
3. Describe the top three critical hypotheses you want to explore, including:
• That the GHG protocol provides inadequate spatial relations with its scope 3 categories
• That GIS is a viable methodology for understanding the spatial dimensions of the GHG scope 3 categories and defining sub-categories.
• That an integrated methodology would enhance the understanding of scope 3 emissions reduction globally.
- How you will test them;
--By creating a project specific case study of the UON Callaghan Campus and its scope 3 elements.
--Using the case study to build a prototype using ARCGIS and Python.
--Identifying Scope 3 sub-categories and filtering them into spatial and non spatial definitions.
--Prior GIS studies created for similar situations will be used as a reference point for building data.
--The GIS map would highlight not only scope 1 and 2 but also scope 3 categories and their spatial situations.
- Describe your experimental plan, including any new technologies or tools to be developed; and
--The protype would be tested on a case study of the Callaghan Campus.
--The scope 3 categories and sub-categories would be spatially defined ( where possible)
--The results would be shared with approved and relevant university officers
--The feedback from the university would be built back into the prototype
- If your experiments in the testing phase are successful what are the next steps?
The prototype would form a potential minimum viable product and be marketed as an analytical tool for other universities to collaborate on a beta basis. Sponsorship would be sought from built environment majors.
This would be followed by a data programme over 2 years to mature the MVP.
The 2 year programme would require a marketing interface and a cross university collaboration and further sponsosrhip and funding.
4. Describe how you would use funding to progress your hypotheses, including:
- How will the work described be performed within the budget (up to AU$10,000) and period (6 months) allocated for the testing phase (resources, capability etc)?:
The testing phase would include:
--ARCGIS and Python platforms to be developed using external tech providers.
--Case study analysis would require university collaboration and include data analysis and categorisation by external providers.
--Marketing programme would include social media campaigns on linked in an other platforms as well as rely on university news and media.
-What essential outcomes will you generate during your testing phase?
--A spatial representation of Callaghan Campus and eco-system scope 3 categories and sub-categories.
--A statistical representation of relative emissions across sub-categories in an enhanced spatial format.
--A comparison with international GIS case studies of universities using similar GIS analyses for scope 1,2 and 3
- Include a brief breakdown of allowable costs:
--ARCGIS premium subscription and development: $500 --Python premium subscription and development: $500 --ARCGIS/Python tech support using external contactors: $2,000 --Building the gis platform by our team (not paid) and externals (paid) $2,000 --Case study collection and analysis using external contractors and university officers/contacts. $3,000 --Marketing and social media for sponsorship and support $2,000 Total $10,000
Built with (if relevant) • ARCGIS and Python
'Try it out' links (if relevant) • N/A
Images (if relevant) • As shown above the Turkey and Lend Lease studies Vide demo link (no more than 2-minute duration)
Team member's full names and email addresses:
Dr Jonathan Drane jondrane55@gmail.com Melina da Prato mdaprato@landcom.nsw.gov.au Inshalla Talipuan tinshalla@icloud.com
Team Lead's name Dr Jonathan Drane


Log in or sign up for Devpost to join the conversation.