Inspiration
We were inspired by crowd-sourced media, where people not only use apps to find information, but also to contribute information of their own, creating a natural cycle of ideas, trends, and opinions. There wasn't an easy way of figuring out what is going on in a campus without having to ask friends or do extensive online searching. By creating a map with live visuals and data, the user can instantly and efficiently get a sense of the climate on campus.
How it works
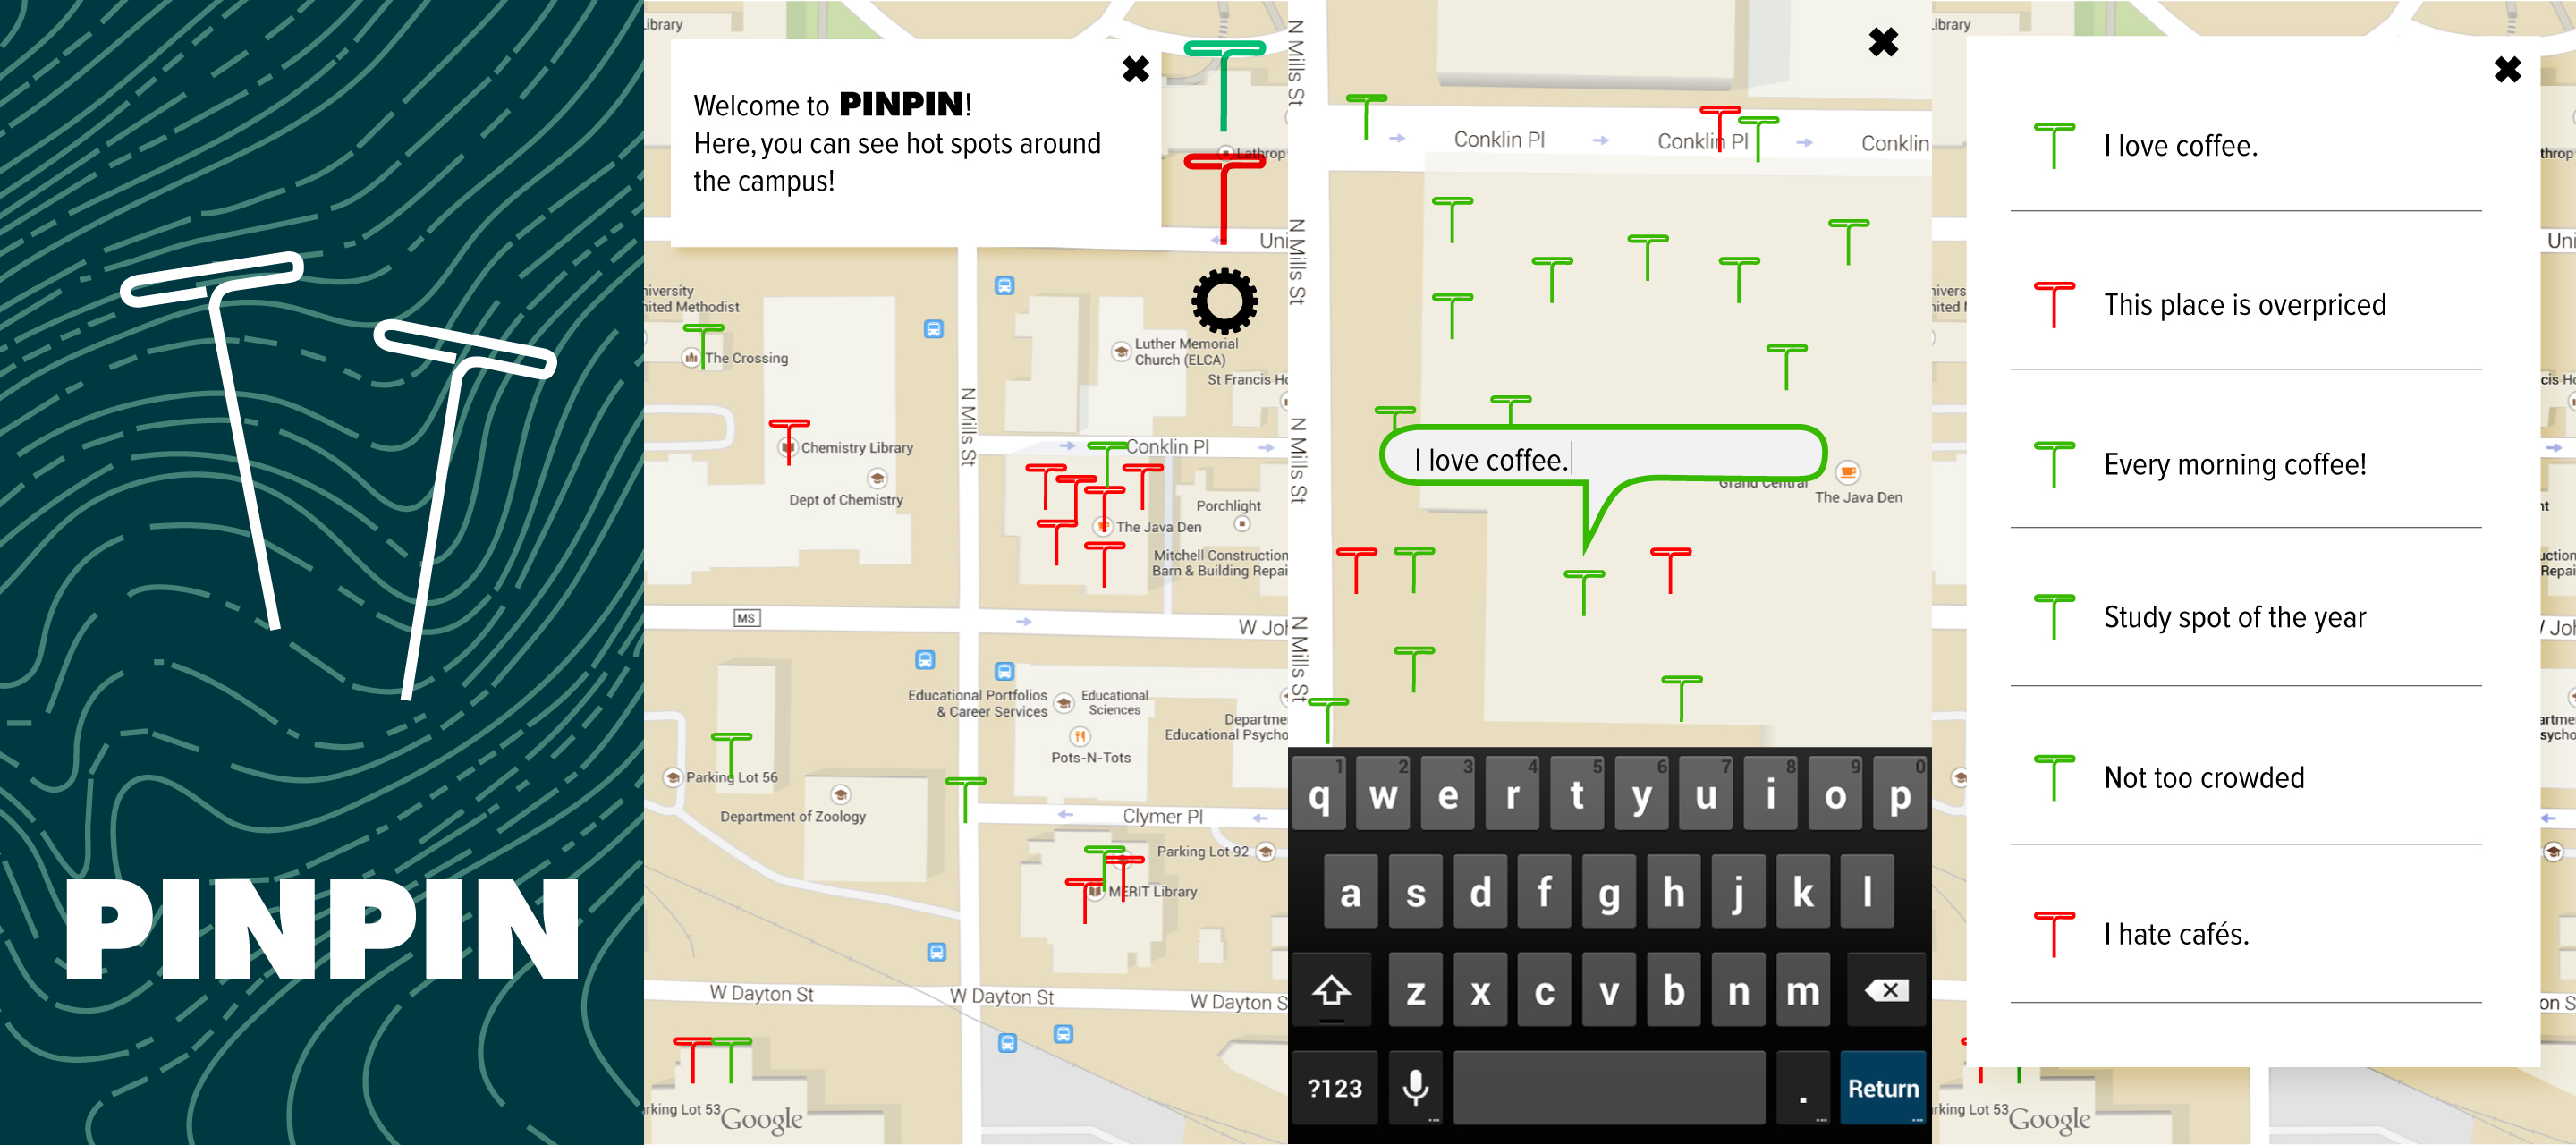
The user is presented with live map, showing anonymous green and red "pins" with short descriptions. Each of these pins represents a person's rating of a certain location on the map. Areas with multiple pins, especially those of both red and green show mixed opinions. The user can get a sense of areas on the map that are trending, controversial areas, or areas where things are happening. Someone bored at home on a Saturday could go on PINPIN to seek out fun events or something interesting to go to, having more awareness of their environment.
Challenges I ran into
This is the first time that most of us have done any extensive hacking or development of a mobile application. We not only had to create a solid concept that our peers at the hackathon could understand, relate, and want to use, but also a useable product and a brand that would appeal visually.
Accomplishments that I'm proud of
For the amount of time we had and the fact that we've never made apps before, it was promising to see something very tangible come from a mere idea. If we can accomplish a task like this in such a short amount of time, I wonder what other projects we can make a reality!
What I learned
Planning and communication are key in the beginning of the project, as we were able to work more efficiently on tasks during the rougher parts of the night and the morning. Also, by condensing the message of our product as much as possible, we were able to deliver the most important components of the app without worrying as much about deadlines, which made everything move more smoothly. Also, having a good understanding of your strengths and what is feasible helps out in the long run.
What's next for PINPIN
Sources for live data/new pin types: now that the user has the ability to check out their surroundings, there are new and seamless ways to introduce new data feeds, like bus information, events in the area, and public safety warnings. Neighborhoods: when used in areas with a high number of users in a small region, different zones are established and can come in handy with fun and friendly competitions. Points and scoreboards: users can gain an incentive to use the app with an individual score for their own account. With users in different neighborhoods, they can compete to have their area have the most pins. For the UW Madison campus, a good example would be Lakeshore versus Southeast Campus. New gestures and interfaces: with time, we can introduce smoother and more intuitive ways to use PINPIN
Built With
- adobe-edge
- adobe-illustrator
- android


Log in or sign up for Devpost to join the conversation.