Inspiration
Increased public awareness of renewable energies demanded an high supply of solar panels. This resulted in necessity to optimise the supply chain of the solar energy industry. Abundance of satellite imagery and improved computation power and vision techniques can help us achieve this goal.
What it does
Calculates the energy production of solar panels using metrics such as roof area, orientation (azimuth angle), superstructures (chimney, window, existing solar panels, etc.), location, and roof angle. On a website,
- Users can select among the predetermined buildings and view their information with images.
- The 100 most efficient buildings for solar panels will be detected and displayed.
- Users can enter their household information and learn how much energy they can receive using solar panels and its yearly cost to them.
How we built it
- We utilize OpenStreetMap for localizing buildings and retrieve satellite image using Google Maps API around the building
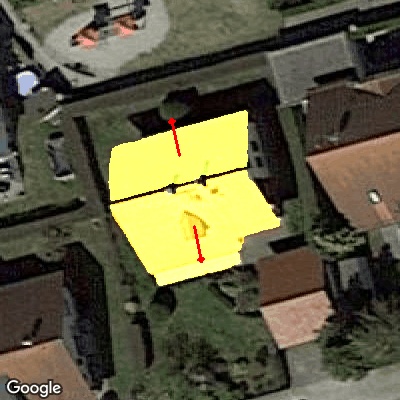
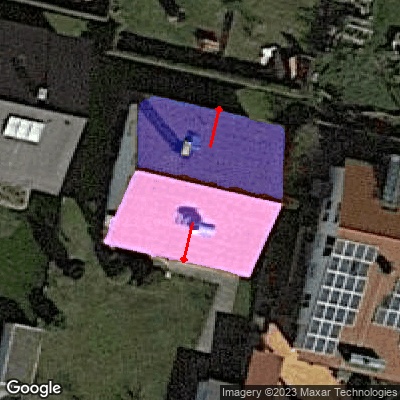
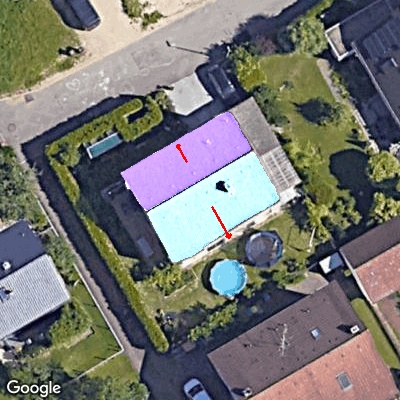
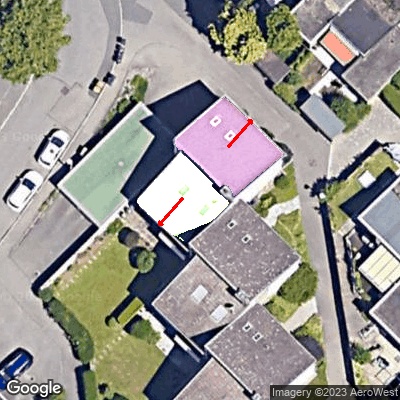
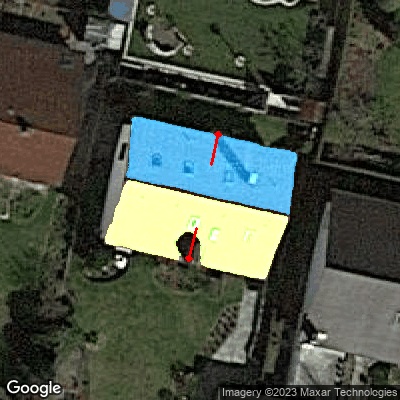
- Using very recent Segment-Anything model by META, we segment each roof section in a zero-shot fashion, then determine the orientation of each section using classic vision methods.
- Using this information, we can approximate the solar energy potential for a given building
Challenges we ran into
- Computation of the potential energy output of a given solar panel is highly complex.
- Processing of satellite imagery, nevertheless the given computer resources, still consumes considerable amount of time.
- Implementation of end user friendly web portal requires significant work. ## Accomplishments that we're proud of
- Functional, dynamic and a pretty web portal that enables users to navigate the world map, observe the high potential yielding buildings and gain insight into the Germany's solar energy facts.
- Zero shot roof segmentation and azimuth angle detection.
- Solar panel installation cost calculation tool
What we learned
There is a high untapped potential to increase solar energy usage in Germany. Methods like ours would enable Germany to quickly realise this potential.
What's next for photongraphy
For a feasible and scalable project, we need to consider buildings that can be built in the future. There are two aspects to this subject. Firstly, as we determine the buildings that can cover all the costs of Germany, we must also consider covering future buildings. Secondly, we can determine the locations of future buildings by considering the most productive areas for solar energy.
Currently, we are not accounting for existing solar panels. As a future improvement, we will detect existing solar panels and exclude them from our data. Since we cannot install another panel on the roof, we should not include it. Additionally, those who are already using solar panels may not want to participate in our generalizable solar panel project.
We must also consider the loss of energy during transportation of solar energy to different households in order to calculate accurate results.
It would be a significant improvement if we add climate data to our calculation methodology. Currently, we have considered the average energy that can be produced and used throughout the year. However, since storing the energy created in summer for winter use is not feasible, we should create our system for the worst-case scenario when energy demand is highest and solar panel energy production is likely to be lowest.

Log in or sign up for Devpost to join the conversation.