-
-
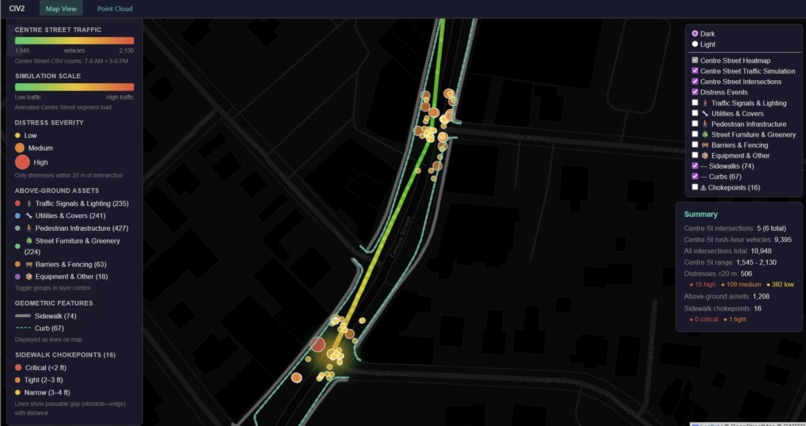
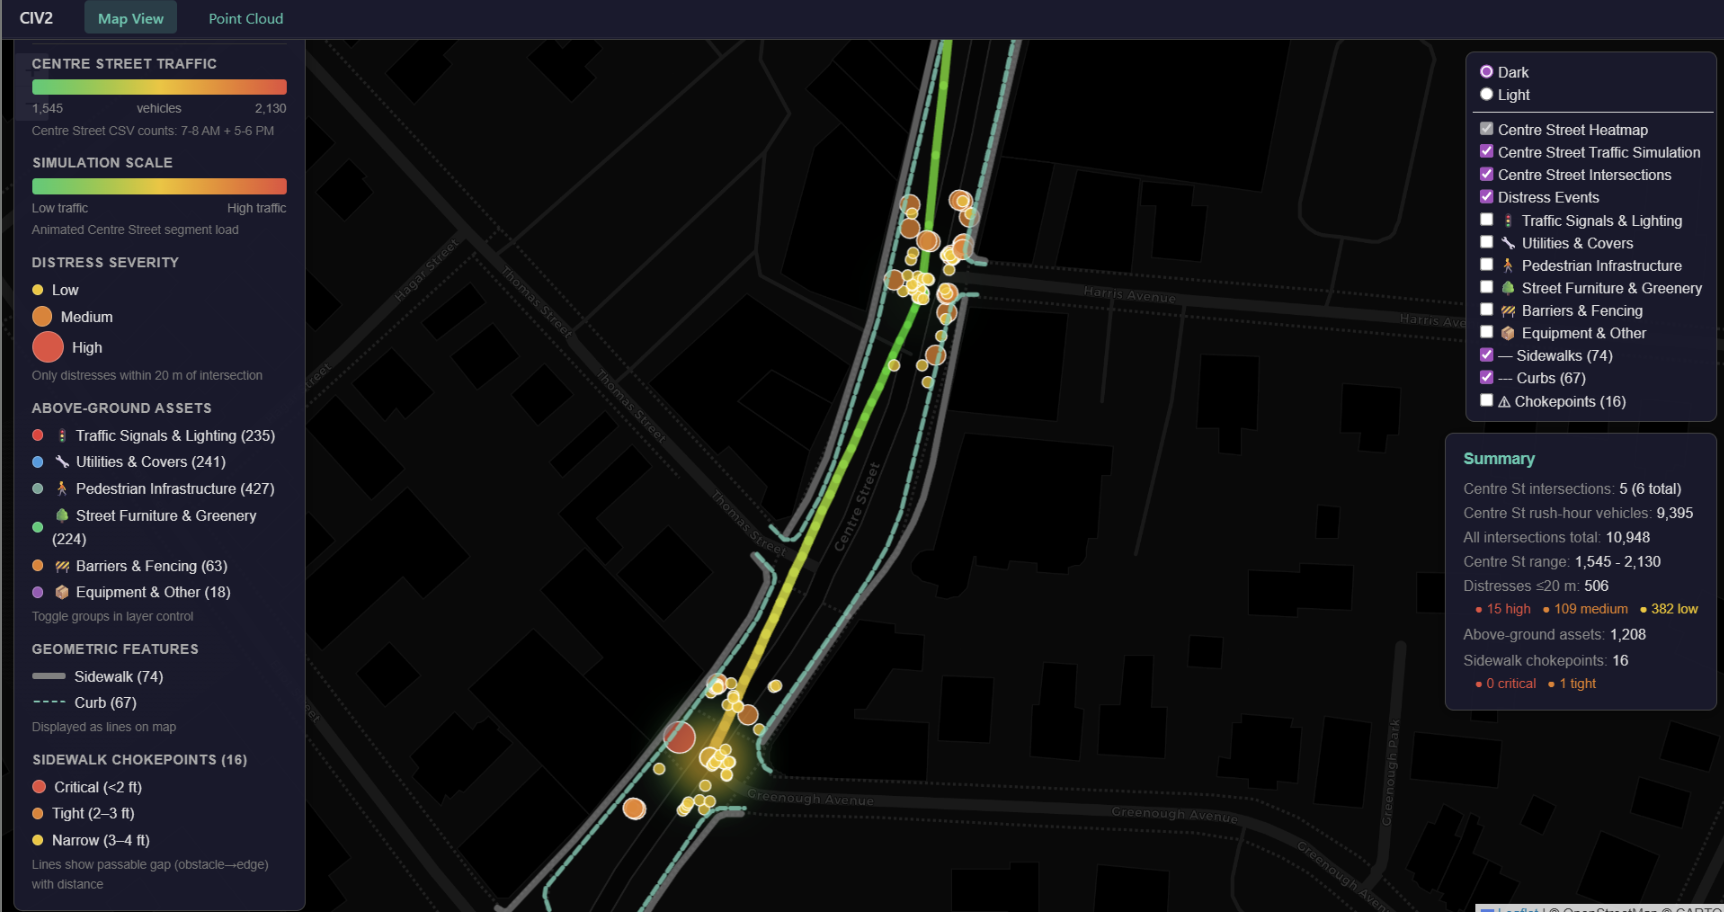
Map View
Elevator Pitch
Pax Romana is a civic infrastructure visualization platform that fuses LiDAR point cloud data, street-level asset mapping, and intersection-level traffic analysis to give urban planners a unified picture of where streets are dangerous, inaccessible, and overloaded. It automatically identifies sidewalk chokepoints where obstacles narrow pedestrian clearance below ADA thresholds, and maps rush-hour traffic concentration across intersections, so planners can pinpoint corridors under stress and explore where traffic could realistically be redistributed.
Problem & Civic Context
Centre-South St is the backbone of a walkable and vibrant Jamaica Plains, yet it comes with its shortfalls. People with disabilities and older adults encounter sidewalk obstacles that reduce passable width below ADA minimums. Pavement distress near intersections creates unsafe conditions for cyclists, stroller users, and pedestrians. Centre-South also functions as a cut-through for regional through-traffic, degrading reliability for the MBTA Route 39 bus and creating dangerous conditions at key intersections. Pax Jamaica intends to allow city officials to see the full picture– and how all of these shortcomings come together.
Impact & Real-World Application
Pax Jamaica enables three specific, realistic planning actions on Centre–South Street:
- ADA Prioritization: The chokepoint layer flags every sidewalk segment where an obstacle (hydrant, utility pole, tree, bench, etc.) reduces effective pedestrian clear width below 4 feet. Each chokepoint includes its obstacle type, precise measurements in feet and meters, condition data, and a LiDAR-derived photo– identifying inaccessible areas everyday people have to struggle to pass through, and are not being spoken about enough.
- Traffic Redistribution Analysis: The intersection turn-count heatmap and corridor gradient directly visualize which sections of Centre–South carry the highest rush-hour vehicle volume. Planners can identify whether traffic concentrates at a few bottleneck intersections (suggesting signal re-timing or turn restrictions) or is spread evenly (suggesting broader calming measures). This directly supports the challenge's goal of assessing whether Centre–South is functioning as a cut-through and testing changes that could improve Route 39 reliability.
- Compound-Risk Identification: Intersections that are simultaneously high-traffic and adjacent to severe sidewalk chokepoints or pavement distress are the highest-priority intervention points — and Pax Jamaica surfaces them in a single view that neither a traffic dataset nor an accessibility dataset alone could provide.
How We Built It
Pax Jamaica is built on two interconnected pipelines, one for pedestrian accessibility and one for traffic analysis — unified in a single interactive web map deployed via Netlify. The foundation is the Cyvl.ai LiDAR-derived asset data. A Python pipeline (inject_assets.py, spatial_join.py) processes LAZ point cloud tiles using laspy, pyproj, and numpy to spatially join above-ground street assets — sidewalks, curbs, curb cuts, ramps, signals, bus stops, trees, utility poles, and more — to their corresponding 3D scan tiles. From there, compute_chokepoints.py uses shapely to pair curb and sidewalk LineStrings, measure the perpendicular corridor width between them, identify point obstacles that fall within that corridor, and compute each obstacle's effective clear width — the passable space remaining for a pedestrian on the narrower side. Any segment below 4 feet is flagged as a chokepoint, documented with its obstacle type, measurements, condition, and photo. The traffic layer ingests 15-minute interval intersection turn counts from combined_intersection_15min_counts.csv. Eight time-slot columns spanning the morning (7:00–7:45 AM) and evening (5:00–5:45 PM) rush hours are summed per intersection to produce a total rush-hour vehicle count. These counts feed three visualizations: a Leaflet heatmap where intensity scales to normalized traffic volume; color-coded intersection markers ranging from blue (low) to red (high); and a road corridor gradient, where each link between consecutive intersections is broken into 30 sub-segments and color-interpolated between its endpoints — a custom approach required because Leaflet does not natively support gradient polyline strokes. Pavement distress events from a separate CSV are filtered to those within 20 meters of a tracked intersection and rendered with severity-coded markers and photos. The front end is built entirely in HTML, JavaScript, and Leaflet.js for the 2D map, with a separate Three.js WebGL viewer and Potree integration for interactive 3D point cloud exploration. A lightweight Flask server handles local development, while the production deployment is fully static on Netlify. The biggest technical challenge on the accessibility side was performing CRS-accurate coordinate transformation when injecting colored marker pillars into LAZ tiles — each pillar had to be placed at the correct ground elevation, requiring a sampled Z-grid approach. On the traffic side, the smoothness of the corridor gradient required the 30-segment interpolation trick, trading rendering simplicity for visual clarity that makes high-stress road segments immediately legible to a planner at a glance.
Original Data Collection & Research
Pax Jamaica is built on four data sources, all tied to the Centre–South Street in JP: Cyvl.ai LiDAR-derived asset GeoJSON (aboveGroundAssets.geojson): Street-level features including sidewalks, curbs, curb cuts, ramps, pedestrian push buttons, traffic signals, bus stops, trees, utility poles, hydrants, and more — extracted from high-resolution LiDAR scans of the JP corridor Intersection 15-minute turn counts (combined_intersection_15min_counts.csv): Timestamped vehicle counts per intersection along Centre–South, used to derive rush-hour totals (8 time-slot columns across morning and evening peaks) Pavement distress survey (all_intersection_distresses.csv): Distress events (type, severity, area, length, photo) geo-located relative to tracked intersections Algorithmically derived outputs: Chokepoint measurements (clear width, corridor width, reduction %, obstacle type) computed by the team using compute_chokepoints.py from the Cyvl.ai asset data
Data Privacy & Security
The project processes only publicly available municipal datasets: open LiDAR scans, labeled street asset GeoJSON, and intersection turn-count CSVs. None of these contain personally identifiable information. Vehicle counts are aggregated at the intersection level — individual vehicles or license plates are never tracked or stored. No user accounts, submissions, or tracking exist in the application. The production deployment is fully static, hosted on Netlify, with no server-side data processing, no database, and no writable endpoints. There is nothing for a user to delete because nothing about any user is ever collected. The source data files (GeoJSON, CSV) are read-only assets served directly to the browser — the same model as a public government data portal.
Addressing Fairness
Uneven LiDAR coverage: Chokepoints can only be detected where the Cyvl.ai data includes both a CURB and SIDEWALK line in close proximity. Blocks that were less thoroughly scanned, or where asset labels are incomplete, will show fewer chokepoints — not because they are more accessible, but because the data is sparser. This creates a risk that under-scanned blocks (which may coincide with historically underinvested areas) appear falsely safe. We tried to surface raw data coverage through the sidewalk and curb layer counts in the map legend, so a planner can visually identify areas with thin asset coverage before drawing conclusions.
Risk 2 — Traffic rerouting burden: Identifying Centre–South as a through-traffic corridor could inform signal changes or turn restrictions that redirect vehicles onto quieter residential side streets. If those streets serve lower-income households or are already burdened by noise and pollution, rerouting could impose new harms on communities with less political power to push back. Mitigation: Pax Jamaica makes no automated rerouting recommendation. It presents turn counts and corridor stress as evidence; a human planner bears full responsibility for assessing where redirected traffic would go and who would be affected. Risk 3 — ADA threshold as a floor, not a ceiling: The 4-foot chokepoint threshold reflects the legal ADA minimum. In practice, many people — those using wider mobility devices, those with visual impairments, families with side-by-side strollers — need more than 4 feet to pass comfortably. Flagging only sub-4-foot segments could create a false impression that everything above the threshold is adequate. Mitigation: Each chokepoint popup displays the full corridor width and percentage reduction alongside the clear width, giving planners the context to evaluate near-threshold segments as well as outright failures.
On Transparency
Pax Jamaica uses no AI or machine learning within the system. Every output is the direct, deterministic result of arithmetic and geometry applied to source data, and every calculation is traceable– however with data and a prototype, there are some limitations our system faces: The corridor gradient orders intersections by latitude — a valid approximation for Centre–South's roughly linear alignment but not accurate for branching or curved street networks. Rush-hour windows cover 7:00–7:45 AM and 5:00–5:45 PM only; off-peak and weekend patterns are not captured. Chokepoints are only detected where both a CURB and SIDEWALK line exist in the asset data — mid-block or under-labeled segments may be missed. Pavement distress events are filtered to within 20 meters of tracked intersections; mid-block distress is currently excluded.
Human-Centered Design
Pax Jamaica was designed around a single principle: the tool surfaces evidence, humans make decisions. No automated recommendation, enforcement action, prioritization score, or rerouting instruction is generated anywhere in the system. Every output is an observation about physical reality, presented to a human who decides what to do about it. The intended users are urban planners, maintenance staff, transportation engineers, and District 6 advocates. The decisions being supported are: which sidewalk barriers to fix first, which intersections to investigate for signal re-timing or turn restrictions, and where to focus community advocacy and capital budget requests. All of these are high-stakes civic decisions that Pax Jamaica informs. Human override is not an optional add-on — it is the only path from Pax Jamaica to any real-world action. A chokepoint flagged by the tool does not automatically generate a work order. A high-traffic intersection highlighted in red does not automatically trigger a signal change. In every case, a city employee or elected official must review the evidence, apply local knowledge and community context, and decide to act. Pax Jamaica makes that review more informed, not less necessary. The zoom-gated chokepoint layer is a concrete example of designing for human workflow: chokepoints only appear at zoom ≥17, matching the scale at which a planner would realistically be assessing a specific block. At city-wide zoom levels, the traffic heatmap and corridor gradient provide the right level of abstraction for corridor-scale decisions. The tool scales its detail to match the decision being made.
On Inclusion and Accessibility
Steps taken: The 2D map (Leaflet.js) is keyboard-navigable — zoom controls, layer toggles, and the layer control panel are all reachable via Tab and operable via keyboard. All popup content is structured HTML text, readable by screen readers when a marker is focused and activated. The map renders at full viewport width on mobile devices, making it usable on a phone for a resident walking the corridor. Asset condition data, measurements, and photos are included in every popup so that users who cannot interpret color alone (e.g., color-blind users) can still access the underlying data in text form The color scales used (blue→red for traffic, green→yellow→red for chokepoints) are paired with explicit numeric labels in every popup, so color is never the sole carrier of meaning.
Barriers we are naming honestly:
The user-scalable=no viewport tag on the point cloud viewer (potree_viewer.html) prevents pinch-to-zoom on mobile — an accessibility anti-pattern we identified in code review and flag as a one-line fix for the next iteration The 3D point cloud viewer is not screen-reader compatible and is effectively desktop-only in practice The Leaflet map's dark color scheme, while visually polished, has not been formally tested against WCAG contrast ratio requirements. Our system is currently English-only, which creates some barriers to non-english speakers wanting to understand the problem and use Pax Jamaica.

Log in or sign up for Devpost to join the conversation.