Inspiration
Walking past a cracked sidewalk or a faded crosswalk is something most people do every day without thinking twice. Not because they do not care, but because reporting it feels like too much effort. You have to find the right portal, figure out the right category, describe the damage yourself, and hope someone reads it. Most people just keep walking. That stuck with us. U.S. cities are sitting on 435 billion dollars in deferred infrastructure maintenance according to the ASCE 2021 Infrastructure Report Card. The problem is not that cities lack the will to fix things. It is that they never hear about most of the damage in the first place. We wanted to remove every possible barrier between a person noticing a problem and that problem becoming an actionable repair ticket.
What it does
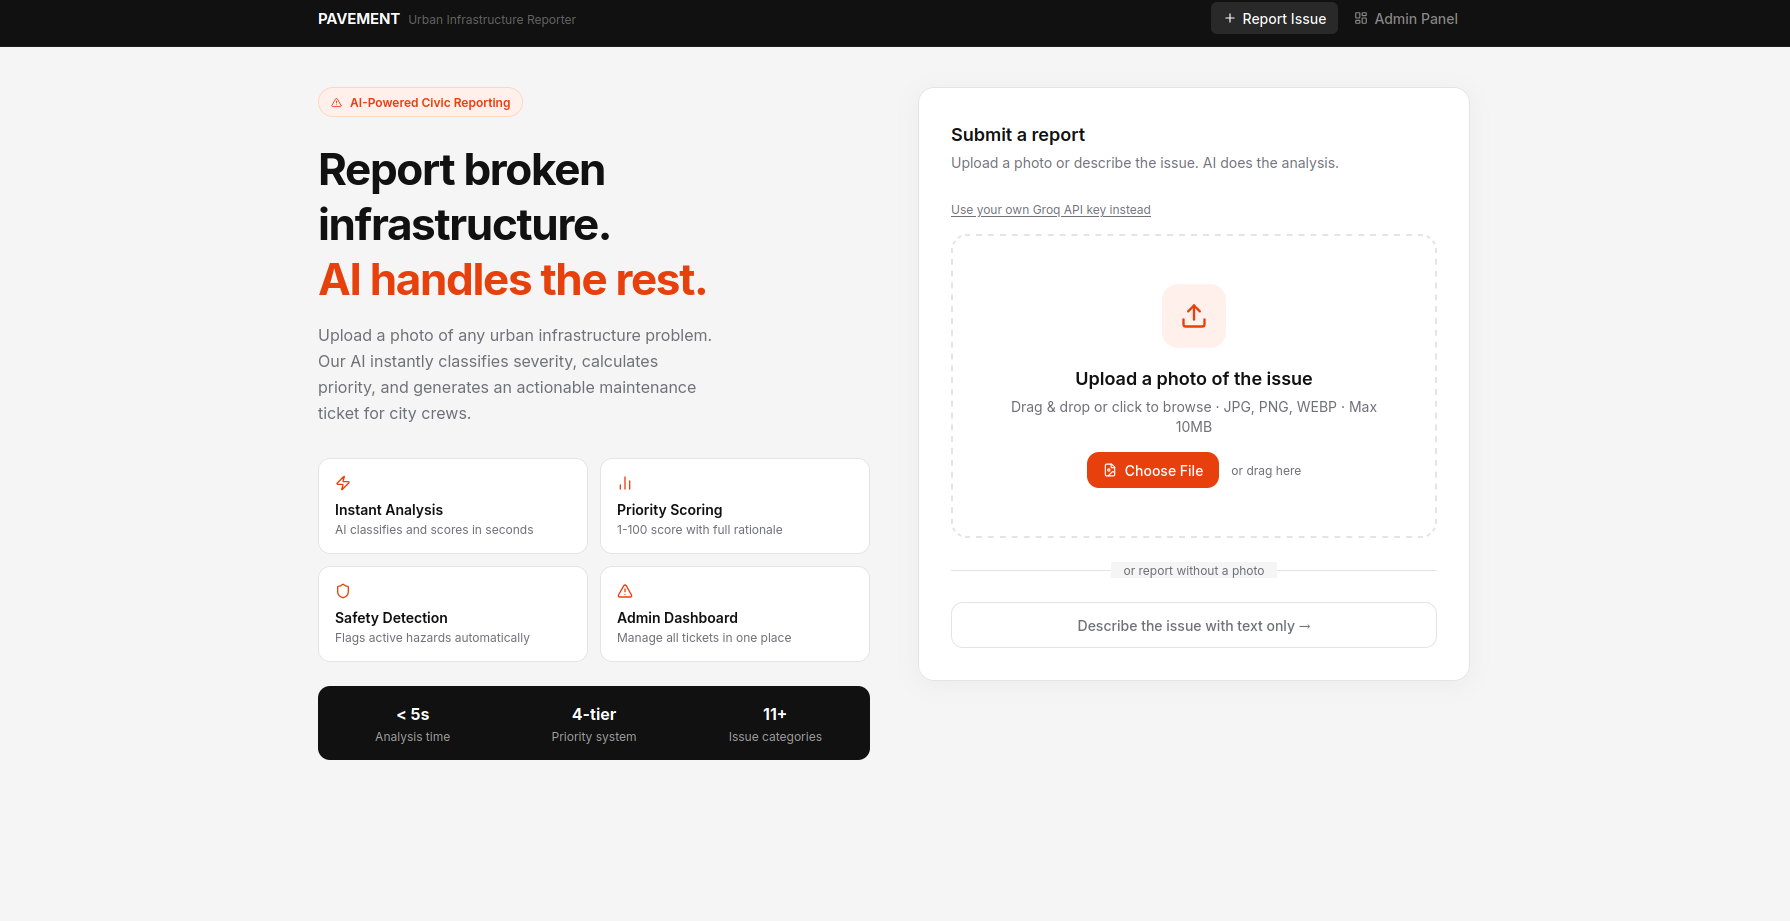
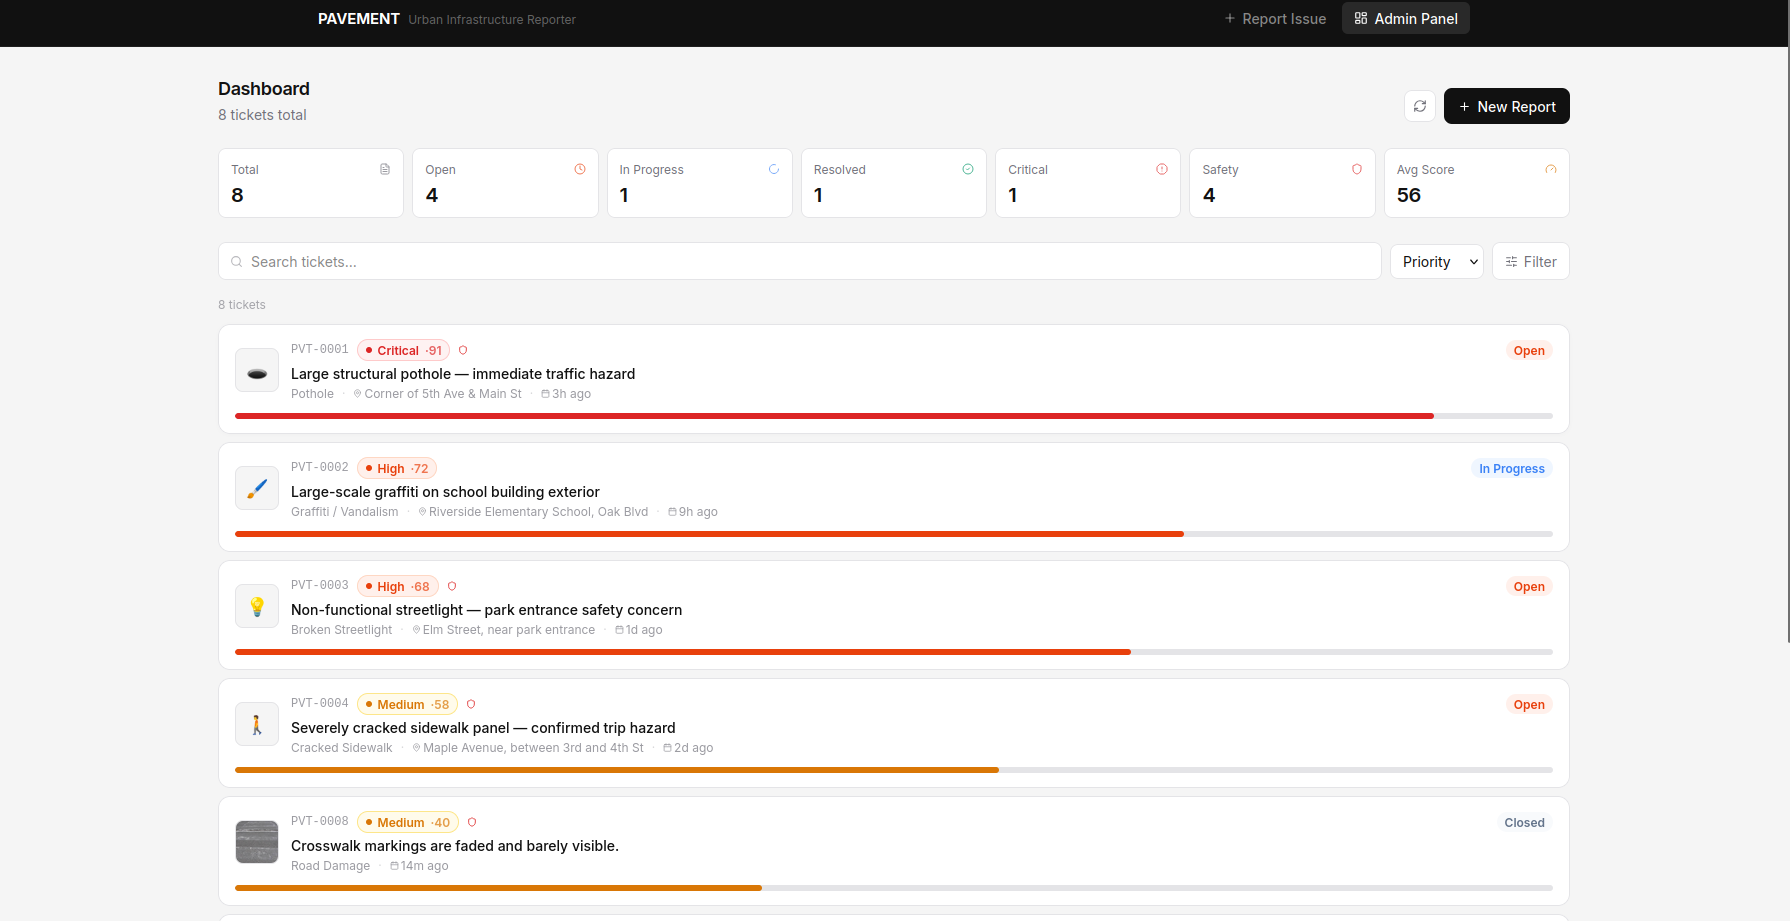
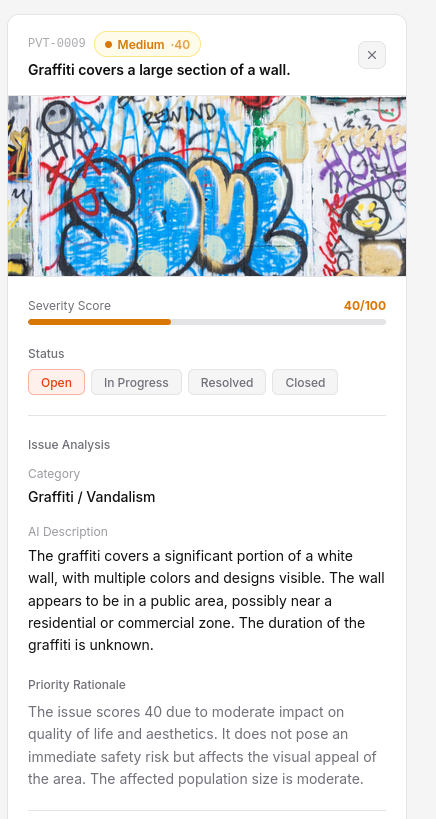
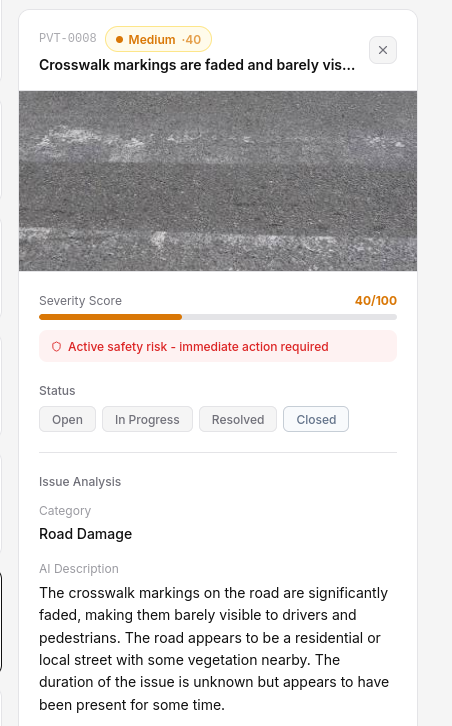
Pavement lets anyone report broken urban infrastructure in seconds. You open the app, upload a photo of the damage, optionally add a short description, and the AI takes over from there. The vision model analyzes the image to identify what type of infrastructure is damaged and how severe the damage is. It then generates a fully structured repair ticket including issue category, priority score from 1 to 100, safety risk flag, estimated repair cost, affected population, recommended action, and urgency window. If the image does not contain any infrastructure damage, the model says so and no ticket is created, which keeps the data clean. On the admin side, city maintenance teams can view all submitted tickets sorted automatically by priority score. They can filter by status or urgency, drill into the full AI rationale behind each score, update ticket status, and leave internal notes for crews. No manual triage, no guessing what to fix first.
How we built it
The frontend is built with Next.js and React, using Tailwind for styling. All ticket data is stored in localStorage, which keeps the architecture simple and lets the app run without any backend infrastructure. The core AI layer uses Groq's API running meta-llama/llama-4-scout-17b-16e-instruct, a multimodal model capable of both vision understanding and structured reasoning. When a photo is submitted, the model receives the image alongside a detailed system prompt that instructs it to classify the infrastructure type, assess damage severity, calculate a weighted priority score, detect active safety risks, and return everything as structured JSON. The prompt engineering behind the priority scoring accounts for factors like pedestrian vulnerability, ADA compliance risk, estimated affected population, and infrastructure criticality. If the image contains no infrastructure damage, the model returns a clear rejection with zero cost and no ticket generated. This is not a hardcoded rule but a genuine model judgment, and it works reliably. Geocoding is handled through the browser's native geolocation API combined with OpenStreetMap's Nominatim for reverse geocoding addresses from coordinates.
Challenges we ran into
Getting the AI output to be both accurate and consistently structured was the main challenge. Vision models can describe what they see in many ways, but we needed strict JSON with specific fields every single time, even for edge cases like non-infrastructure images, partial damage, or ambiguous photos. A lot of the work went into crafting a system prompt that guided the model toward reliable, consistent outputs without sacrificing the quality of the analysis itself. Balancing priority scoring was also non-trivial. A pothole in front of a hospital should score differently than the same pothole on a quiet residential street. Building a scoring rubric that felt fair and defensible across very different infrastructure types took several iterations.
Accomplishments that we're proud of
The model's ability to reject non-infrastructure images cleanly was something we did not expect to work as well as it does out of the box. Showing that live in a demo, where a completely unrelated photo gets caught immediately, makes the whole system feel trustworthy in a way that is hard to fake. We are also proud of how usable the admin dashboard turned out. It is the kind of interface where you can immediately see how a real city team would integrate it into their morning workflow.
What we learned
Prompt engineering for structured outputs is its own discipline. Getting a vision model to return clean, consistent JSON across wildly different input images required much more careful instruction design than we expected. Small changes in phrasing had real effects on output reliability.
What's next for Pavement
The most obvious next step is connecting to real 311 systems so tickets can be automatically forwarded to the right city department. Beyond that, aggregating reports geographically would let you build heatmaps of infrastructure decay across neighborhoods, which is where the real policy impact starts to show up. We would also like to add a public-facing map so residents can see what has been reported and what has been fixed, closing the feedback loop that current systems completely ignore.
Built With
- groq
- meta-llama/llama-4-scout-17b-16e-instruct
- next.js
- nominatim
- openstreetmap
- react
- tailwind-css
- typescript

Log in or sign up for Devpost to join the conversation.